7.5 Density of the workforce by area
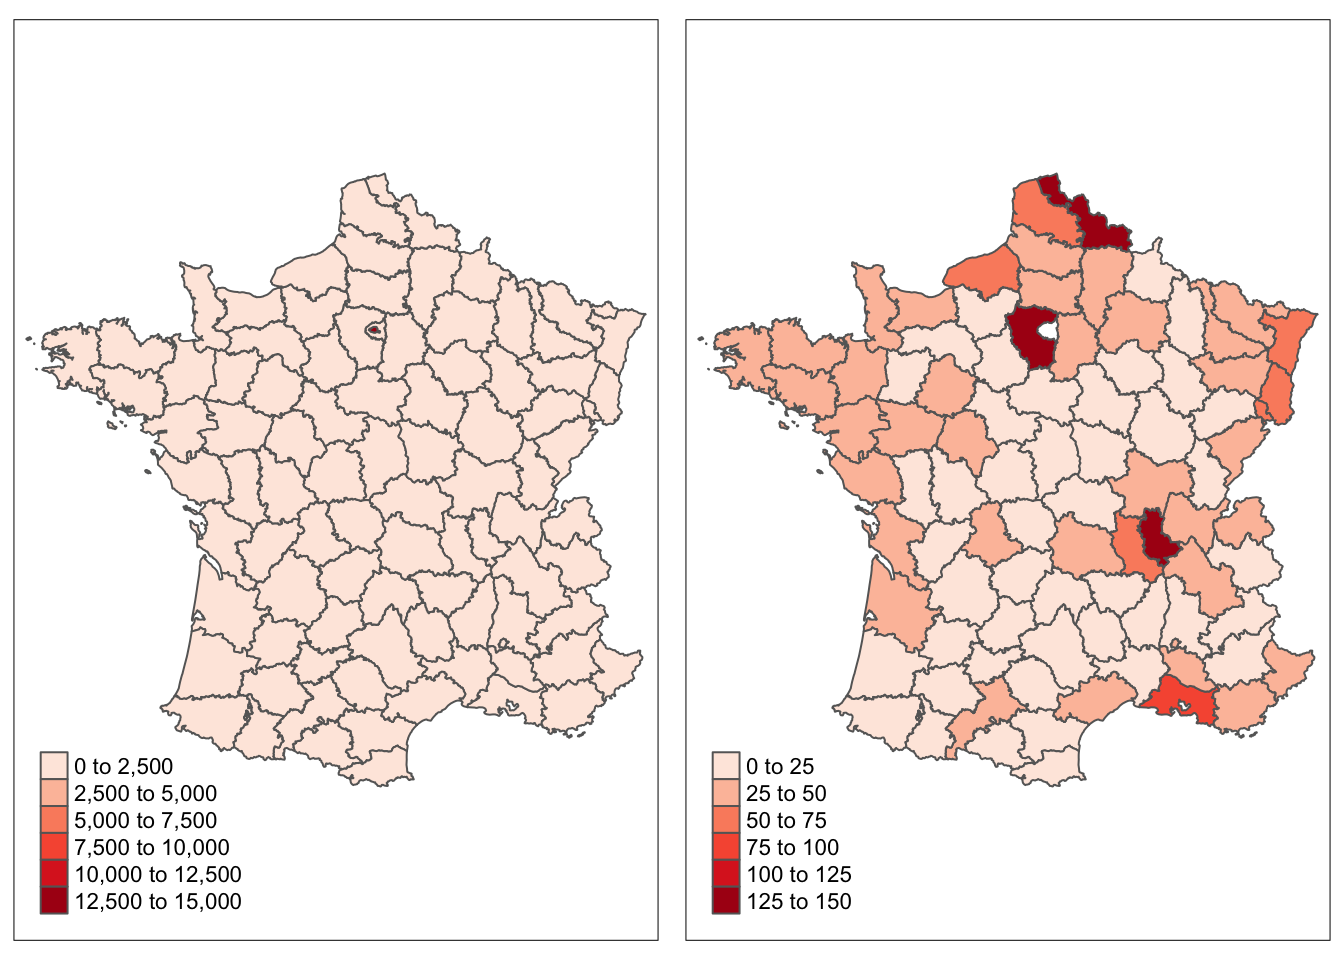
Bertin included four maps of the density of the workforce by area, thousands per square kilometre, on p.117 of his book. Every department has the relevant value written in, apart from Seine (covering Paris as well) for which the value is written at the top of each map, as the corresponding area is so small. He does not discuss what might be seen in the data although there are some unusual features. Choropleth maps for densities of the total working population, both including Paris and Seine and excluding them, are shown in Figure 7.6.

Figure 7.6: Maps of the density of the total working population in thousands per square kilometre in France in 1954, all departments (left), excluding Seine and Paris (right)
The values for Paris and Seine for total density are so high that no differences can be seen amongst the other departments in the first map. Looking closely it is just about possible to see that Paris is coloured dark red. The map on the right has a completely different scale (by a factor of 100) and shows that some of the departments with the otherwise highest densities were on the western edge of Seine. Despite the dramatic change in scale, many of the departments are still in the lowest grouping.
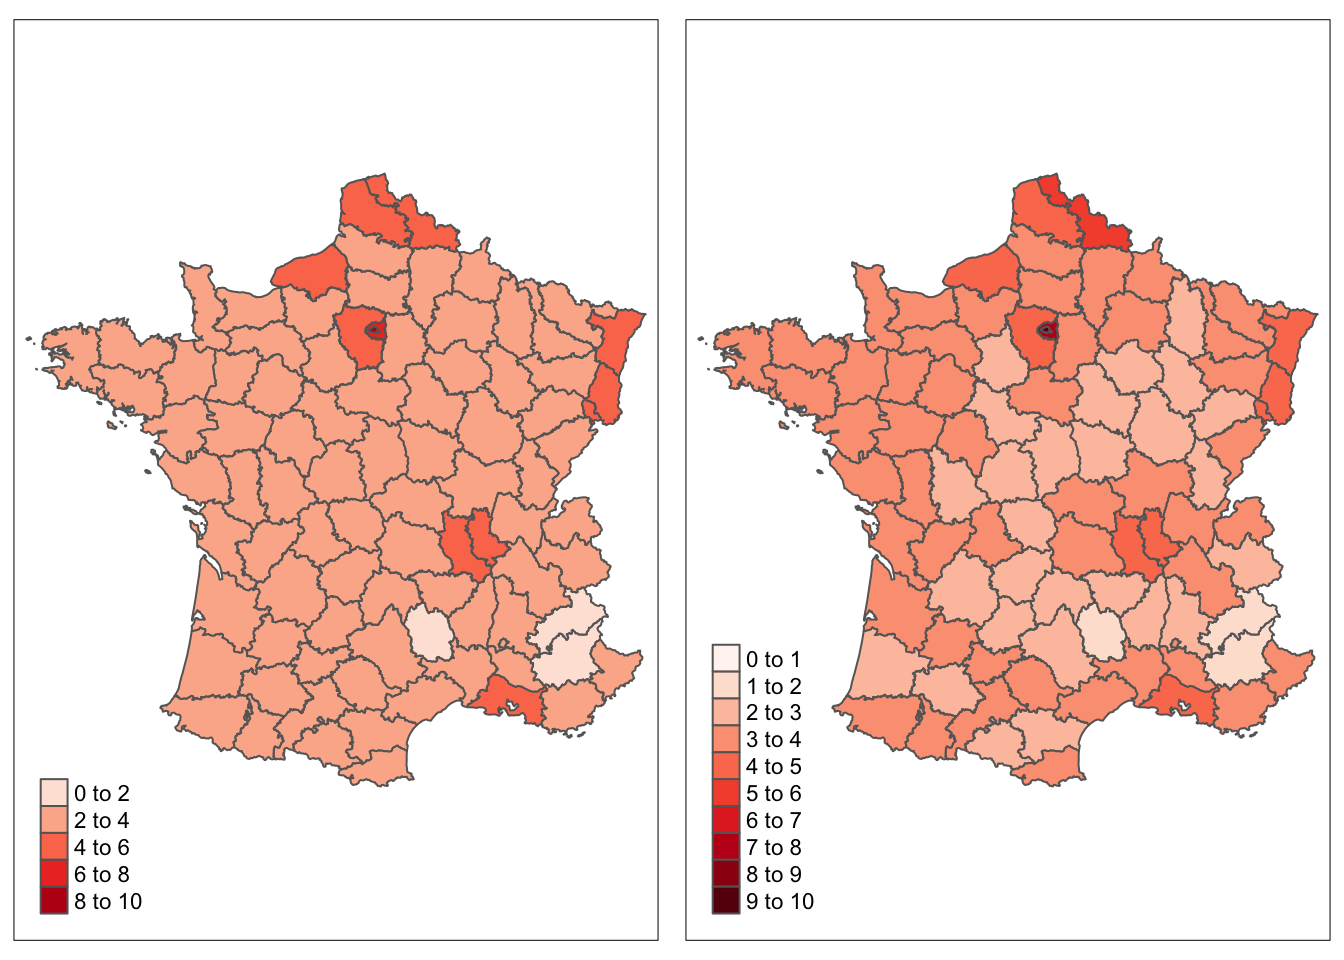
An alternative that avoids excluding departments is to use natural logarithms of population density. Figure 7.7 shows two versions, one using a default colour scale and one using a more detailed one. The first puts most of France in the same group, emphasising the three departments with lowest density in the South and Southeast and the few high density departments. The second suggests a difference in population density between the West and the Centre, apart from the departments with very high or low levels.

Figure 7.7: Maps of the log of population density of the total working population in thousands per square kilometre in France in 1954, default scale (left), more detailed scale (right)