9.1 Survey results by age, sex, and race
Annenberg carried out rolling cross-section surveys for the US presidential elections of 2000, 2004, and 2008. The interviews for the 2004 National Annenberg Election survey were carried out between October 2003 and November 2004. Questions were asked on a range of topics and the dataset includes responses to many, but not all. Only a few questions are studied here. A third of respondents were asked if they would favour or oppose a law allowing same-sex marriage in their state, while all respondents were asked if they were in favour of or opposed to introducing a Constitutional Amendment making same-sex marriage illegal.

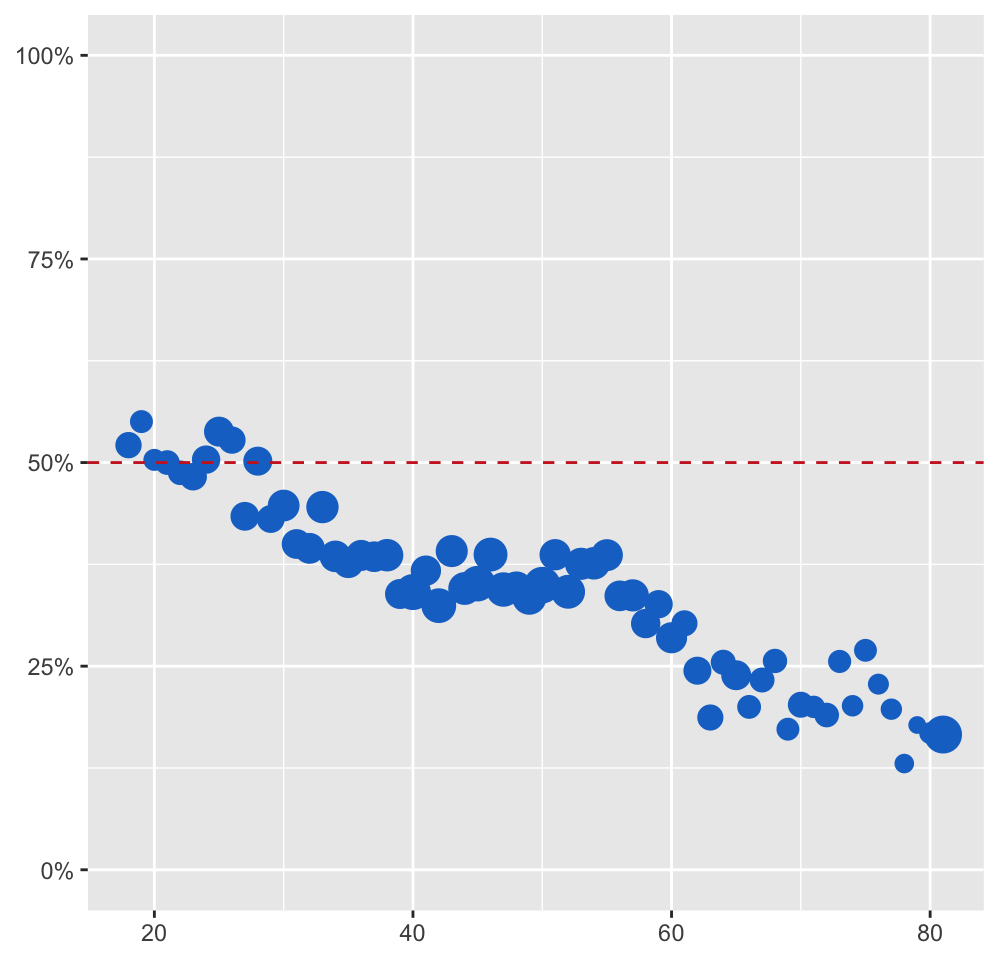
Figure 9.1: Support for same-sex marriage at state level by respondent age. A red dotted line marks 50% support. Cases with any values missing have been excluded and data for ages over 80 combined into one value at 81. Point areas are proportional to the number of respondents of that age.
There is a fairly steady decline in support by age, starting with a few young ages with majority support for same-sex marriage (amongst those expressing an opinion, those responding “Don’t know” or refusing to answer have been treated as missing). With increasing age it looks like a step function with about the same level of support between ages 40 and 55 and similarly between ages 62 and 77. This was discussed in Gelman et al. (2020) where they suggested and compared several nonlinear models.
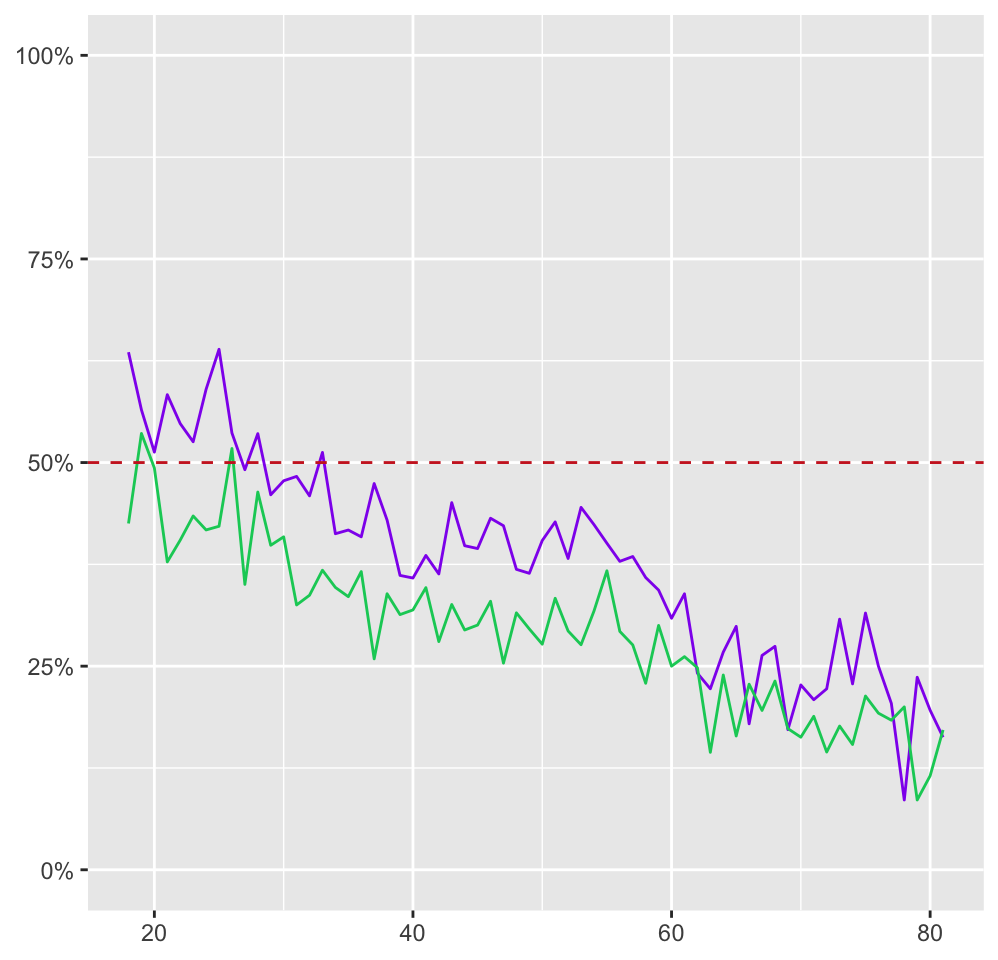
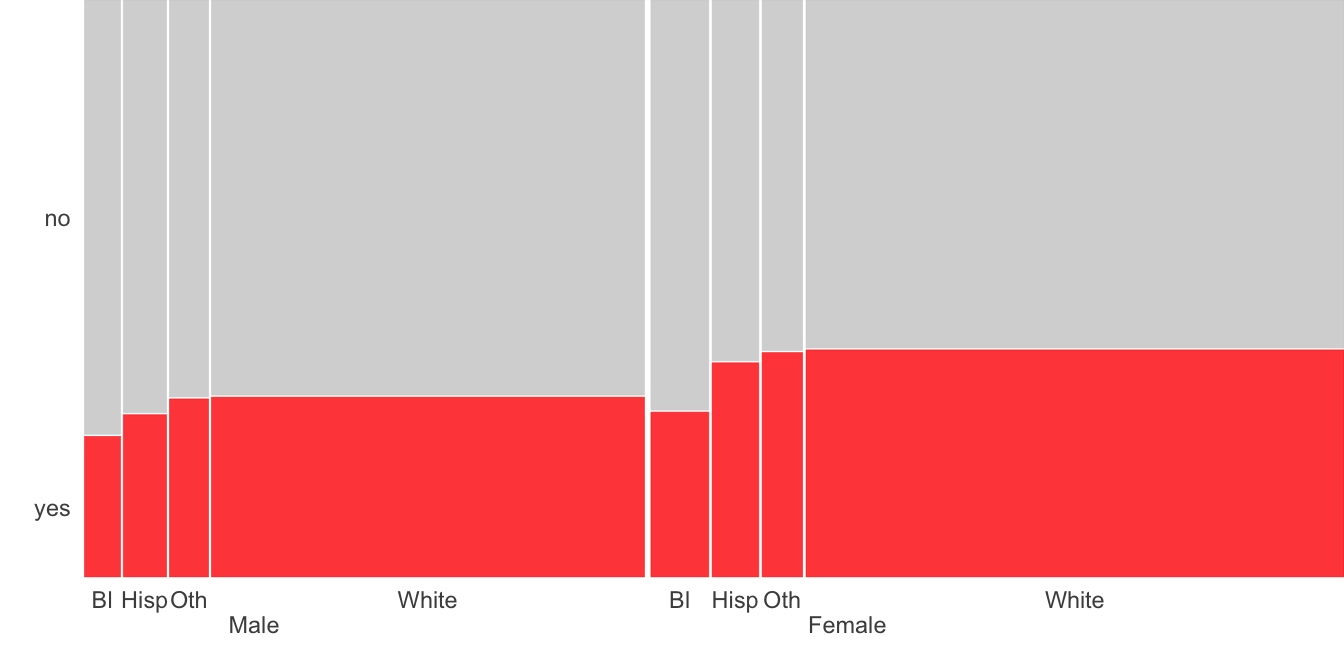
The dataset is large enough to look at opinions by age and sex together. Figure 9.2 shows that females are more in favour than males at almost every age. The effect on these opinions of sex and race together can also be investigated. Figure 9.3 shows a doubledecker plot for this. The patterns of support by race are the same for males and females, with female rates being higher. Rates for blacks are lowest.

Figure 9.2: Support for same-sex marriage at state level by age of respondent for females (purple) and males (green)

Figure 9.3: Support for same-sex marriage at state level by sex and race