6.3 How many countries and individuals competed?
The second Olympics dataset covering both Winter and Summer Olympics is available from Kaggle (Griffin (2019)). This has also been scraped from the web and aimed to include all participants from the modern Olympic Games, not just finalists, as in the first dataset. It also includes the 1906 Intercalated Games, then considered Olympic Games, but not now and not included here. Medals, if any, are reported, but not the performances. The events are named differently in various ways in the two datasets, which makes it difficult to merge them. For example, in the first dataset there is the cycling event “team-pursuit-4000m-men” and in the second one it is called “Men’s Team Pursuit, 4,000 metres”. More surprisingly—and unexpectedly—the second dataset includes the participants in the Arts Competitions that were held in the Games of 1912 to 1948. This is how the famous painters Max Liebermann and Sir John Lavery were both able to participate in the 1928 Games.
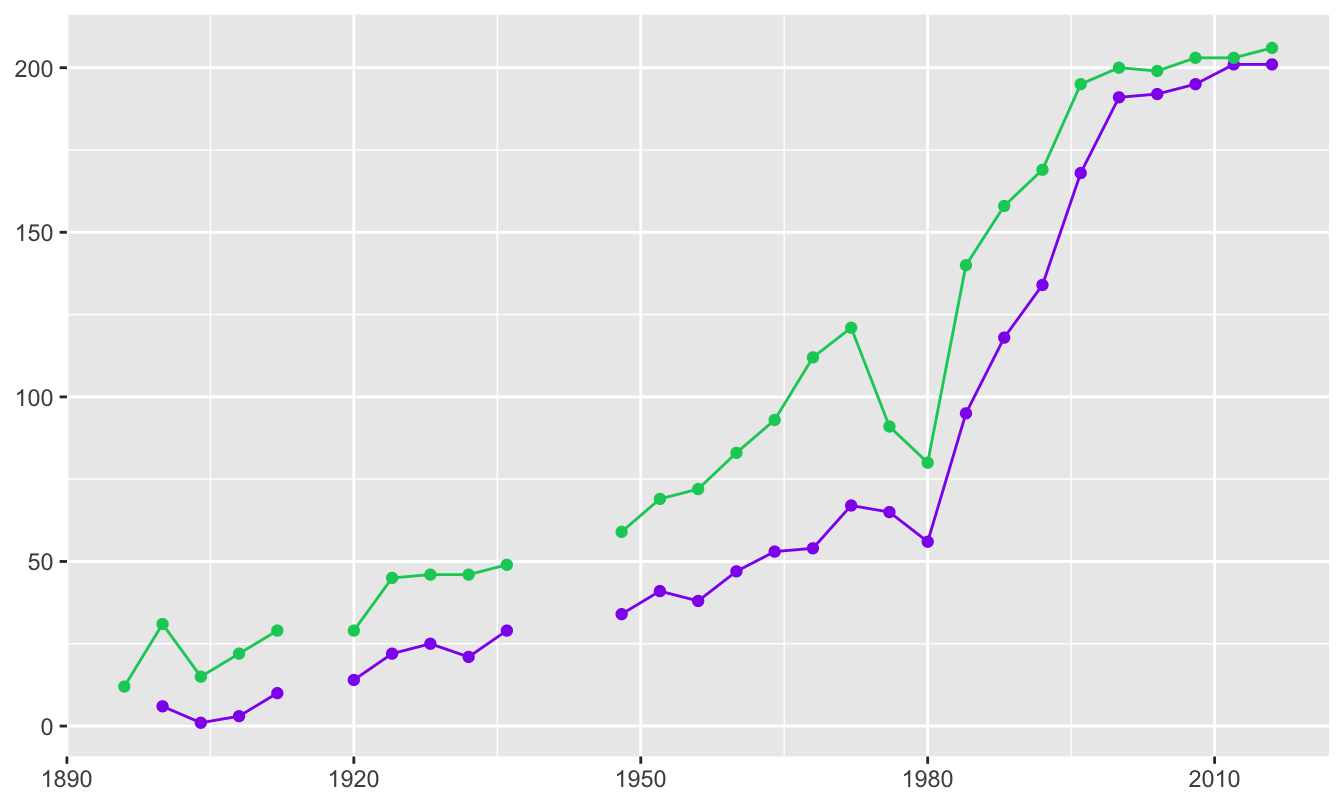
The numbers of countries sending teams for men and women to the Summer Games are shown separately in Figure 6.11.

Figure 6.11: Numbers of countries competing at the Olympic Games over the years (male numbers in green above, female in purple below)
The number of countries has steadily increased with the exception of the 1976 Montreal Games (when 29 countries, mainly African, did not take part because New Zealand had played South Africa at rugby and had not been banned from the Olympics as a consequence) and the 1980 Moscow Games (when over 60 countries did not take part because of the Soviet invasion of Afghanistan). There was also a boycott in 1984 at Los Angeles when 14 countries led by the Soviet Union did not take part. Since the 2000 Games in Sydney the numbers of countries with female teams is almost equal to the number of countries with male teams. (An elegant and more detailed visualisation of the numbers of countries taking part can be found at Nicault (2021).)

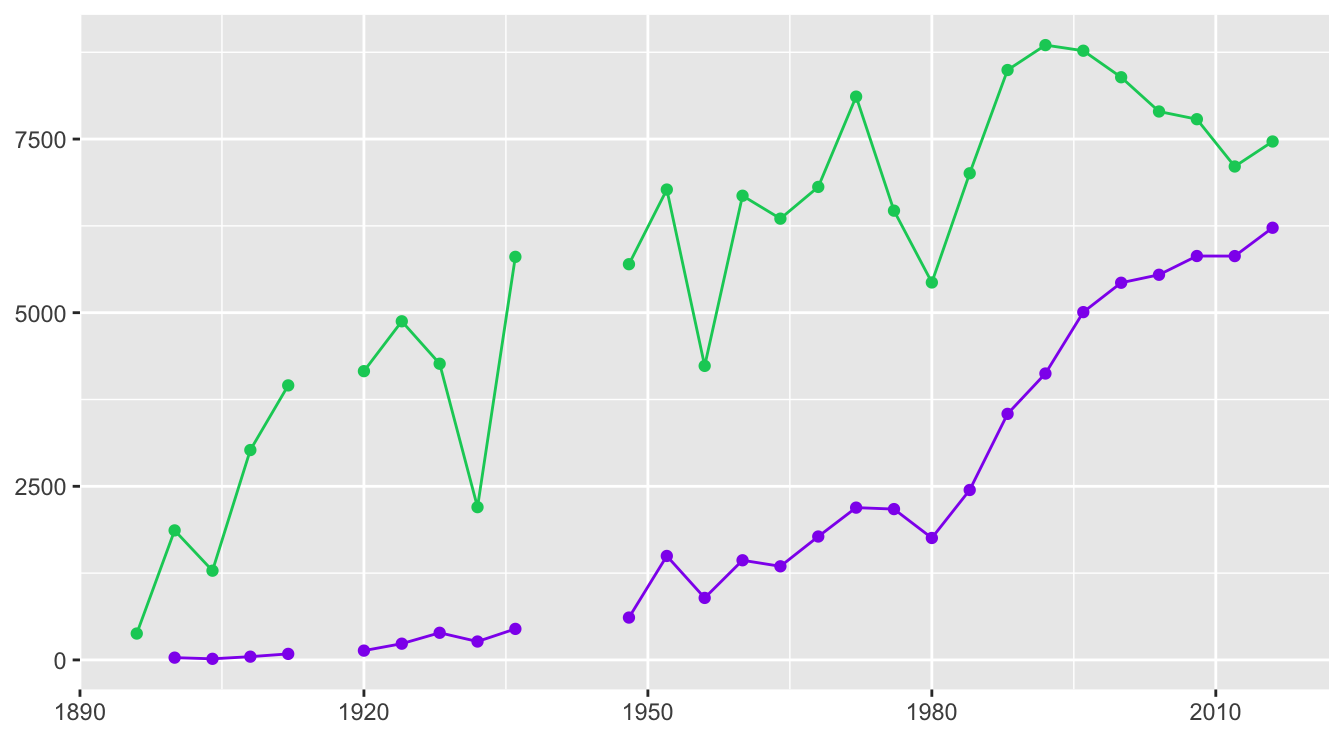
Figure 6.12: Numbers competing at the Olympic Games over the years
More males compete as can be seen from Figure 6.12 showing the numbers of participants by sex. While the number of female participants has risen relatively steadily, the numbers of male participants declined at Los Angeles in 1932 (because of the Depression), at Melbourne in 1956 (possibly because the Games were held in November and December, the Australian summer), and at Moscow in 1980 (because many countries did not take part). There was also something of a reduction in numbers of male participants between the peak of 8772 in 1996 at Atlanta and the low of 7105 at London in 2012.
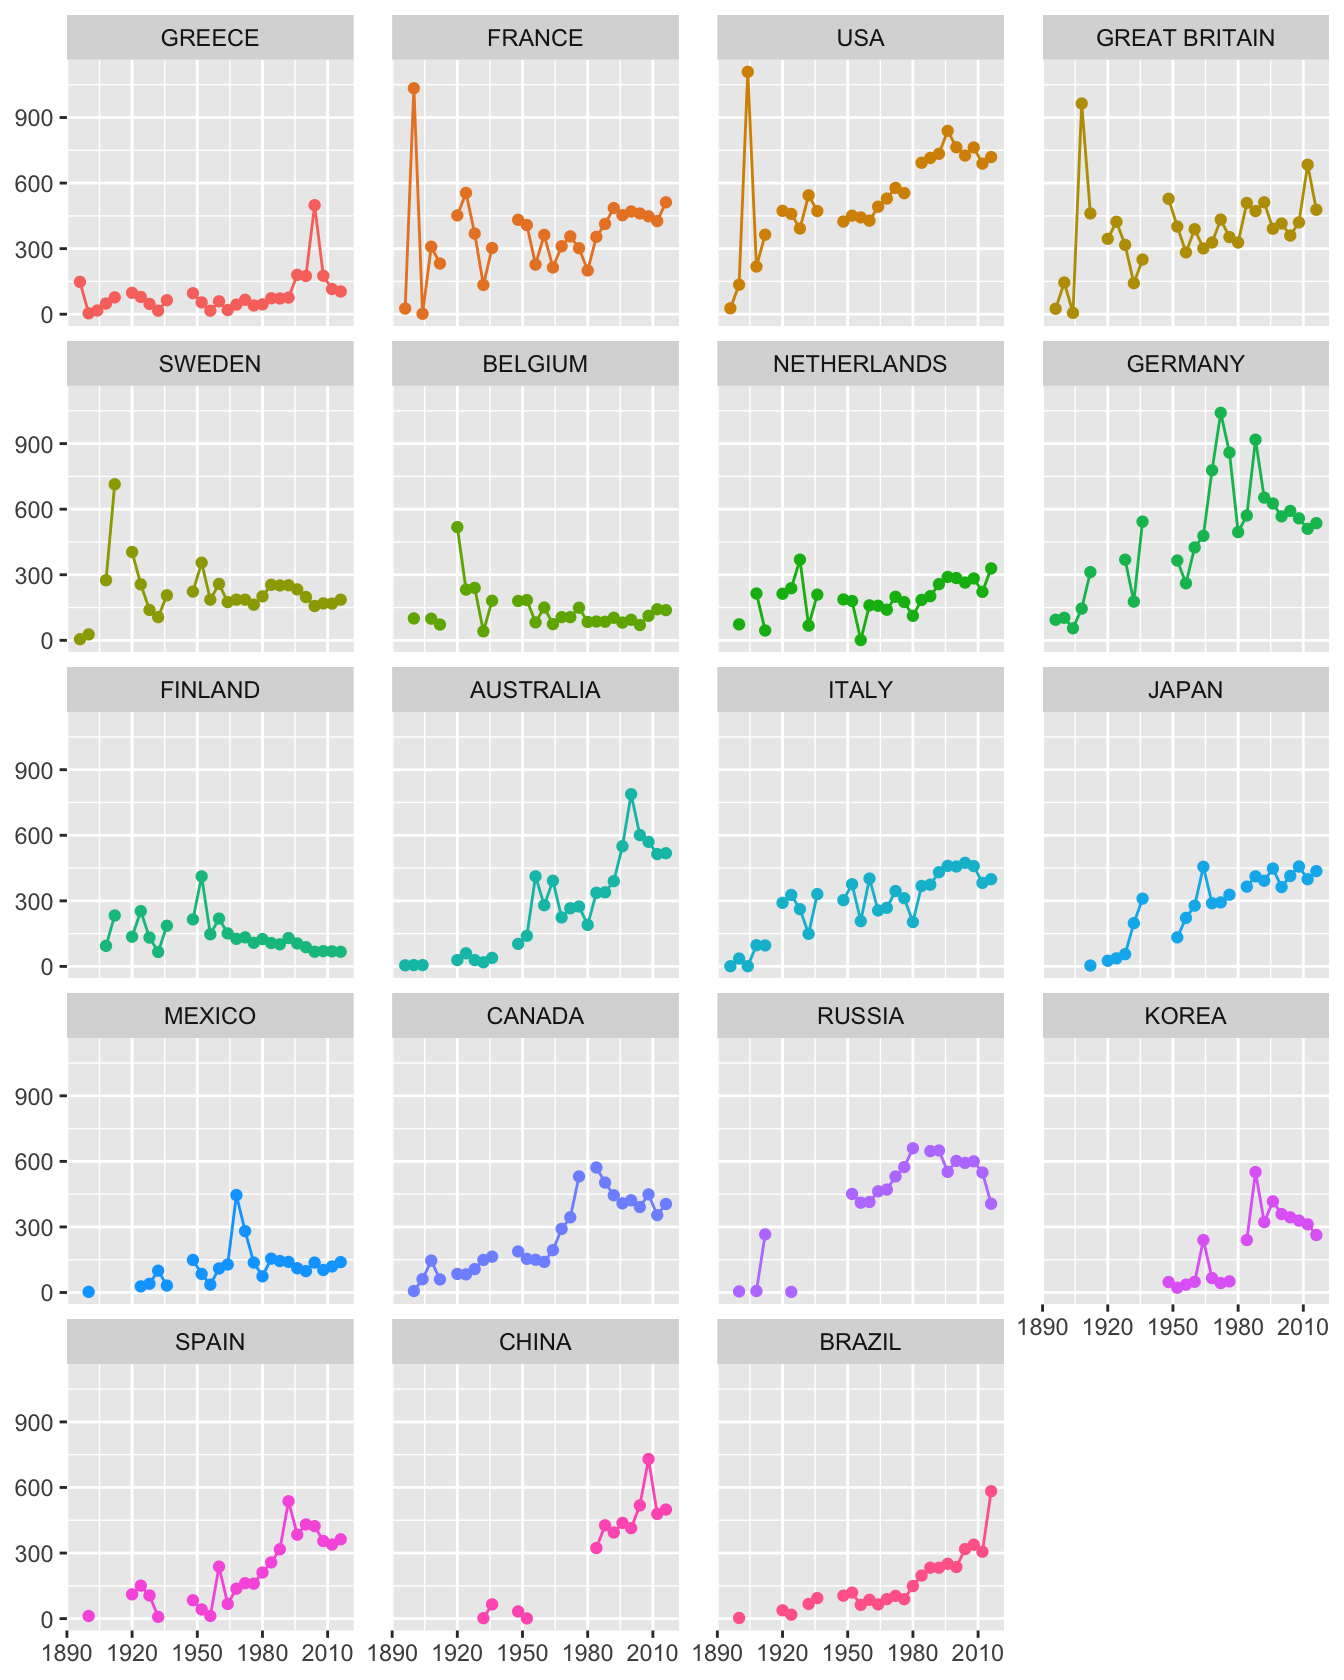
Looking at the time series for individual countries picks out a feature that is obvious with hindsight (Figure 6.13), there are more participants from a country when it is the host. The early peaks of 1900 for France, 1904 for USA, 1908 for Great Britain, 1912 for Sweden, and 1920 for Belgium are unmistakable. Travel time and costs would have influenced the participation of other nations then. Also obvious are the peaks of 1968 for Mexico, 1972 for Germany, 2004 for Greece, 2008 for China, and 2016 for Brazil. Less obvious are 1896 for Greece, 1924 for France, 1936 for Germany, 1948 for Great Britain, 1952 for Finland, 1956 and 2000 for Australia, 1964 for Japan, 1988 for Korea, and 1992 for Spain. Other peaks may be due to (relative) geographic nearness, such as numbers of Korean and Australian participants at Tokyo in 1964.

Figure 6.13: Numbers of participants at the Olympics for countries who have hosted the Games (in order of first hosting)
The figures for Russia are for Imperial Russia before 1914, for the Soviet Union till 1988, for the Unified team of 12 of the former 15 Soviet Union republics in 1992, and for Russia since 1996. In 1924 no Soviet Union team took part, but three competitors in the Arts Competitions called themselves Russian. Figures for Germany include those from both East and West between 1968 and 1988.

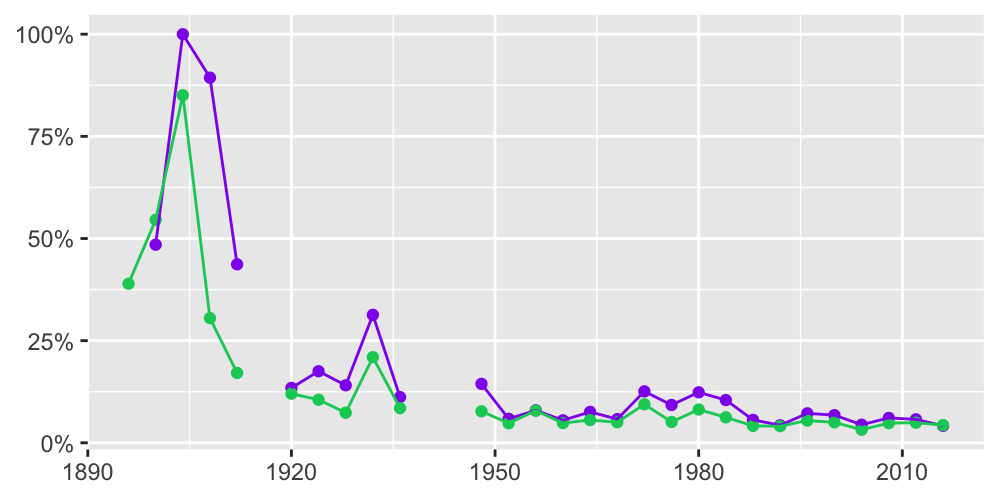
Figure 6.14: Percentages of host country participants at the Olympic Games over the years for women (purple) and men (green)
Host country dominance at the early Olympics is shown in Figure 6.14 for both women and men. In 1904 at St Louis, only 16 women took part and they were all American. 85% of the participants at the 1904 Olympics were American.
Answers The dataset including performance data needed a lot of editing, but included much interesting information. Gold medal performances have improved since the early Games, but not so much lately. More and more countries take part in the Olympic Games and the number of competitors has increased as well. Individual countries have had their highest number of participants when they have been host nation.
Further questions How do changes in performance over time look when logarithms of results are used instead of actual results? Might it be useful to compare results to world records over time? Is there evidence of possible use of doping in earlier Games before more stringent controls were introduced?
Graphical takeaways
- Good orderings make patterns visible. (Figure 6.4)
- After fixing errors and excluding unusual cases, redrawn graphics reveal more information. (Figures 6.5 and 6.6)
- When time series overlap, use faceting to pick out patterns in individual series. (Figures 6.8 and 6.9)
- Regular time series should be plotted so that it is clear where data are missing. Plotting both points and lines helps. (Figures 6.11 to 6.14)