3.2 Movies in IMDb over the years
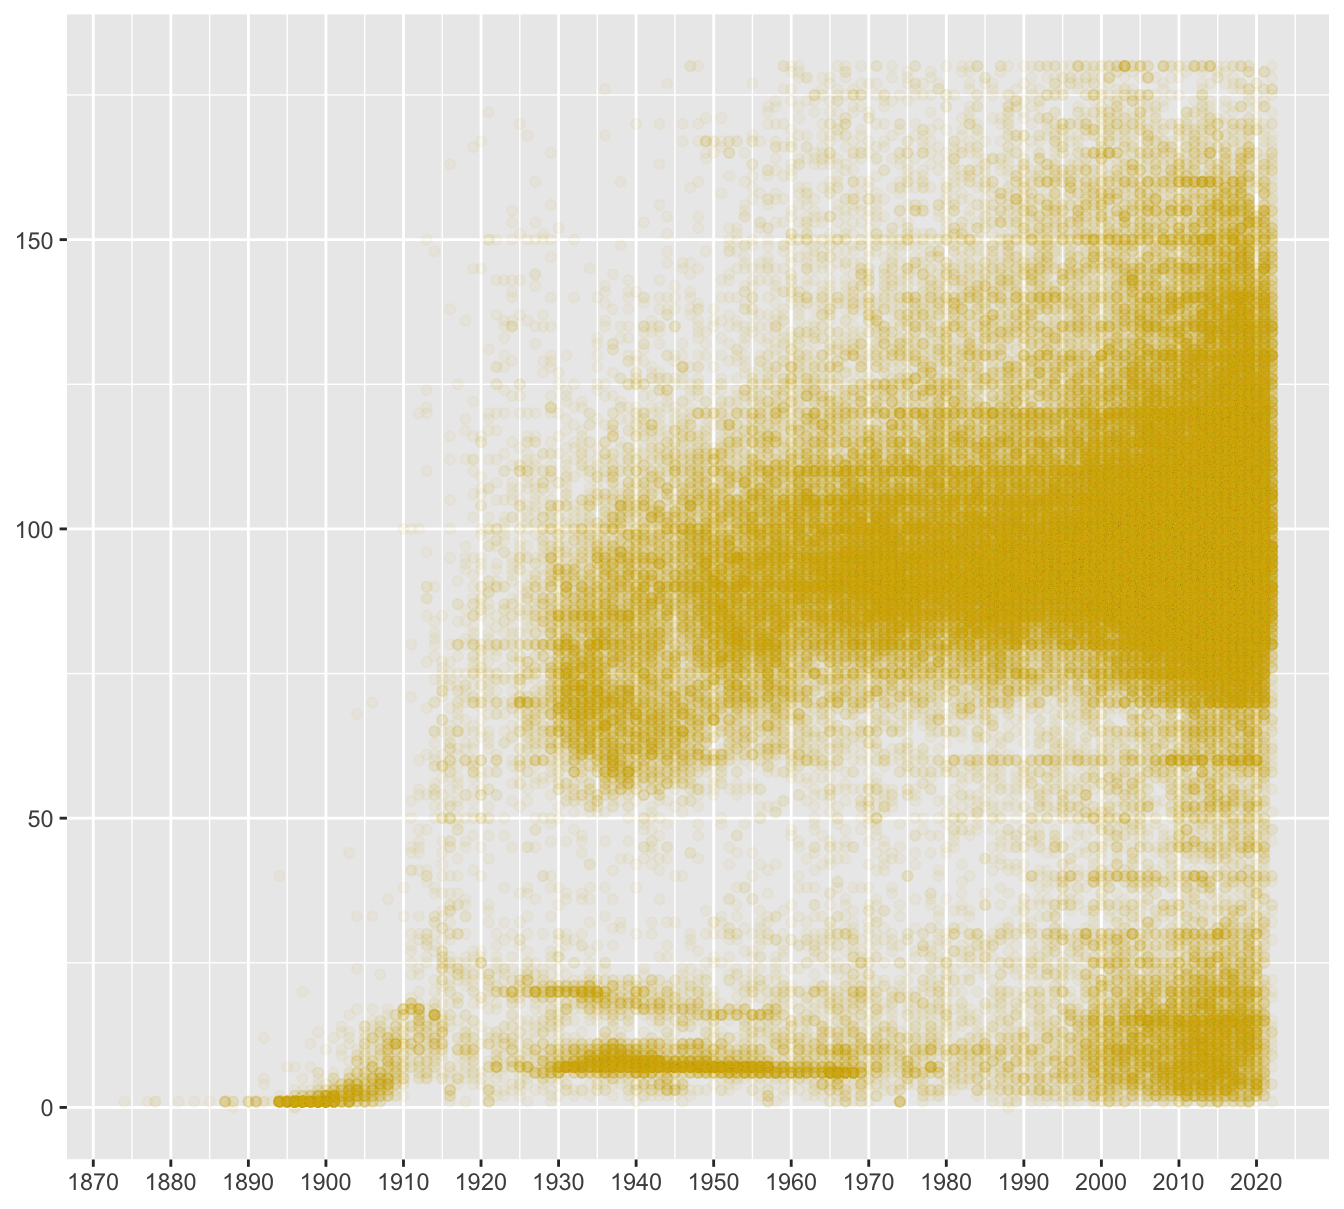
Figure 3.3 looks at whether movie runtimes changed over time. Alpha transparency has been used to reduce the effect of overplotting and to show where there is a lot of data.

Figure 3.3: Movie runtimes in minutes by year of production for films of 3 hours or under using alpha=0.05
Early movies were short and later on there was a mixture of films and shorts. The distribution of runtimes each year and the number of films each year are only hinted at in this scatterplot. The following graphics use boxplots and a histogram to provide more informative views.
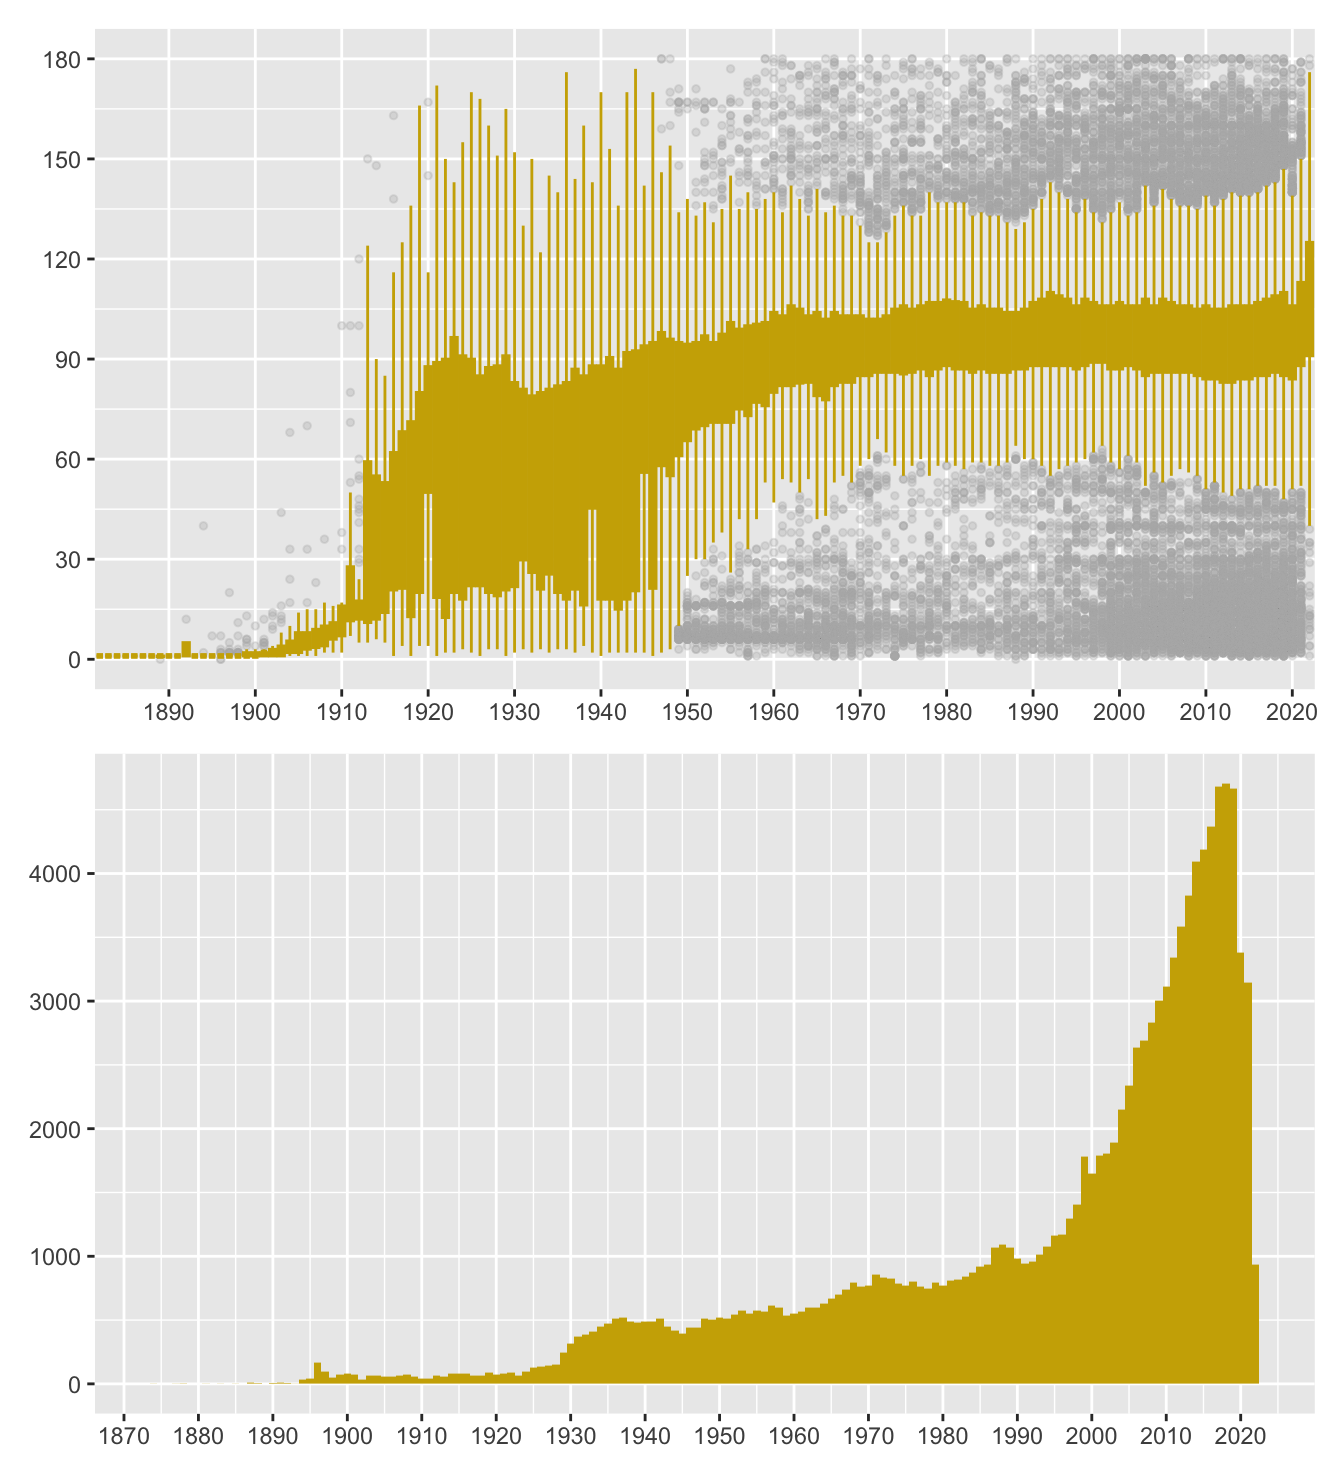
Figure 3.4 displays boxplots by year with a histogram of the number of movies in each year below. The runtime distribution has been fairly constant for over 50 years. The slight rise recently may reflect incomplete recording, as the lower plot shows fewer films produced in the latest three years included overall. This is obvious for 2022, for which only the first six months could be covered. The numbers for 2020 and 2021 suggest that it may take time for all films for a year to be added to the database.

Figure 3.4: Movie runtimes in minutes (above), number of movies by year (below) for films of 3 hours or under