12.1 Comparing treatment and placebo groups
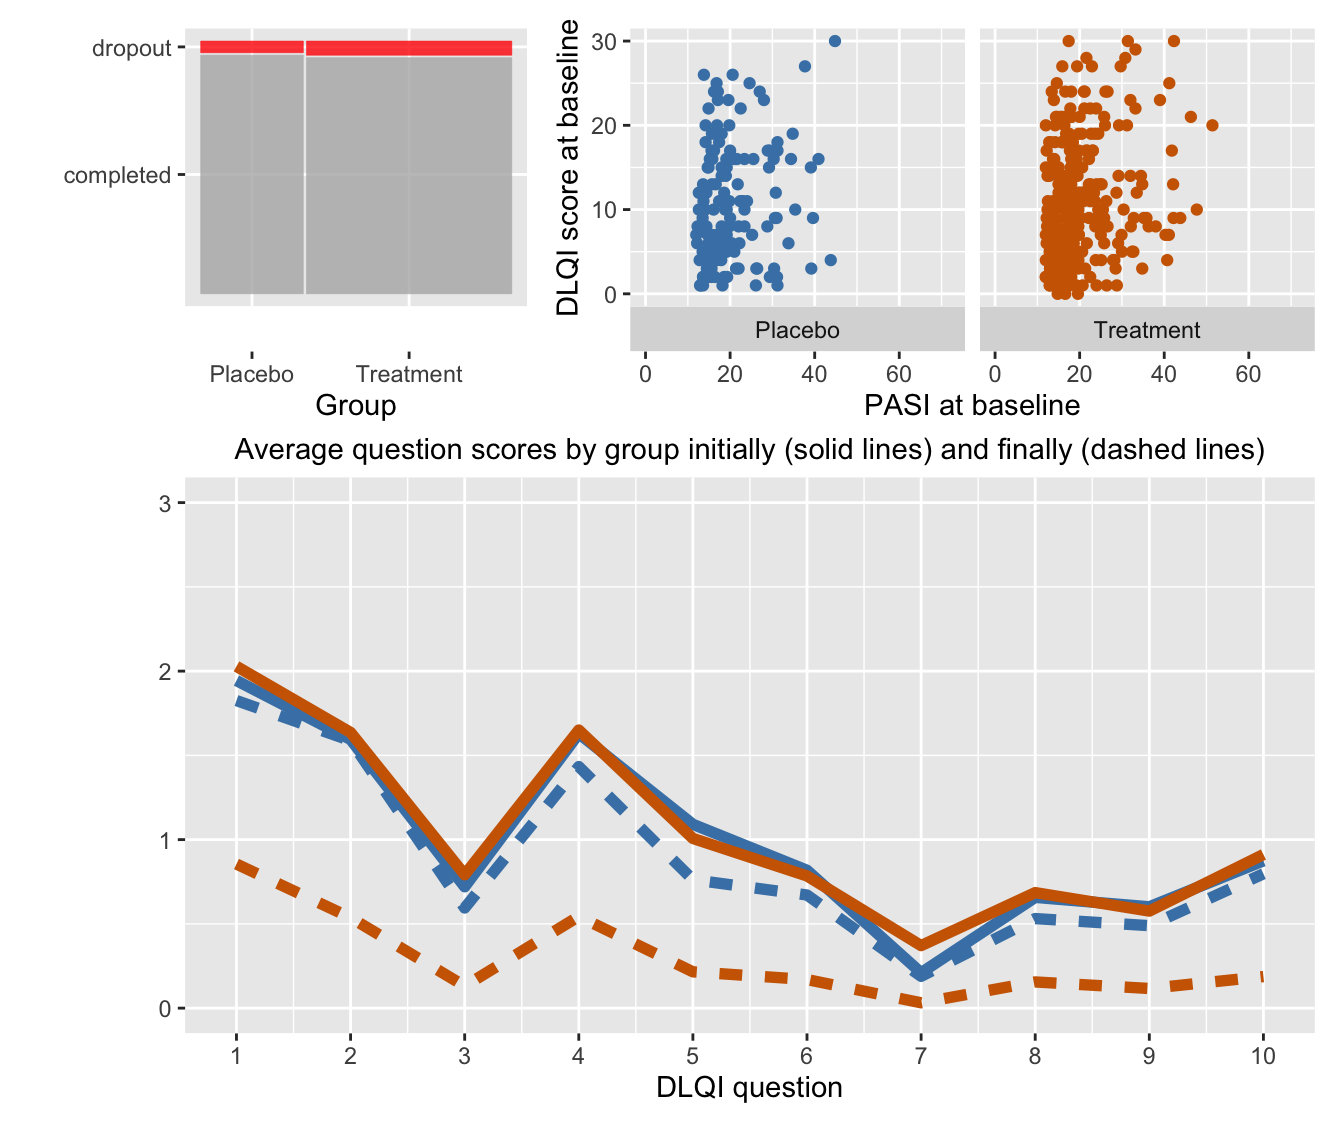
As part of their Wonderful Wednesdays project (PSI (2021a)), the Statisticians in the Pharmaceutical Industry group made available a dataset of a treatment for psoriasis (PSI (2021b)). There was a treatment group of 300 patients and a placebo group of 150. The PASI score (Psoriasis Area and Severity Index) was assessed for each person at the start of the study. The DLQI questionnaire (Dermatology Life Quality Index) was administered to every patient at the start and to almost all patients after 16 weeks—a few must have dropped out. The questionnaire has ten questions, each to be answered on a discrete scale of 0, 1, 2, 3, with 0 meaning no impact on quality of life and 3 meaning maximum impact. Figure 12.1 is a display of three plots summarising the study.

Figure 12.1: The spineplot top left shows the treatment group was much bigger than the placebo group and the dropout rate was small for both groups. The scatterplots of PASI and DLQI scores at the start of the study top right show the two groups had similar initial distributions. The bottom plot shows that average initial scores on the 10 questions were similar for the groups (solid lines) and mostly slightly lower for the placebo group after 16 weeks (blue dashed line). For the treatment group average scores were substantially less on all questions after 16 weeks (dark orange dashed line).
To be included in the study patients had to have a PASI score of at least some level. In the dataset the minimum was 12. Only one participant had a score over 50; the scale goes up to 72. Some of the DLQI questions had higher averages than others, with questions 1 (how itchy, painful), 2 (how embarrassed), and 4 (influenced clothes worn) having initial averages of over 1.5. Other questions had initial averages less than 1 or slightly over (question 5: affected social, leisure activity).