26.1 Who won the 2021 election?
The two big parties in the pre-election coalition, the conservative grouping of CDU/CSU and the social democratic SPD, were being challenged by the FDP (the traditional liberal party), die Linke (a party on the left), the Greens, and the AfD (a right-wing party).
Everyone has two votes in an election for the German parliament, a vote for a candidate (Erststimme or first vote) and a vote for a party (Zweitstimme or second vote). There is one seat for each constituency that goes to the candidate with the most Erststimmen. Additionally, about the same total number of seats are allocated to parties based on each party’s share of the Zweitstimmen in the respective Bundesland. Needless to say, it is more complicated than that. Extra seats (Ueberhangmandate and Ausgleichsmandate) may be needed to satisfy the election rules. In the early years of the Bundesrepublik there were only Überhangmandate, designed to allow parties to win more individual seats than were due them according to their Zweitstimmen share. The system was declared unconstitutional and changed for the 2013 election. Since then Ausgleichsmandate have been included, additional seats to ensure that the Zweitstimmen shares of the parties are respected. There have been further attempts to amend the rules, not particularly successfully. In 2021 there were 138 extra seats, increasing the intended size of the parliament from 598 to 736. In 2017 there had been only 111 and in 2013 only 33. Figure 26.1 shows the numbers since the first postwar election in 1949, when the system was introduced. There is optimism that the government elected in 2021 will introduce a system in accordance with the constitution that will strictly limit the total number of seats in the Bundestag.
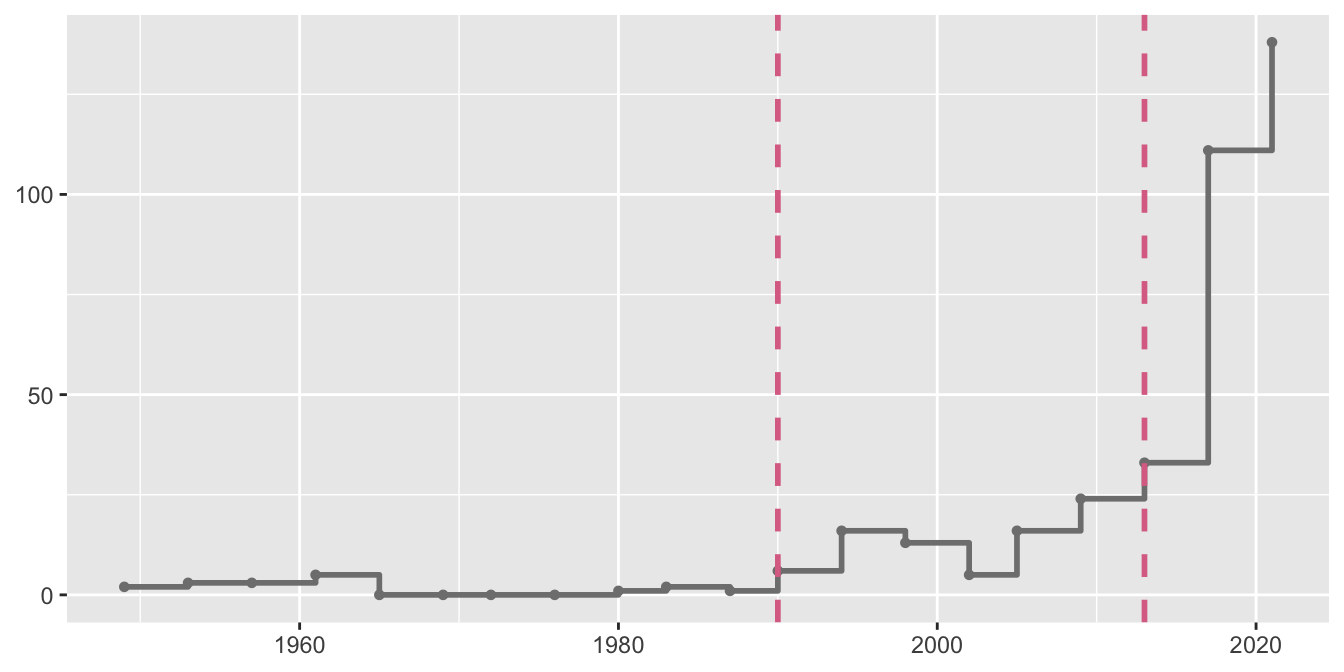
Figure 26.1: Extra seats in German elections since 1949. Each point marks the date of an election. The left dashed line marks the first election after reunification in October 1990. The right dashed line marks the first election with Ausgleichsmandate.
The support for the main parties in the elections of 2021 and 2017 is shown in Figure 26.2. Colours associated with the parties have been used. The CDU/CSU lost heavily, while the SPD and Greens gained. Changes in party performance are easier to see in a plot of the gains and losses in percentage points. It is now apparent that the Greens gained more than the SPD and the Linke lost heavily. The relatively big gain for ‘Other’ parties is also striking.
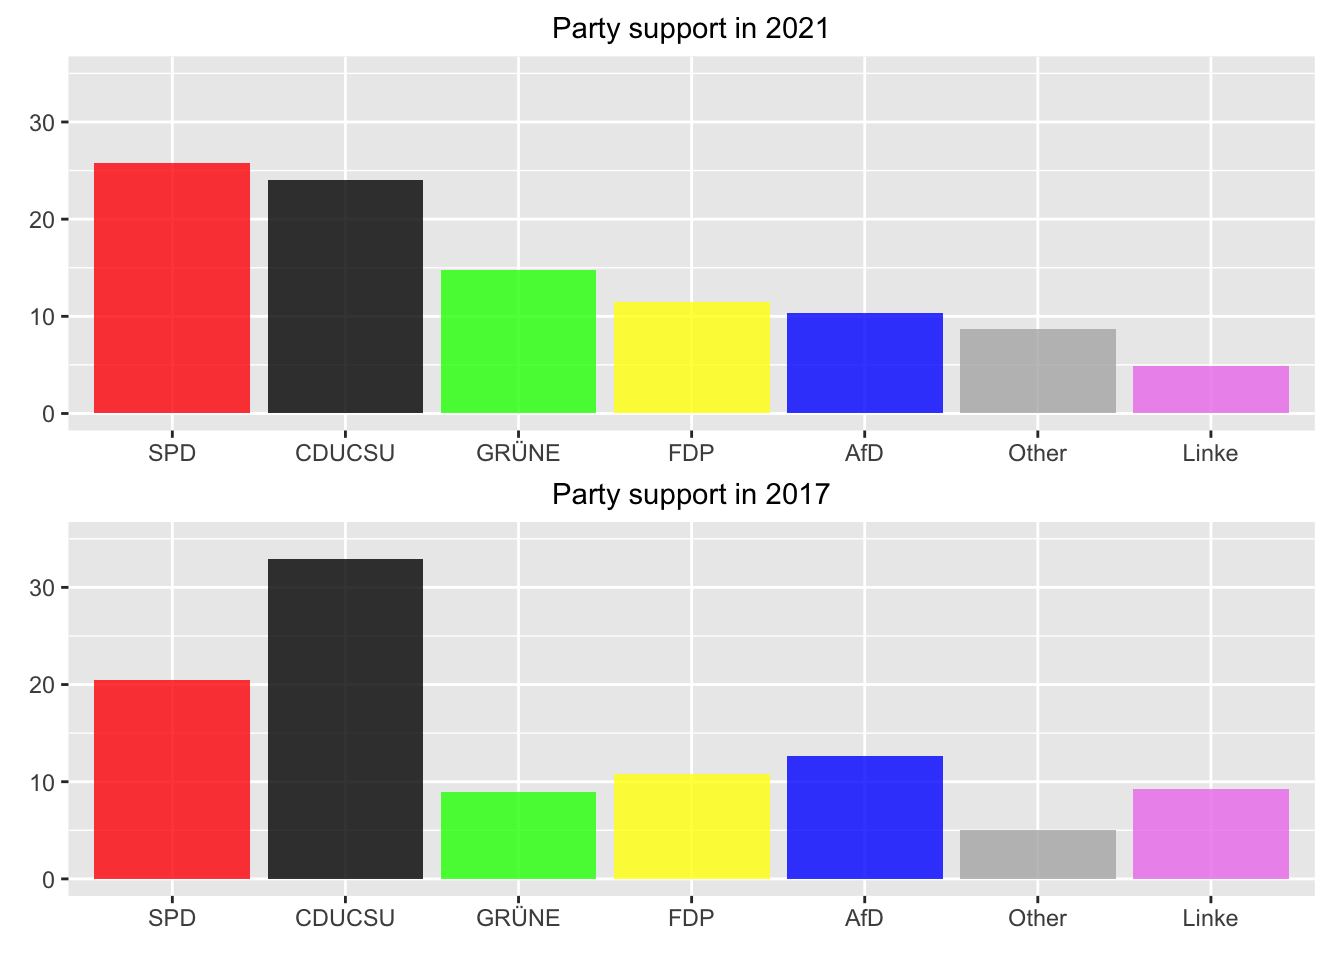
Figure 26.2: Party percentage support (in Zweitstimmen) for the last two elections
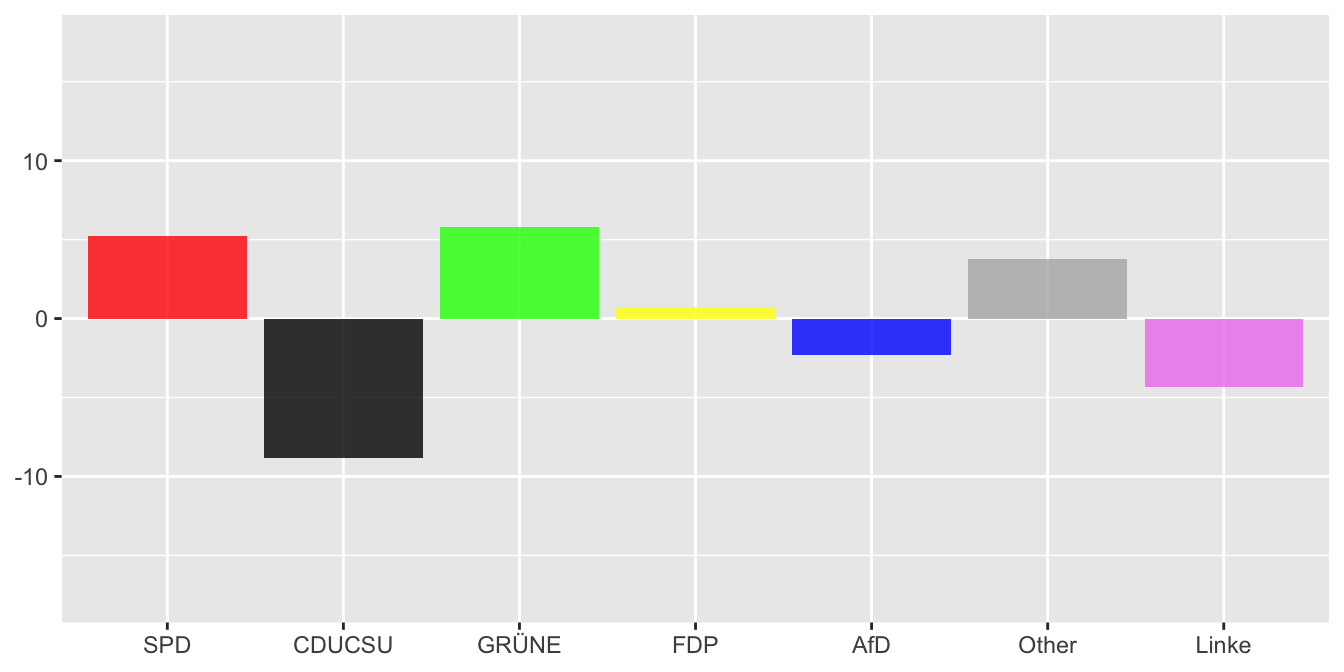
Figure 26.3: Changes in party percentage support between the last two elections
Absolute changes can be deceptive. The Greens gained more than the SPD, but from a much lower base. An UpAndDown plot shows the relative changes. The base of each bar is the party support in votes in 2017. The height of each bar is the change in party support as a percentage of their votes in 2017, so the bar areas equal the absolute changes. The strong performance of the Greens (and the even stronger performance of ‘Other’ parties in percentage terms) is more apparent, along with the poor performance of the Linke.
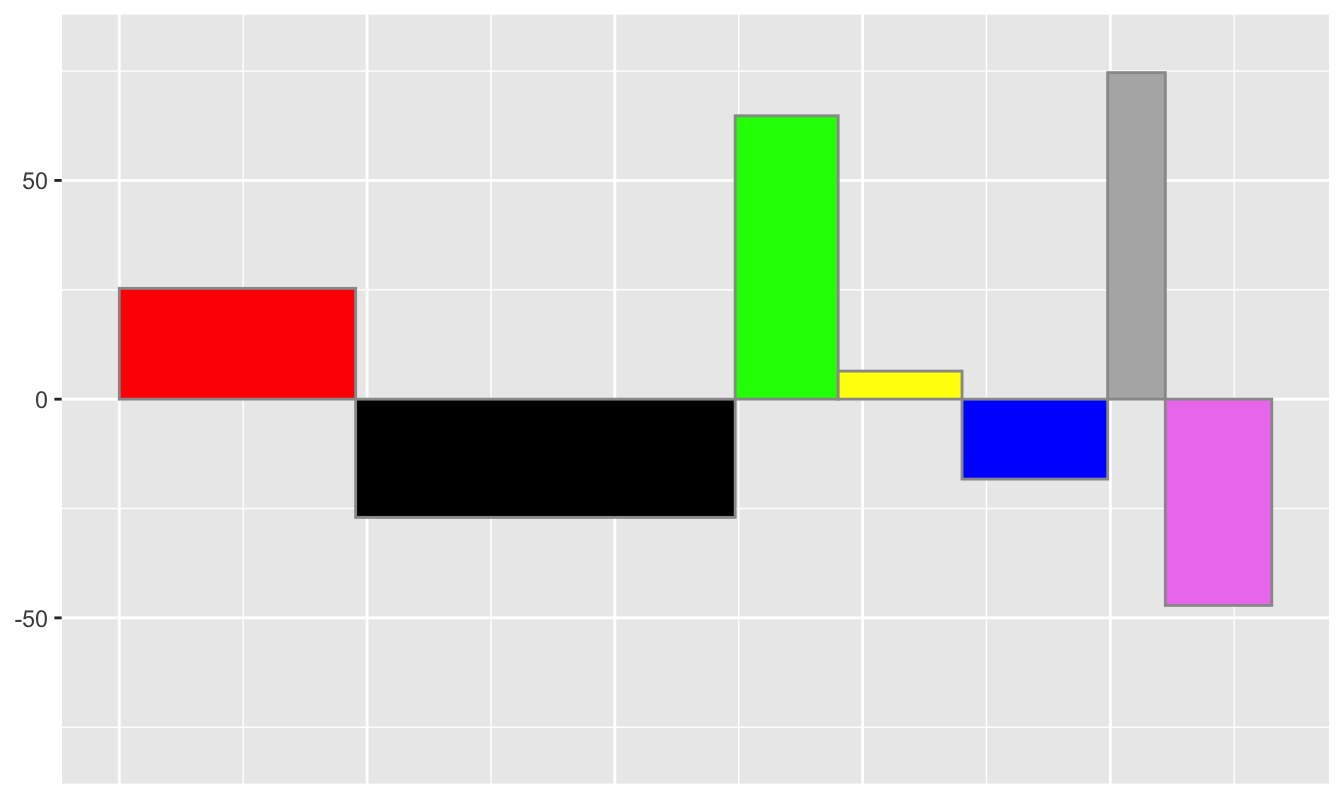
Figure 26.4: Relative changes in support between the last two elections
A key advantage of UpAndDown plots is that area is conserved when drilling down. Figure 26.5 shows the changes by region (West, East, Berlin) for each party. The SPD and FDP improved most in the East, albeit from low levels at the last election in 2017. ‘Other’ parties did better in the West than the East.
More detail can be seen in Figure 26.6 where the changes are shown for each party by Bundesland with the Bundesländer ordered by size. The SPD gained everywhere, but especially in the smaller Bundesländer. The CDU/CSU lost everywhere, but more in the smaller Bundesländer. The Greens did very well in Nordrhein-Westfalen and well everywhere else, with one exception. In Saarland, thanks to internal party disagreements, they did not fulfill the requirements for receiving Zweitstimmen and got none. The FDP mostly gained, but did badly where the Greens did best in Nordrhein-Westfalen. The AfD lost to different degrees everywhere except in Thüringen. ‘Other’ parties as a group had some big percentage gains (which is why the scale is different to that in Figure 26.4 and still does not include all values). The Linke lost roughly equally in all Bundesländer.
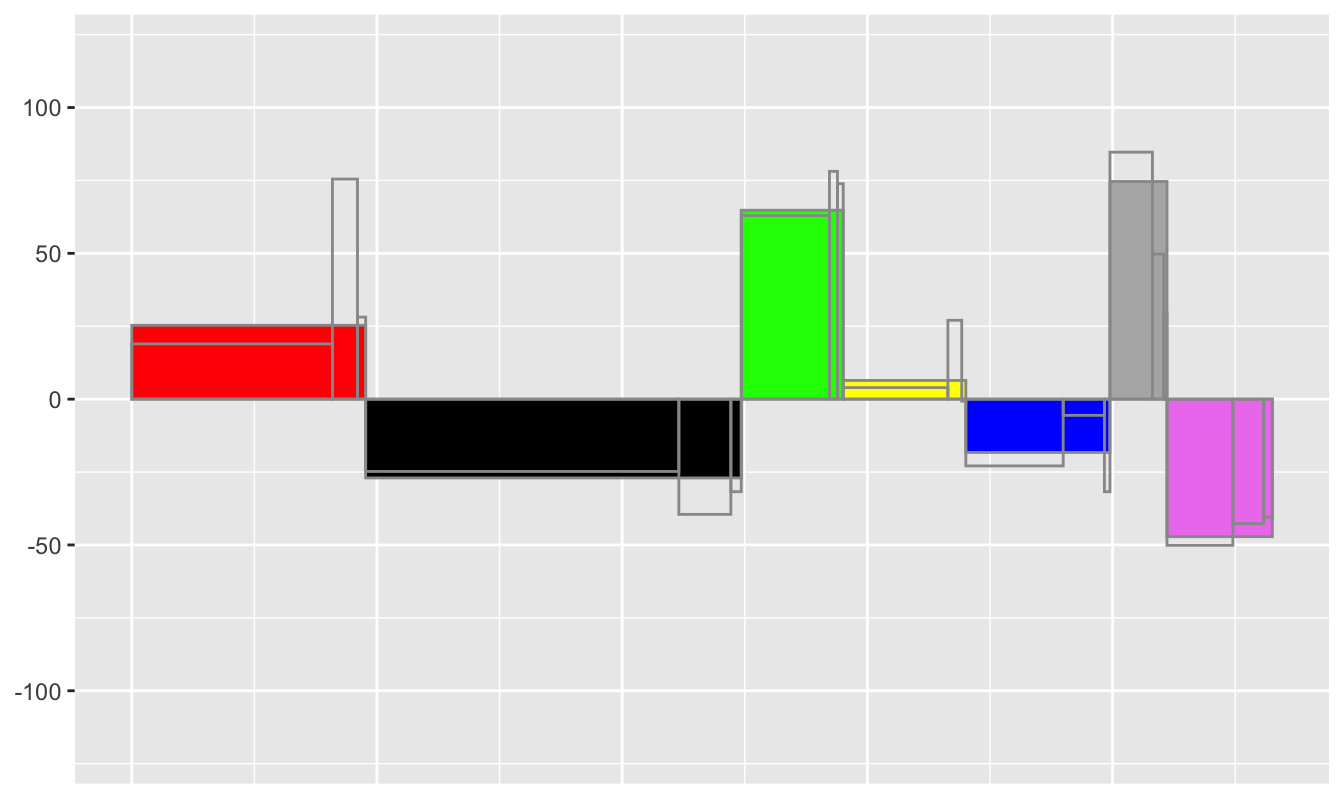
Figure 26.5: Relative changes in support by party and region.
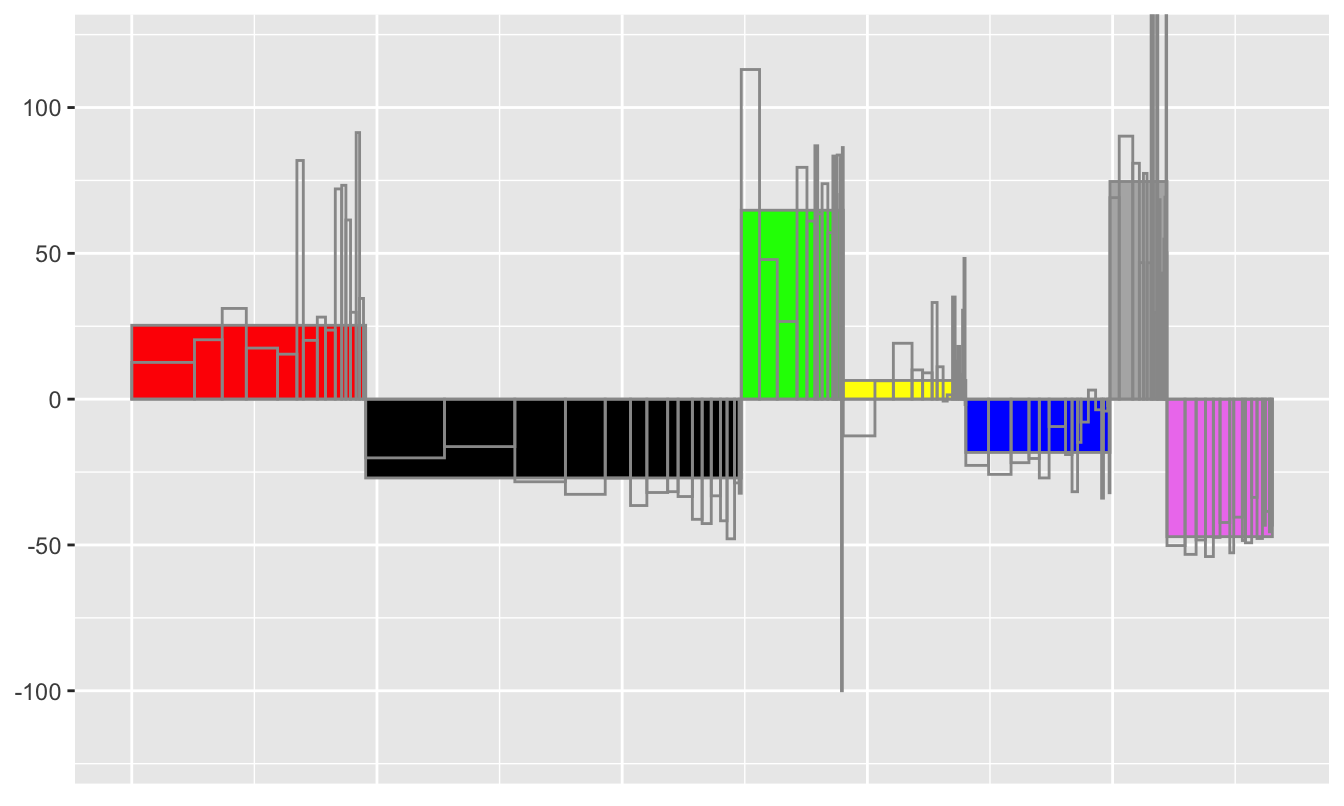
Figure 26.6: Relative changes in support by party and Bundesland.