30.5 Comparisons and graphics
“Painting is easy when you don’t know how, but very difficult when you do.”
Looking at graphics involves making comparisons—comparisons with expectations, comparisons within graphics, comparisons between graphics. A well-structured layout helps.
30.5.1 Types of comparison
Comparisons may be made between different variables for the same individual cases. They could be different measures (e.g., Figure 14.4 and the top plot of Figure 33.2) or the same measure taken at different times (e.g., top right of Figure 12.1). The comparisons may be improved by looking at differences or ratios as well as the measures themselves.
Comparisons can be made between different subsets or groups, between one selection and the rest of the dataset, between a selection and the whole dataset. These comparisons may be made by distributional forms (Figures 8.9 and 8.14), by features (Figure 10.7) or by statistics (e.g., Figures 11.11, and 25.8, shown again in Figure 30.13).
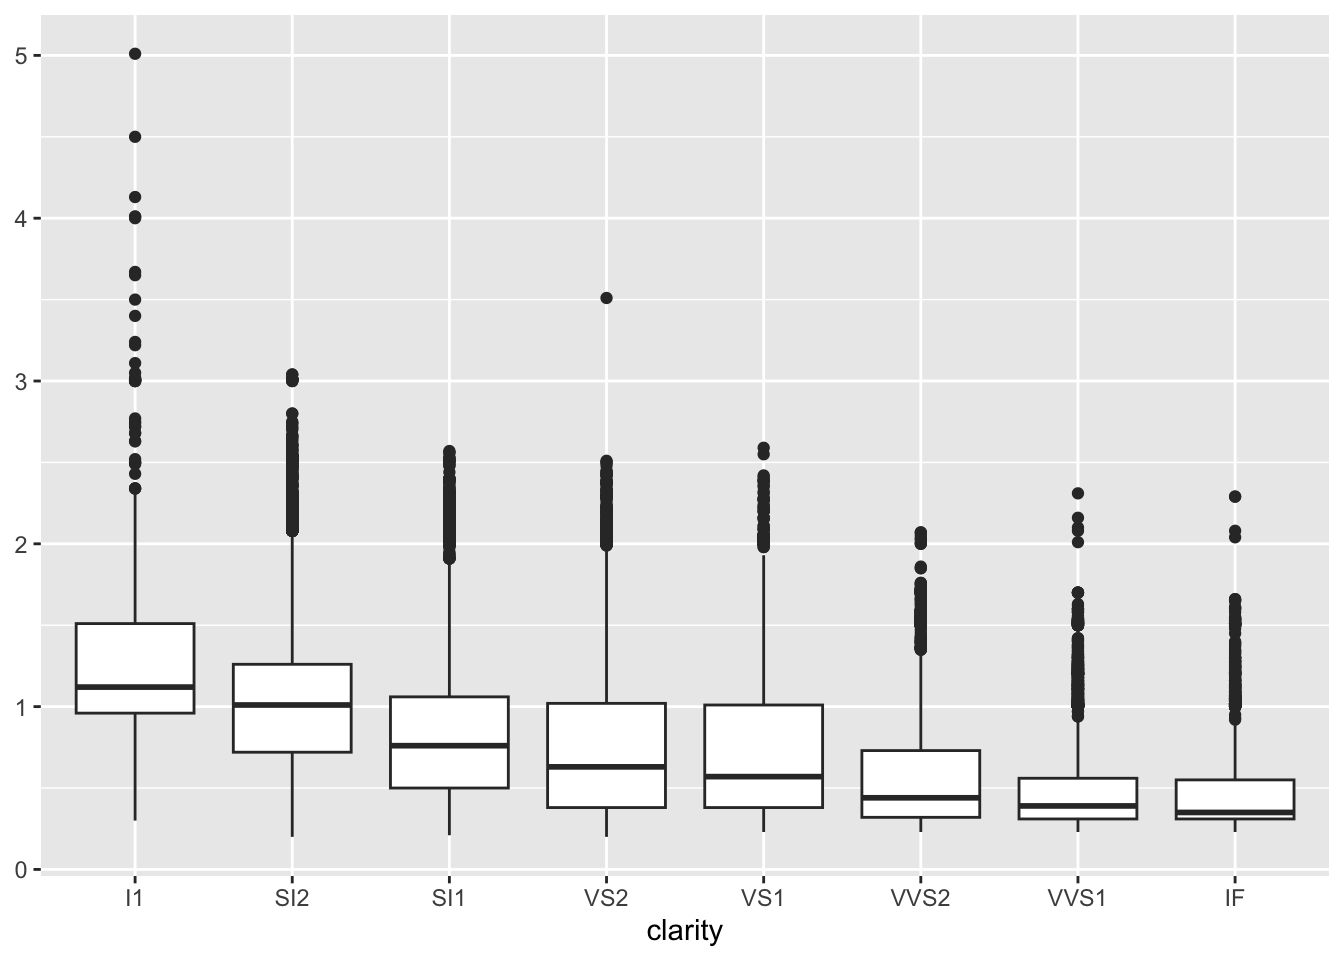
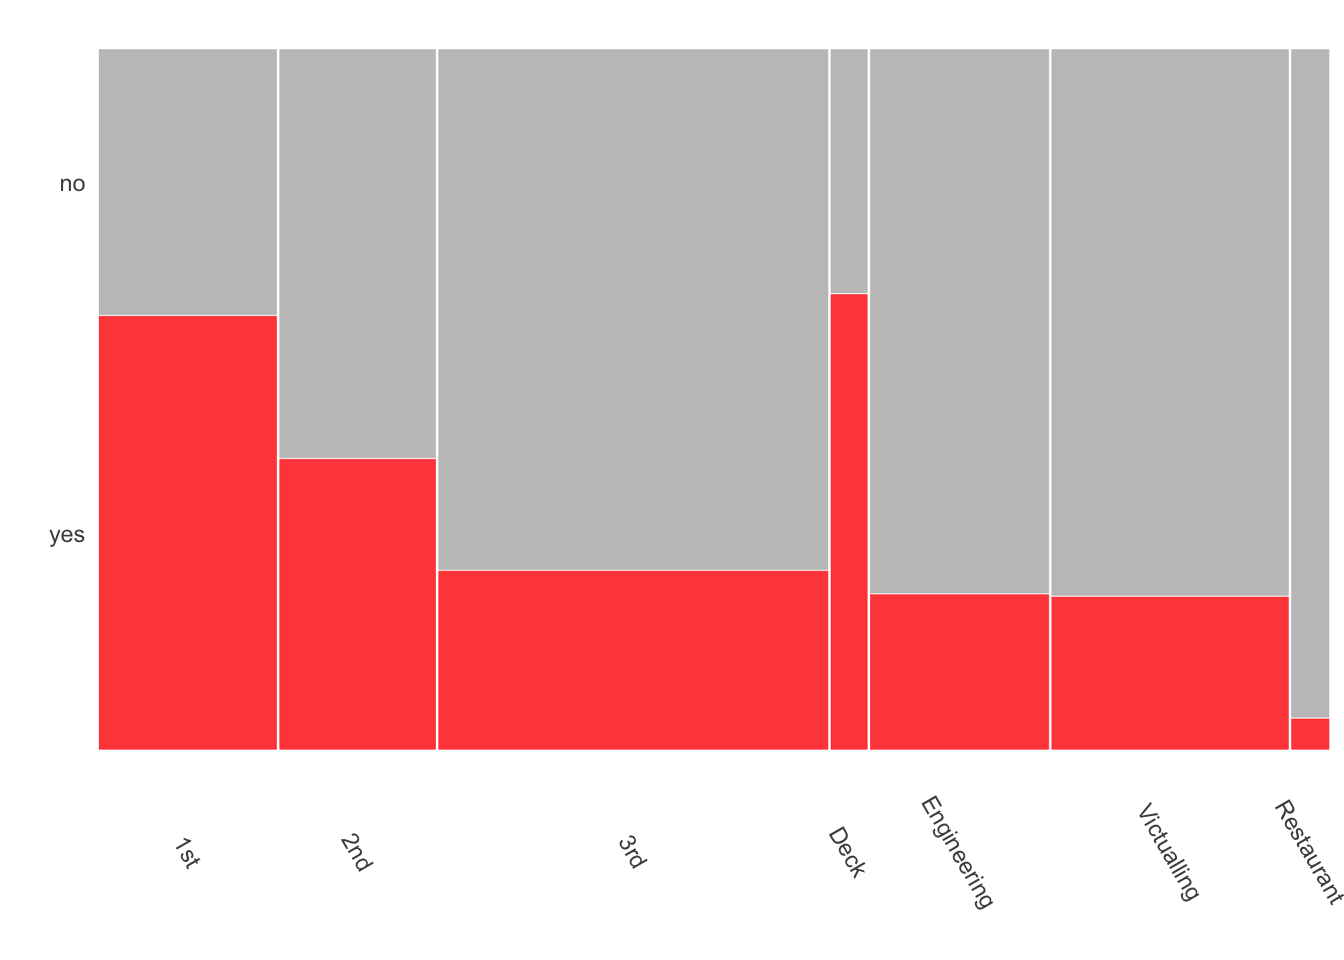
Figure 30.13: Diamond carats by clarity (left) and Titanic survival rates for passengers and crew (right)
In statistical analysis it is common to specify a particular comparison, for example whether two means can be taken to be equal or not. In exploratory analysis many comparisons are made, some explicit that are of interest in advance and some that arise because they stand out. There may be a large number of groups that could be compared in a large number of ways, as with the fuel efficiency data in Chapter 17.
Comparisons may be made with a variety of graphics, some perhaps more informative than others, but all contributing. In Chapter 26 the votes for parties in two German elections were initially compared by barcharts, then by a barchart of percentage changes between the elections, then by an UpAndDown plot of relative and absolute changes.
Comparisons must be made precise, both in the definitions of the groups being compared and in the features or statistics used to compare them, and they must be checked thoroughly (cf. §32.3).
30.5.2 Superposition, juxtaposition, and faceting
Graphics can be compared by putting them on top of one another (superposition) or by putting them beside or above one another (juxtaposition). Figure 8.3 juxtaposes histograms of chess ratings for active and inactive players picking out the peak at 2000 well. Figure 8.4 superposes density estimates of the same data showing the overall difference in distributions better, but the peak is harder to see. The plots are redrawn in Figure 30.14.
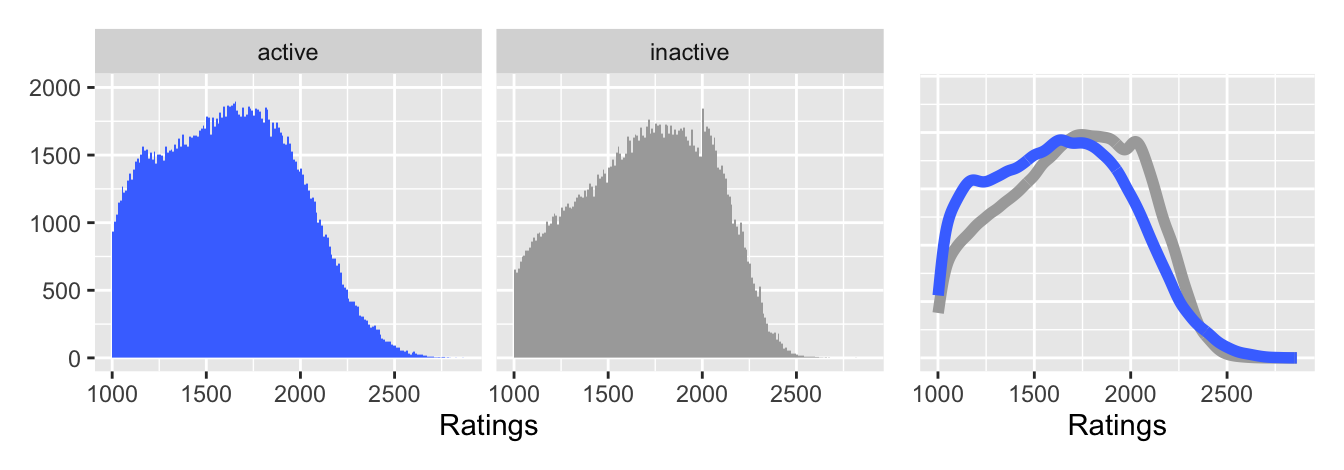
Figure 30.14: Juxtaposed histograms (left) and superposed density estimates (right) of ratings for active and inactive chess players
Colour (occasionally shape or form) can be used to distinguish the parts of superposed graphics. The order of drawing is crucial as the last group drawn will be on top (e.g., Figures 10.2 and 21.13). For comparisons of many groups, faceting by placing them on a grid is a practical alternative. Much depends on how separated the groups are.
Superposition is good for comparing time series that look similar (e.g., Figures 2.4 and 24.10), for comparing density estimates of different groups (e.g., Figure 8.15), and for scatterplots in which groups are separated (e.g., Figure 18.9). It is not effective when overlapping occurs, as with histograms or barcharts where juxtaposition is better (e.g., Figures 7.2 and 3.14).
Juxtaposition can be better for crowded scatterplots (e.g., Figure 4.4 rather than Figure 4.3, both shown again in Figure 30.15 with the slight change that the plot on the right now includes ghostplotting to provide context for the individual regions). The disadvantage of juxtaposition is the extra amount of space needed if all plots are full size.
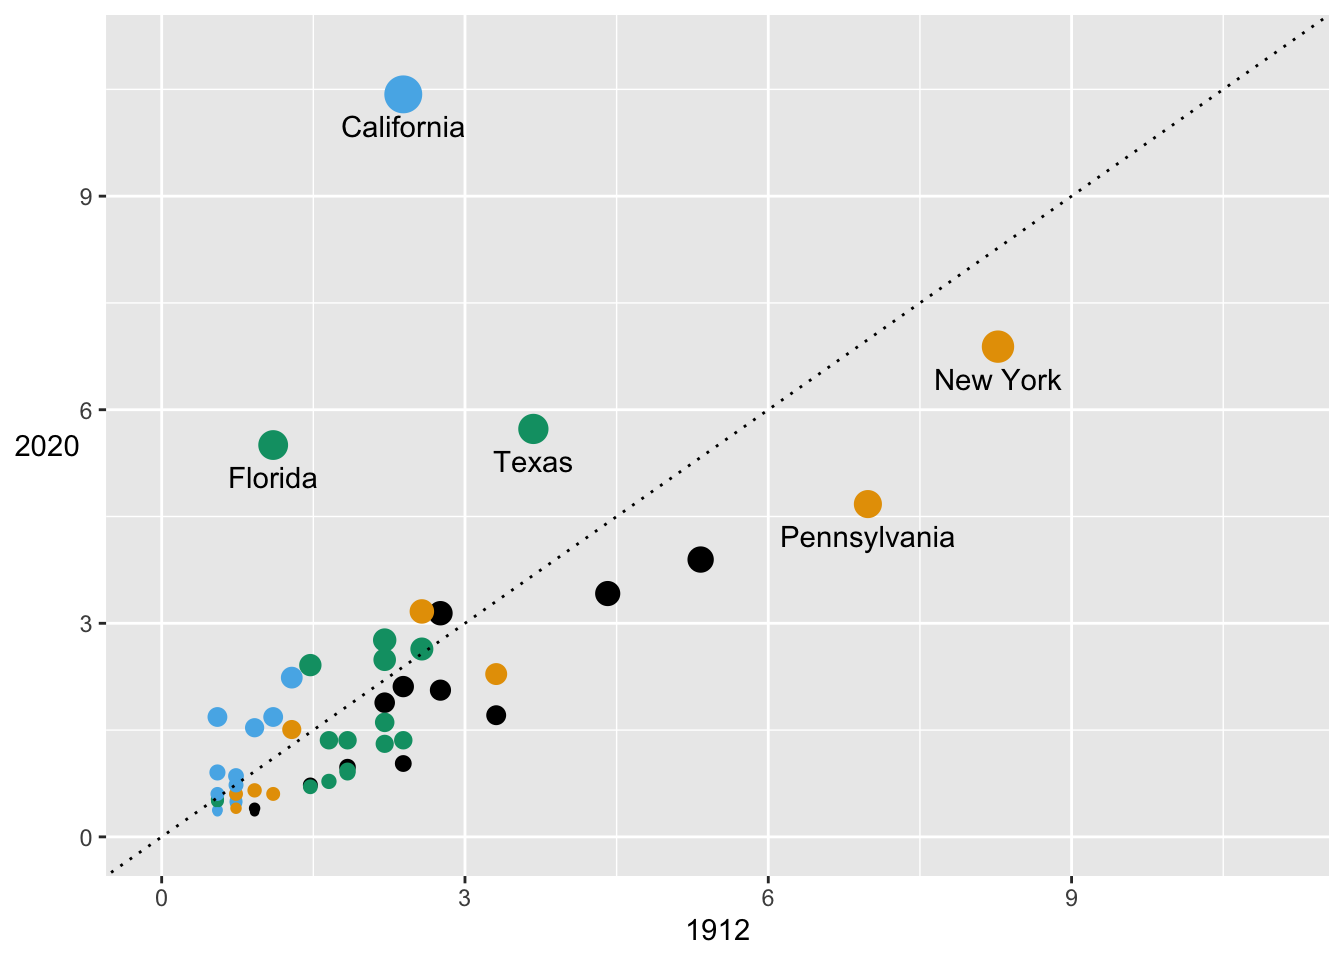
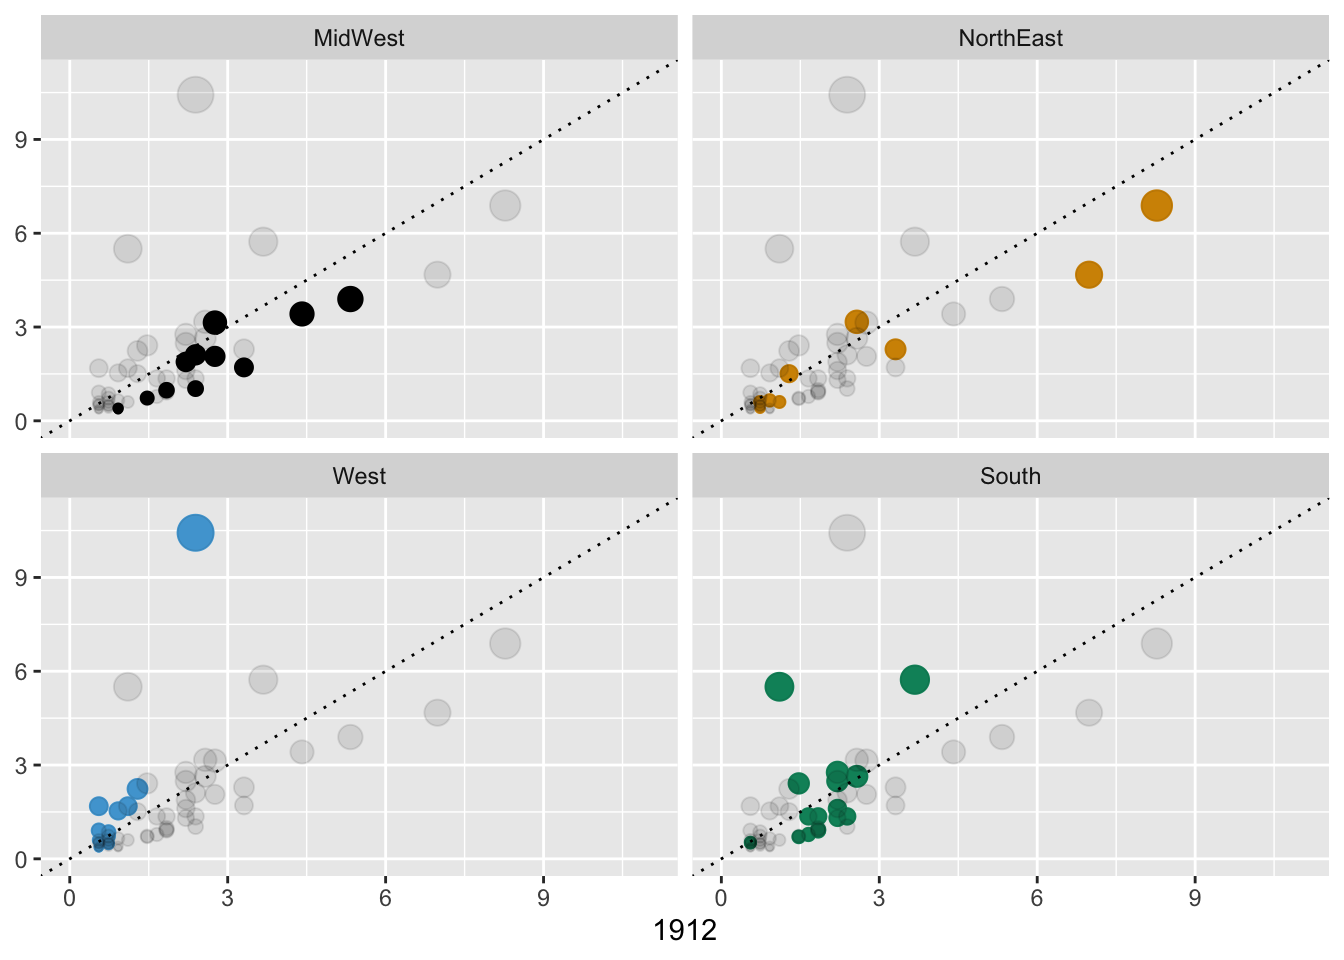
Figure 30.15: Percentage state shares of delegates at the 1912 and 2020 Democratic conventions (left) and by region (right)
Grids in faceting are constructed using conditioning. Order the conditioning variables and categories to place groups of interest together (Figure 23.4). Ghostplotting works well for faceted scatterplots by including comparisons of each individual group with the rest of the data.
These approaches are not mutually exclusive. Ghostplotting is often useful with faceting (e.g., Figure 18.10). Superposition and juxtaposition were used together in Figure 9.9. Figures 6.10 and 16.10 use superposition, ghostplotting, and juxtaposition.
30.5.3 Advice
Whichever objects are to be compared should generally be on the same scales, carefully aligned, and close together. Scales can be the same because they are measured in the same units, when differences in levels are emphasised (e.g., Figures 8.10 and 10.3, drawn again in Figure 30.16), or because they have been standardised to a common scale, when distributional shapes are compared (e.g., Figures 3.13 and 21.9). There are many possible standardisations (cf. §28.2.2).
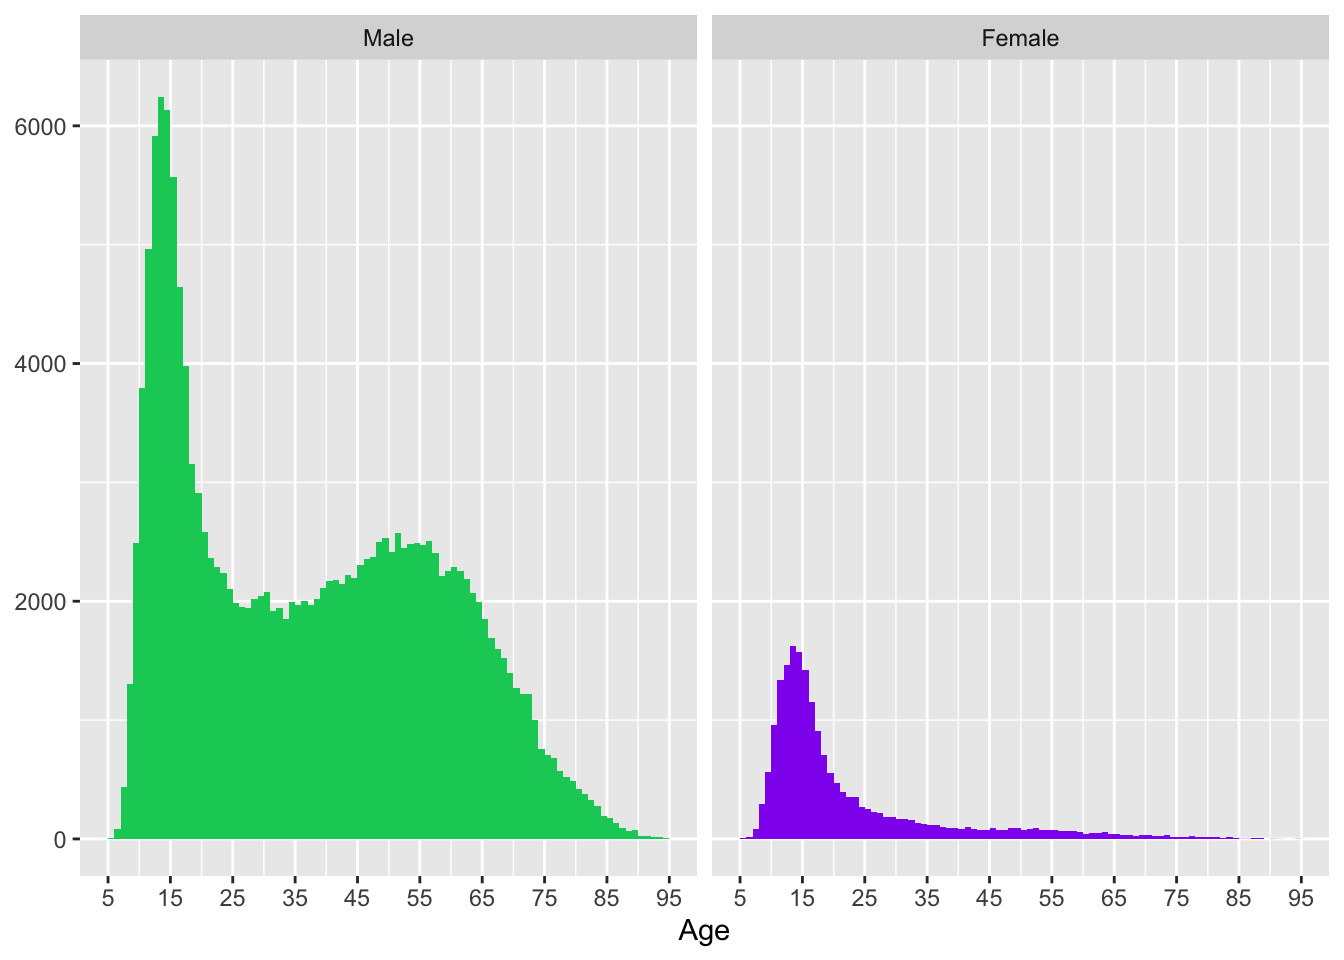
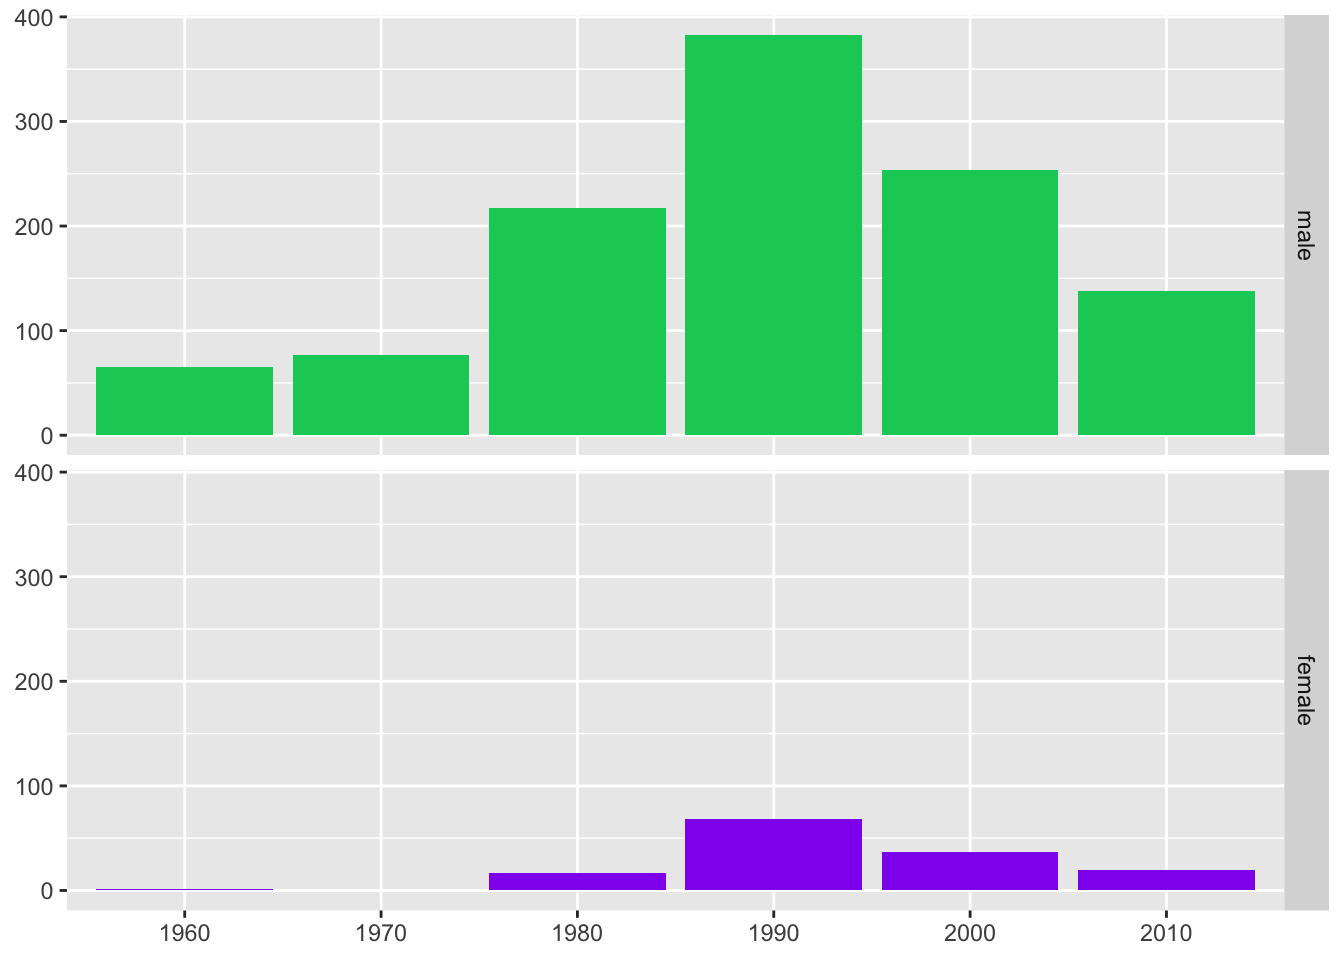
Figure 30.16: Age distribution of active players by sex (left) and numbers of spaceflight participants by decade and by sex (right)
Alignment of axes and placing objects together makes comparisons easier. The doubledecker plot of Titanic survival rates by passenger class and crew department in Figure 25.8 shows the higher survival rate of passengers over crew, the decline in survival rate by passenger class, and the relatively high rate of survival of the deck crew (because they manned the lifeboats).