18.3 Using raw data to get more information
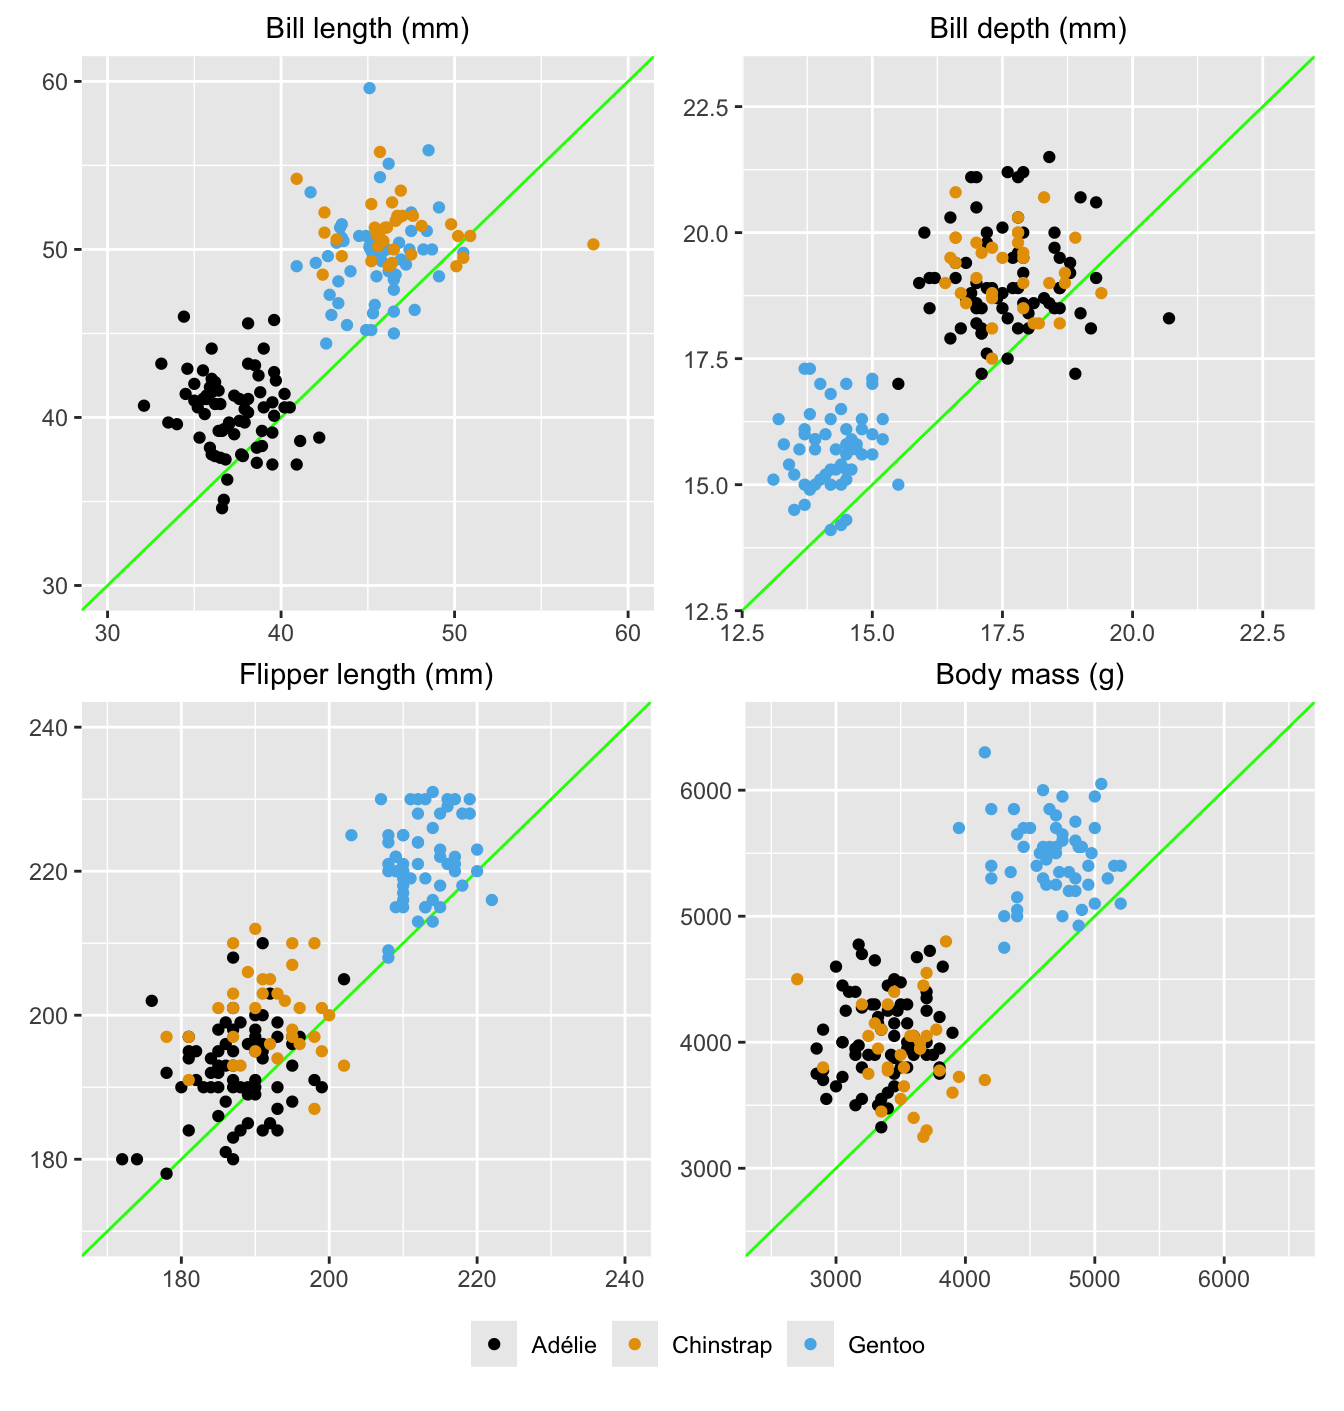
There is a second dataset with more variables in the palmerpenguins package called penguins_raw. This includes nesting observations and two isotope measurements. It provides enough information to compare the male and female in each nesting pair. The following set of scatterplots plots the four main measurements for the males against those of their female partners. In each plot the horizontal and vertical axes have identical scales.

Figure 18.11: Measurements of four variables for the male (vertical axes) and female (horizontal axes) in each pair (green lines mark where values would be equal)
As expected, the male in each pair is generally bigger than the female. One of the female Chinstrap penguins has a surprisingly long bill, possibly an error. Looking at the points as pairs combining the measurements of the male and the female from one nest, it can be seen that bill-depths, flipper lengths and body masses separate Gentoo pairs from the rest, while bill-lengths separate Adélie pairs from those of the other two species.
Answers Gentoo penguins are heavier with longer flippers and less deep bills and, of the islands studied, are only found on Biscoe Island. Adélie penguins have shorter bills. Chinstrap penguins are only found on Dream Island. Male penguins are usually bigger than their female partners.
Further questions Do the isotope measurements in the raw dataset differ for the species? The study was carried out over three years: Do results differ in any way across the years?
Graphical takeaways
- Selection and highlighting are instructive for studying groups of cases across ensembles of graphics. (Figures 18.2 to 18.4)
- Orderings of many kinds are crucial for getting the most out of parallel coordinate plots. (Figure 18.8)
- If data are paired, plotting the pairs in scatterplots provides more information. (Figure 18.11)