22.1 How well do the softwares do?
The authors introduced a new facial analysis dataset, balanced by sex and skin type, that they used to test three commercial facial recognition software packages. The study task was to determine the sex of a person from a photograph. Results were that there was a high predictive error rate for dark-skinned females (> 34%) and an almost negligible error rate for light-skinned males (< 1%). The authors concluded that this unsatisfactory and uneven performance was due to the training databases the software systems used.
The summary data were reconstructed from the published paper by assuming that each percentage reported had to produce an integer number when combined with the relevant total.
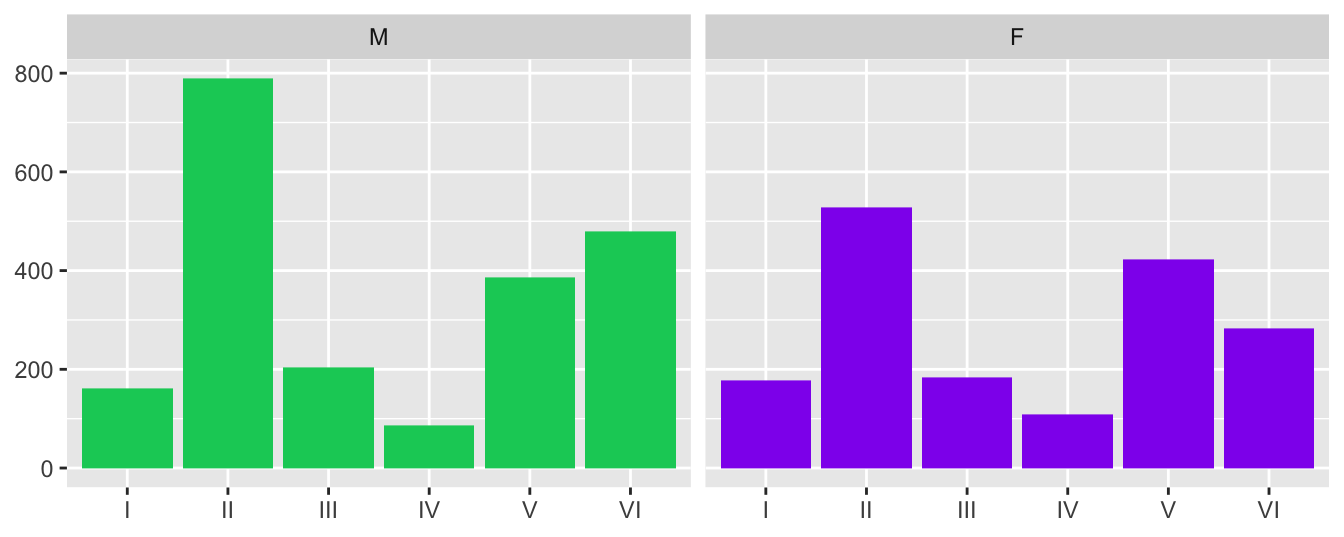
Figure 22.1 is a barchart of the numbers in each of the 12 groups (6 skin tones for each sex). The patterns are similar, but there are more males overall, mainly in the second and sixth skin tone groups.

Figure 22.1: Numbers of different skin tones in the dataset for both sexes
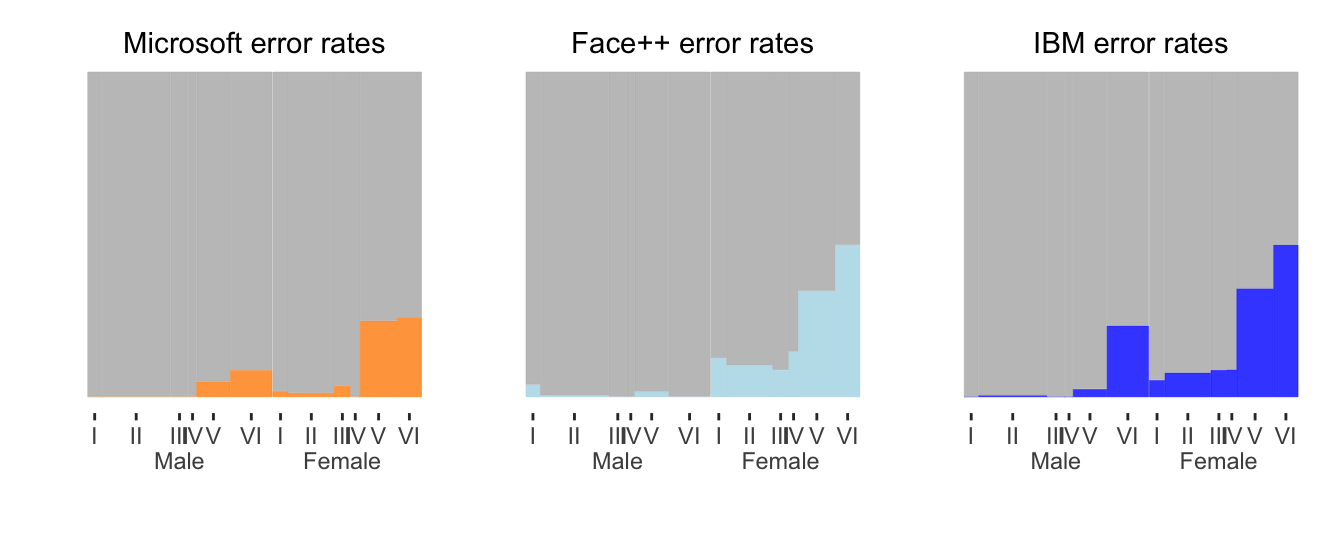
Figure 22.2 shows the error rates by sex and skin shade (see article for details) for each of the three software systems tested using doubledecker plots of error rates side by side. Microsoft had mostly the lowest error rates—by quite a lot for the group where all software packages performed worst, the darker females.

Figure 22.2: Error rates by sex and skin colour for three software systems drawn side by side. In each plot males are to the left, females to the right, and skin colour gets darker from left to right within sex. The width of each bar is proportional to the size of the group it represents.
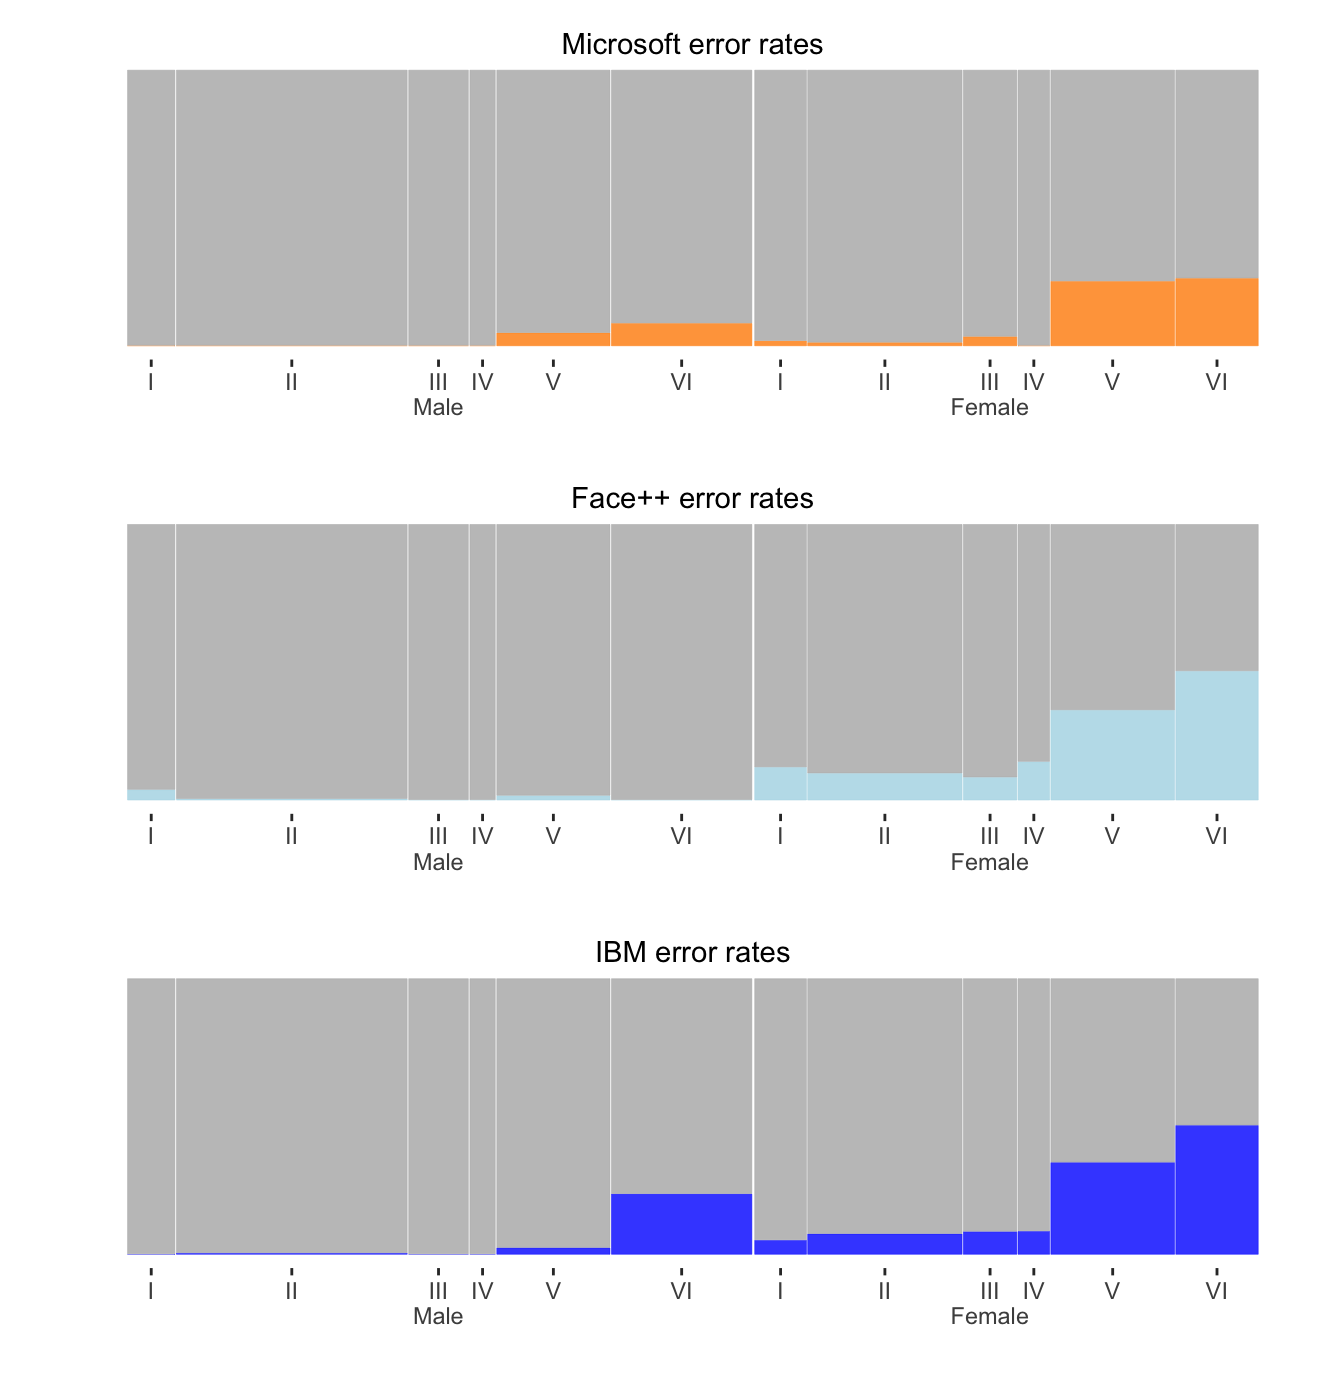
Figure 22.3 draws the doubledecker plots above one another to show more detail and provide a better comparison of the distributions of error rates across sex and skin tones. The error rates were low for males and high for females, and they also increased as skin tone got darker. Microsoft mostly did better than Face++ and did better than IBM across the board. Males were put on the left, so that the error rates generally rose from left to right. The softwares were ordered from overall best to worst performing from top to bottom—although none did particularly well. The group widths are the same for each software as they are proportional to the group sizes for this criterion.

Figure 22.3: Error rates by sex and skin colour for three separate software systems. Males are on the left, females on the right, and skin colour gets darker from left to right within sex. The width of each bar is proportional to the size of the group it represents.