23.3 Can the species be clustered?
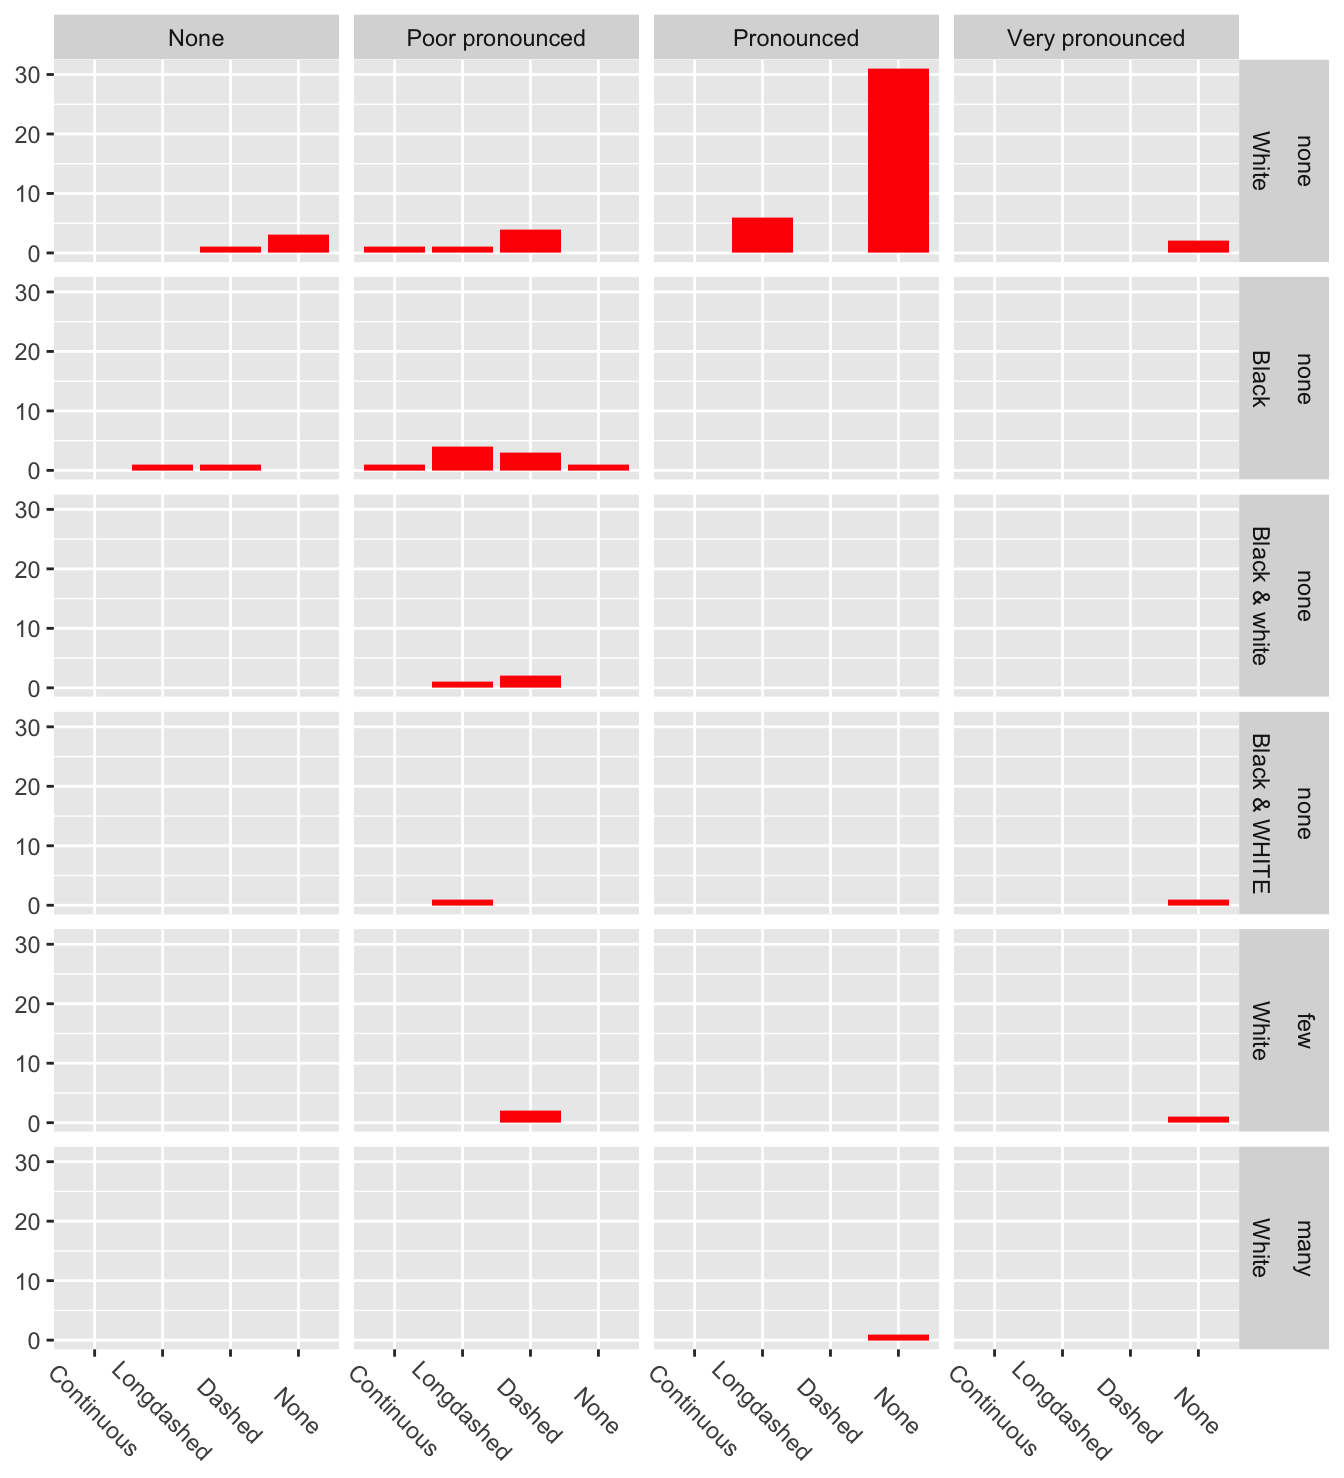
If a clustering analysis of the data for the two species were carried out, the species information would not be used. Figure 23.4 displays all combinations of the four descriptive variables (i.e., excluding sex) by the numbers of birds for each combination. There are barcharts of collar faceted by eyebrows in the columns and by border and undertail in the rows. Six of the twelve combinations of the latter two variables do not occur for the two species, so there are only six rows.

Figure 23.4: Barcharts of collar faceted by eyebrows, border, and undertail for the Audubon and Galápagos shearwaters
Any clustering of these four variables would have to assign all 31 cases in the largest bar to the same cluster. These cases have pronounced eyebrows, no collar, white undertail, and no border. The case with pronounced eyebrows and a border value of many and the four cases with very pronounced eyebrows should probably be in that cluster too. Putting the remaining cases all in a second cluster gives the following comparison table for the two species.
| species | clus1 | clus2 |
|---|---|---|
| Audubon | 1 | 33 |
| Galápagos | 35 | 0 |
The single misclassified bird is then an Audubon’s shearwater with pronounced eyebrows, no collar, white undertail, and no border, also remarked on in Figure 23.3. Most clustering methods should be able to separate the two species almost completely.
A parallel coordinate plot of the four variables without species information is not as effective for identifying possible clusters and is not shown here.
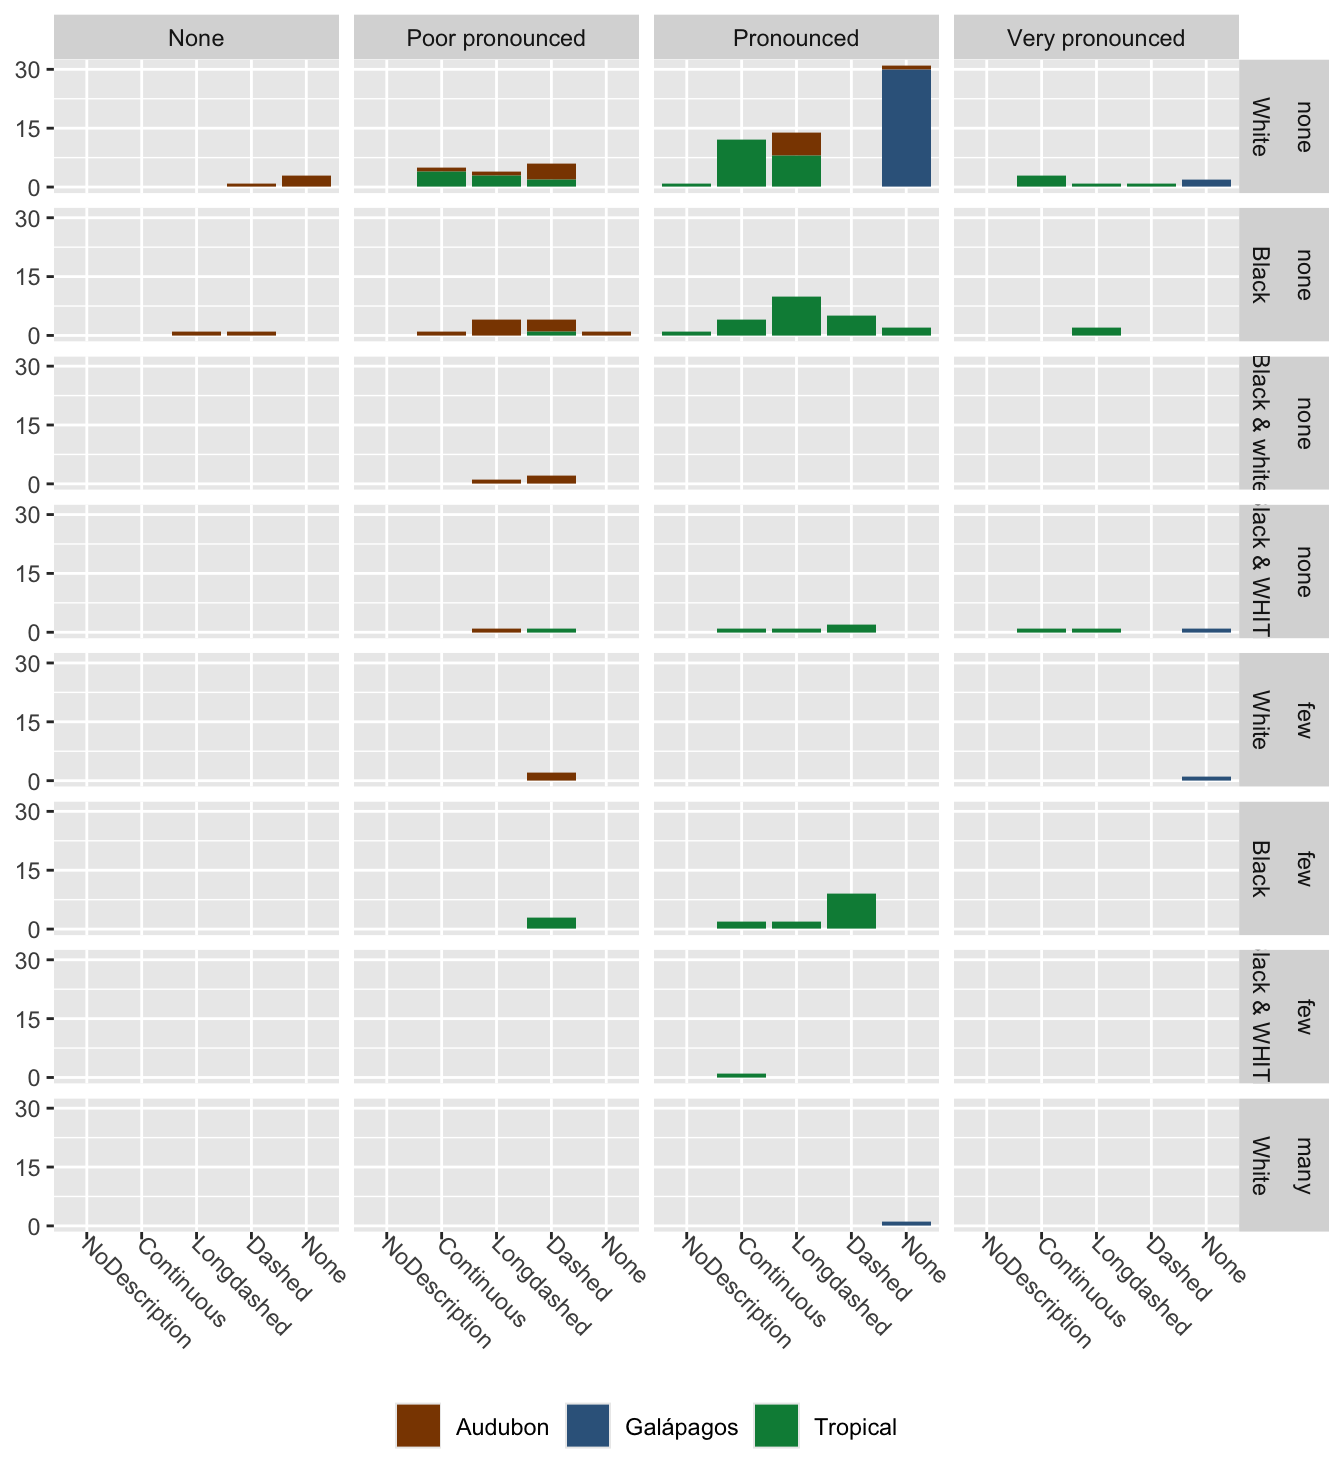
The full version of the dataset includes an additional species, 84 Tropical shearwaters. There is an extra collar category for two of the Tropical shearwaters, but with no description given. Figure 23.5 shows the data in the style of Figure 23.4, but with the bars coloured by species.

Figure 23.5: Barcharts of collar faceted by eyebrows, border, and undertail, coloured by species for the full dataset of three species
The Galápagos species is still partially separated from the others, but the Audubon and Tropical species overlap. A cluster analysis is unlikely to be able to group the three species.
Answers It is possible to almost completely distinguish Audubon and Galápagos shearwaters using two morphological variables. A faceted graphic of barcharts suggests that it should be possible to use clustering to produce groups closely matching the species. A corresponding graphic for the three species, including Tropical shearwaters, suggests distinguishing or clustering them would be more difficult.
Further questions How well can Galápagos shearwaters be distinguished from Tropical shearwaters?
Graphical takeaways
- Barcharts for the same dataset should have the same frequency scale for ease of comparison. (Figure 23.1)
- Ordering of categories in categorical variables and arrangement of faceting variables strongly influence how easy it is to read a plot. (Figures 23.3 and 23.4)
- Faceted barcharts show where cases are in multivariate categorical data. (Figures 23.4 and 23.5)