16.2 How have numbers of draws changed?

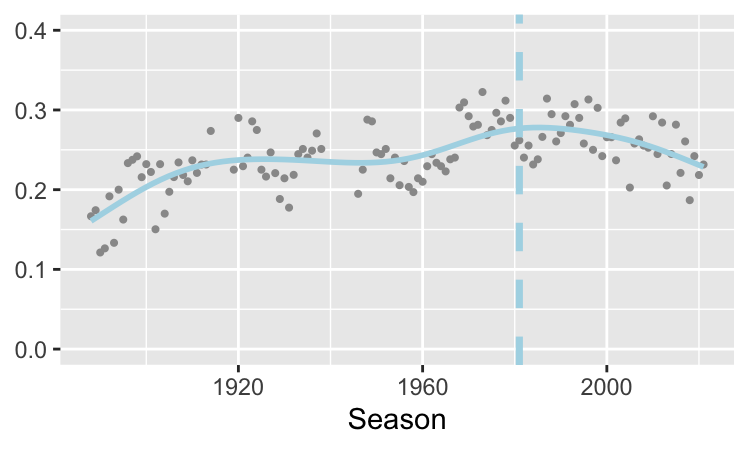
Figure 16.1: Rate of draws over the years in the English league’s top tier with a gam (general additive model) smooth
The proportion of drawn games in the top tier climbed until the First World War. Afterwards it remained relatively constant until the 1960s, when it rose again. After the introduction of three points for a win in 1981 (the vertical dashed line) it dropped slightly again. There was a lot of variability by season.

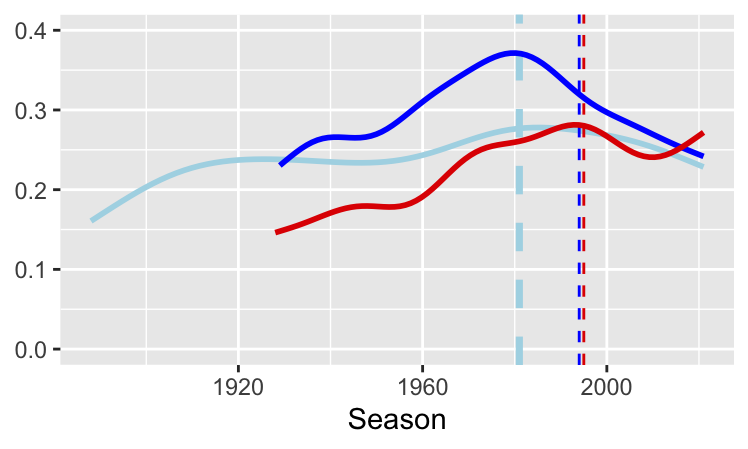
Figure 16.2: Smooths of the rates of draws for the top tiers in Italy (dark blue), England (light blue), and Spain (red)
The rates of draws in other countries were sometimes quite different as Figure 16.2 shows. The corresponding dotted lines show when the 3 points for a win rules were introduced. Italy had a higher rate of draws, particularly in the 1970s and 1980s, but this was declining before the new rule came in. The rate in Spain was lower, rose briefly above the English rate, then fell again. For the most recent data considered here, the rates of draws for Italy and England are about equal and Spain’s rate is the highest of the three leagues for the first time.