16.3 How big is home advantage?
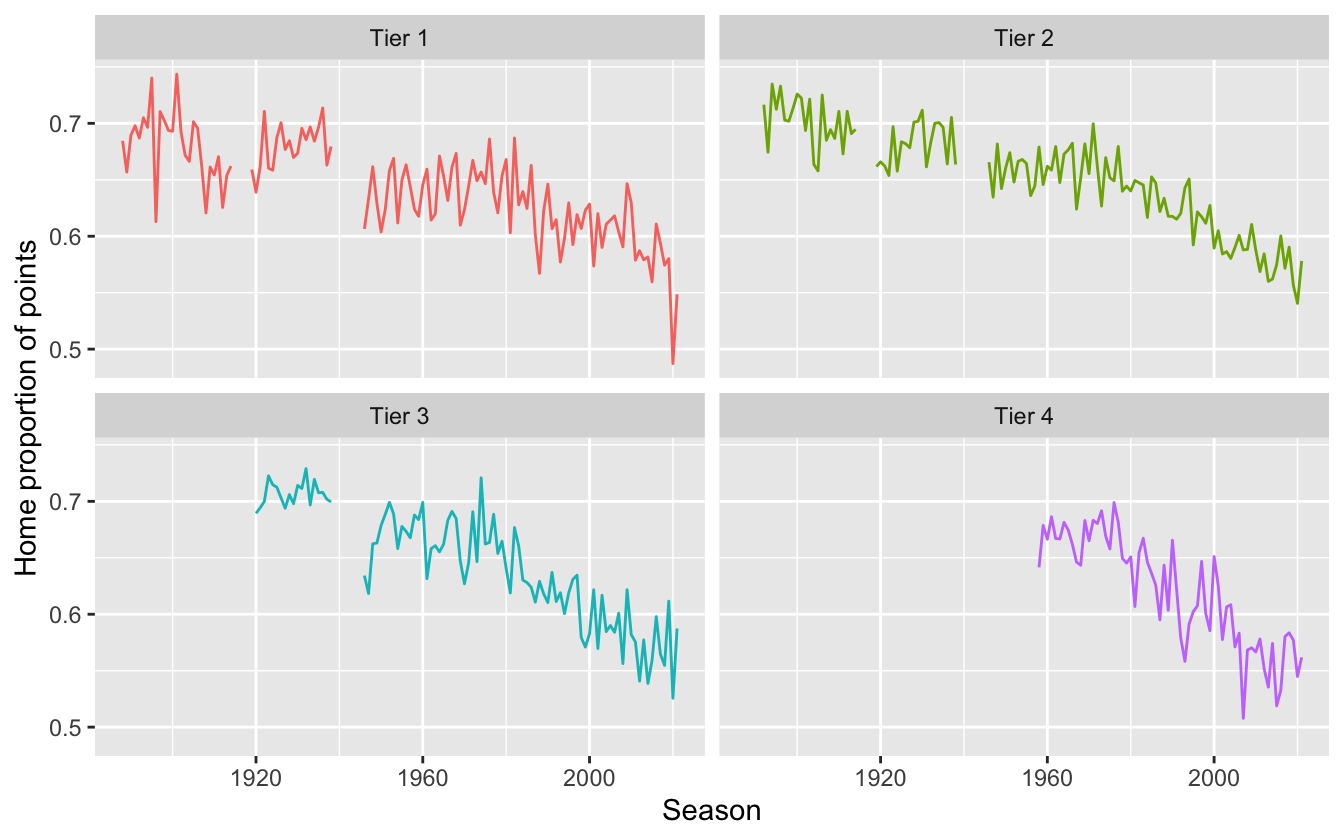
Home advantage is a common feature of team sports (Gómez-Ruano et al. (2022)). One way to measure it is to consider the proportion of a team’s points won at home. As the number of points awarded for a win was increased in 1981 from 2 to 3, the proportions before and after 1981 would not be comparable. Figure 16.3 assumes that a win was always worth 3 points.

Figure 16.3: Proportions of points won at home over time in the various tiers of the English league
The two striking features are the relatively steady decline since 1980 for the lower three tiers and the dramatic drop to below 50% in the Premier League in season 2020-21. Most of the 2020-21 Premier League games were played without fans because of Covid, so an important factor in home advantage disappeared. The sharp drops in levels in tiers 1 and 3 when the leagues restarted after the Second World War are a little surprising: why would that have happened? There is quite a lot of variability over the years and some relatively extreme values.
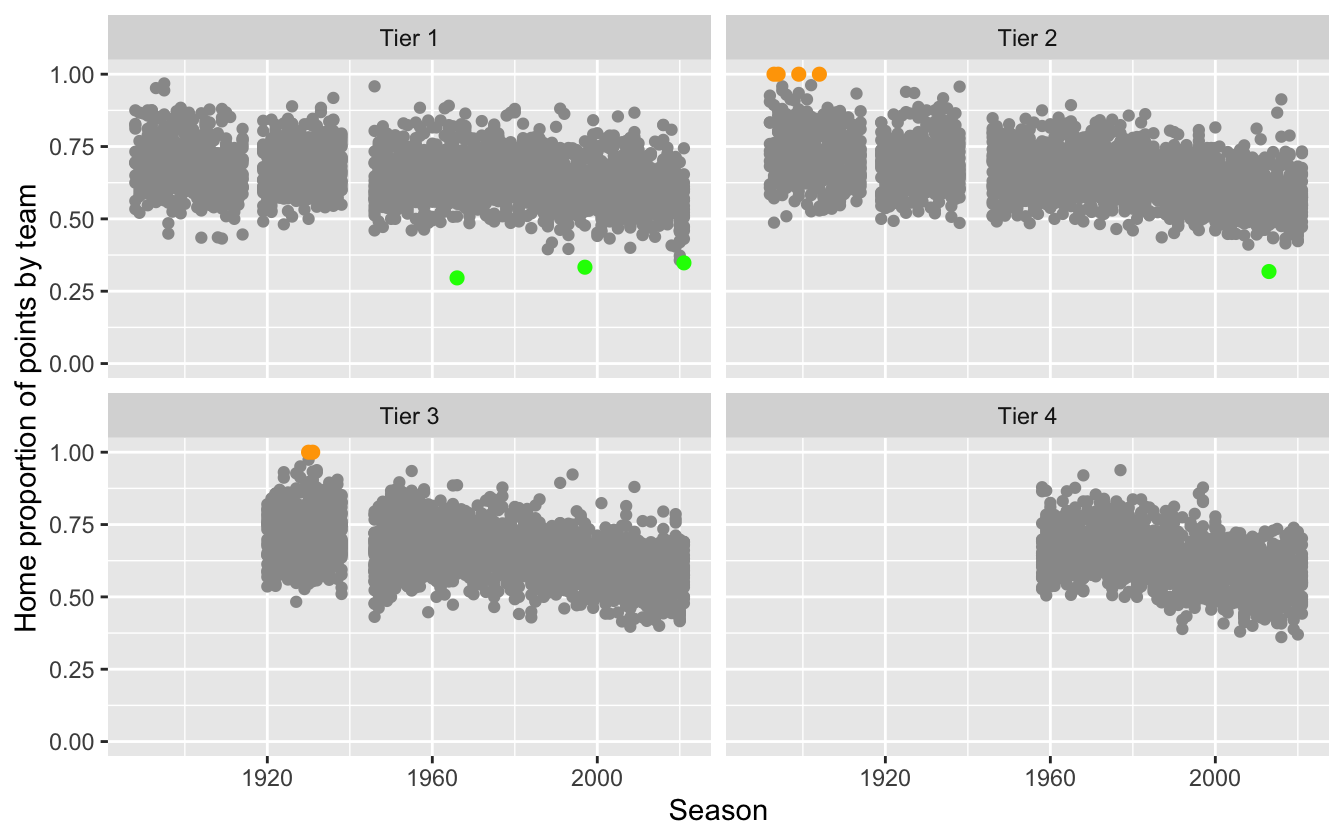
The home and away records for individual teams can also be calculated and Figure 16.4 shows the results for the four tiers separately (the gaps are the First and Second World Wars).

Figure 16.4: Proportions of points won at home for every team for every season
The overall trend is the same as in Figure 16.3 (but the vertical scales are different as these are rates for individual teams not for averages). There are some striking individual outliers. The four outliers in the early days of the second division with a home proportion of 1 (they got no points away from home), and the two from the third division later on, have been drawn bigger and coloured orange. They were:
  Season   tier               team away home
1   1893 Tier 2 Northwich Victoria    0   12
2   1894 Tier 2    Crewe Alexandra    0   13
3   1899 Tier 2       Loughborough    0    9
4   1904 Tier 2   Doncaster Rovers    0   11
5   1930 Tier 3             Nelson    0   25
6   1931 Tier 3      Wigan Borough    0   10
  HomeProportion
1              1
2              1
3              1
4              1
5              1
6              1
They all finished last except for Wigan Borough in 1931, who folded. In the first season after the Second World War Leeds United drew one away game and lost the other 20 in the first division (the top tier), although they managed six wins and five draws at home. (And yes, they finished last as well.)
The teams with the worst relative home record (proportions less than 0.35) have been drawn bigger and coloured green. They were:
  Season   tier            team away home HomeProportion
1   1966 Tier 1       Blackpool   19    8          0.296
2   1997 Tier 1  Crystal Palace   22   11          0.333
3   2013 Tier 2 Birmingham City   30   14          0.318
4   2021 Tier 1         Watford   15    8          0.348
All were relegated bar Birmingham, who survived on goal difference.