4.2 The USA in 1912 and 2020
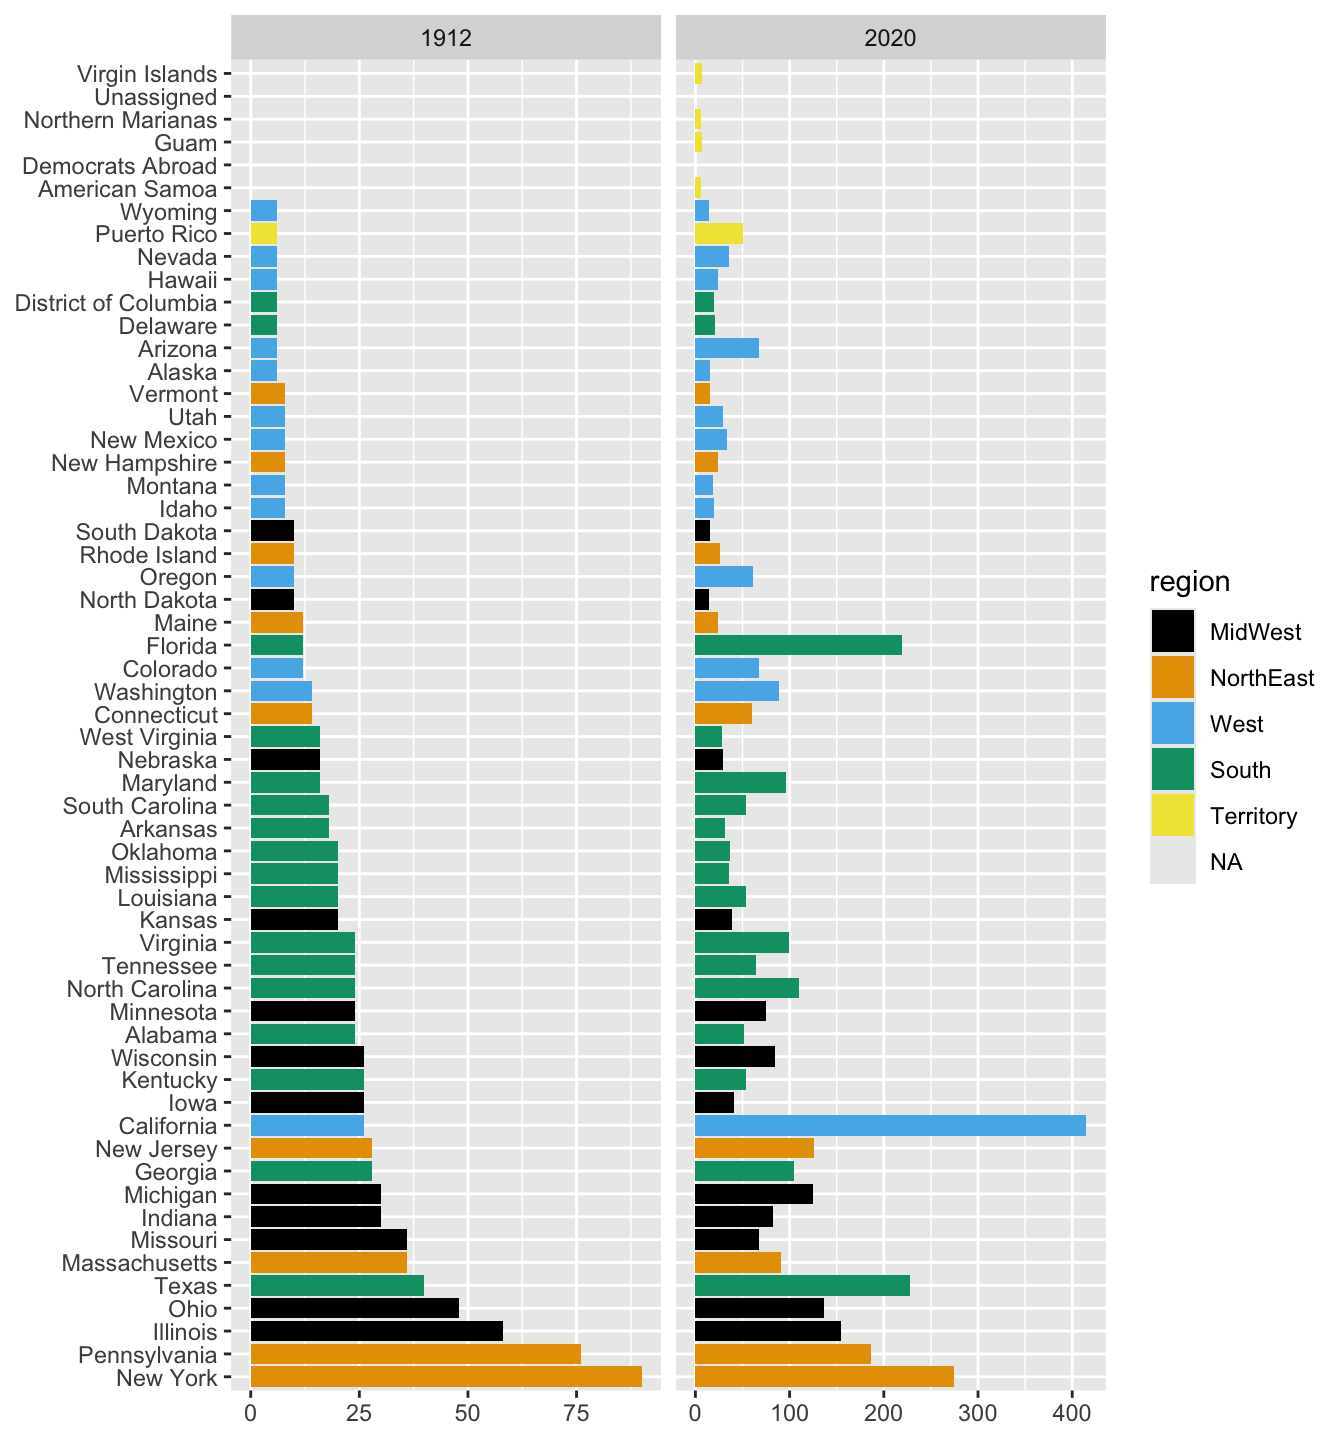
The USA in 1912 was not the same as the USA in 2020. There were only 48 states. Arizona and New Mexico achieved statehood in the early part of 1912, while Alaska and Hawaii did not join the Union until 1959. These territories had delegates at the Convention as did Washington DC and Puerto Rico. The numbers of delegates in 1912 were far fewer in total than at the Democratic Convention in 2020. There were 1088 in 1912 whereas there were 3979 pledged delegates in 2020. (There were other kinds of delegate in 2020, but the most relevant by state were the pledged delegates.) Figure 4.2 compares the numbers of delegates per area for the two Conventions. The states have been ordered by number of delegates in 1912 and coloured by the four main regions used by the Census Bureau. California and Florida stand out as having substantially bigger shares of delegates. Iowa (which had the same number of delegates as California in 1912) and Missouri are amongst the losers.

Figure 4.2: Numbers of delegates by state and territory at the 1912 and 2020 Democratic conventions (different horizontal scales)
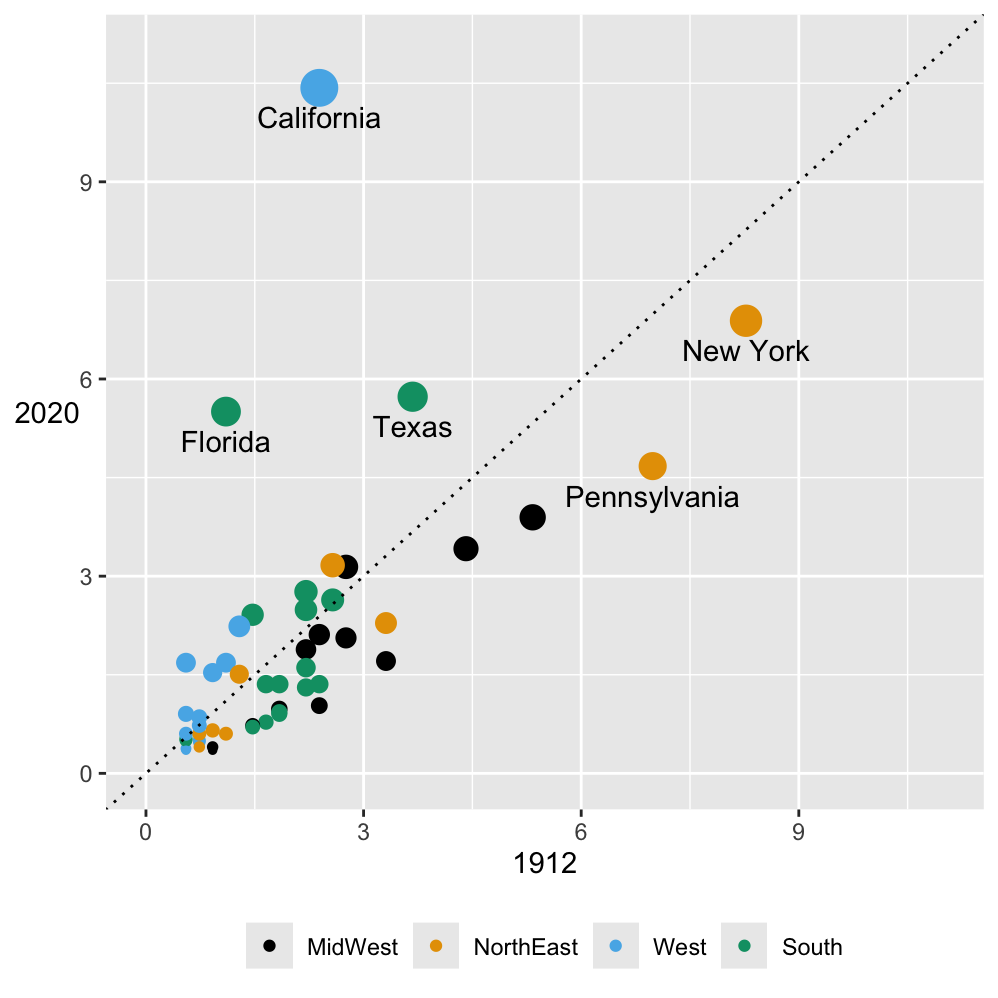
As the total numbers of delegates have increased almost fourfold, the percentage shares of delegates by state were compared. Figure 4.3 is a scatterplot of those shares in 2020 against the shares in 1912. The points are coloured by region again and the point areas are proportional to the numbers of delegates in 2020. The five states with the most delegates in 2020 have been labelled. The big increases for California and Florida stand out again and in this plot Texas does too. It is interesting to see that California had a bigger share of delegates in 2020 than New York had in 1912. Puerto Rico, which had relatively few delegates at both conventions, has been left out, as it counts as a territory and is not in one of the four regions.

Figure 4.3: Percentage state shares of delegates at the 1912 and 2020 Democratic conventions (point sizes are proportional to the number of delegates in 2020)
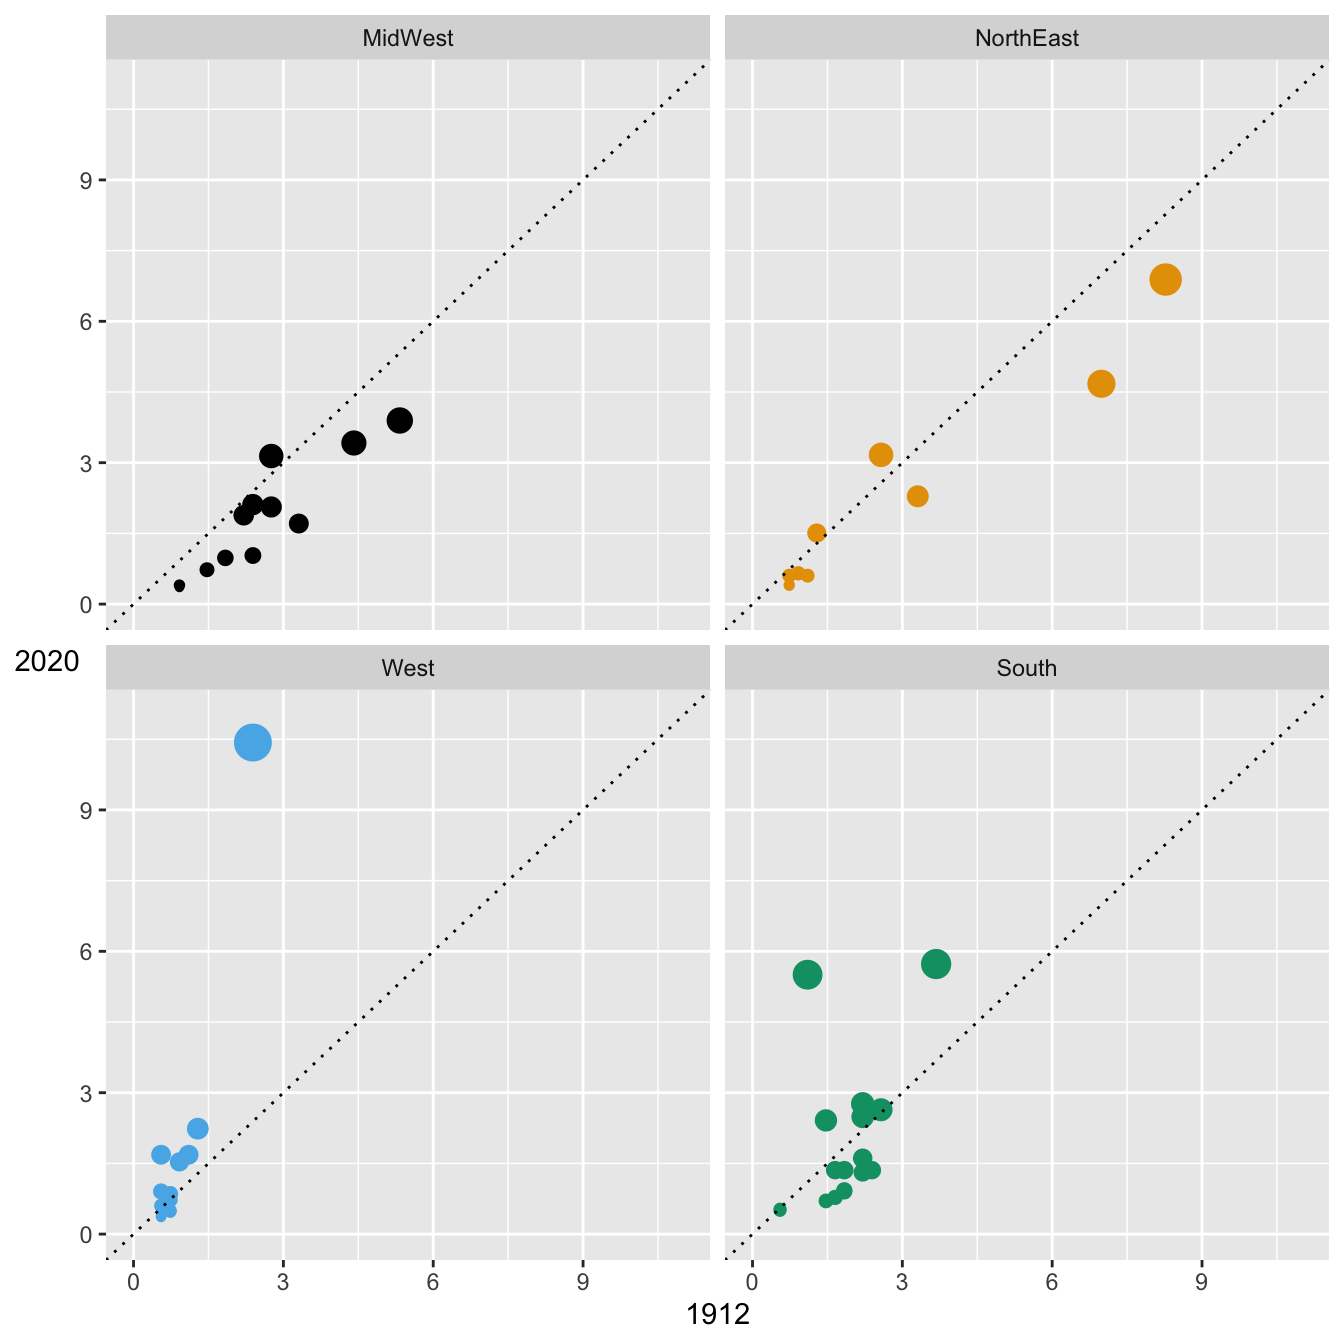
What happened in the different regions can be more easily assessed using facets. Figure 4.4 shows the scatterplot of Figure 4.3 faceted by region. Most of the Western states, but not all, increased their share like California, but by smaller amounts. Only one MidWest state out of 12 increased its share, albeit slightly. That turned out to be Michigan. States in the NorthEast also lost share.

Figure 4.4: Percentage state shares of delegates by region
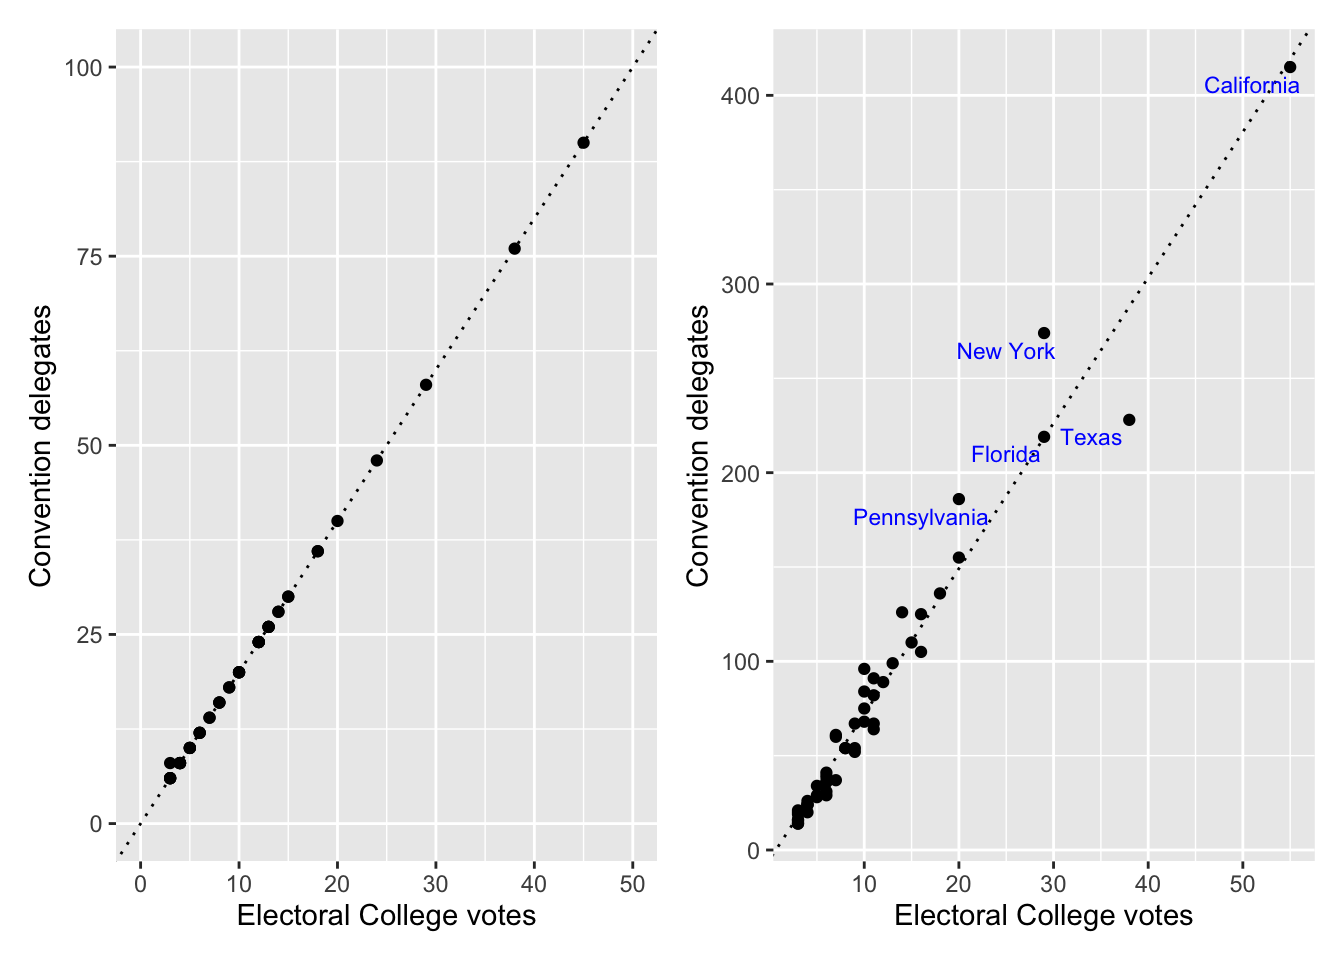
There is a further distribution of votes per state to consider, their votes in the Electoral College that actually elects the President. Figure 4.5 shows scatterplots of the number of delegates per state v. the number of Electoral College votes in 1912 and 2020. Alaska, Hawaii, Puerto Rico are excluded for 1912 (they had no Electoral College votes then), as is D.C. which first got Electoral College votes in 1964. Many smaller states had the same number of Electoral College votes, so there is a lot of overplotting.
There is a simple linear relationship, shown by the dotted line, that the number of delegates a state had at the Democratic Convention in 1912 was twice the state’s number of Electoral College Votes—with one exception down to the bottom left: New Mexico had 8 delegates, but only 3 Electoral College Votes.
The picture in 2020 was more varied. In this plot the dotted line is a regression on the data with a slope of 7.7. New York and Pennsylvania had more delegates per electoral vote and Texas fewer.

Figure 4.5: Delegates and Electoral College votes by state in 1912 (left) and 2020 (right)