19.2 Additional analyses
According to the paper, the LM test is the gold standard and it can be seen how the distribution of the new ROMD measurement differs according to cases testing negatively and positively on LM in Figure 19.4.
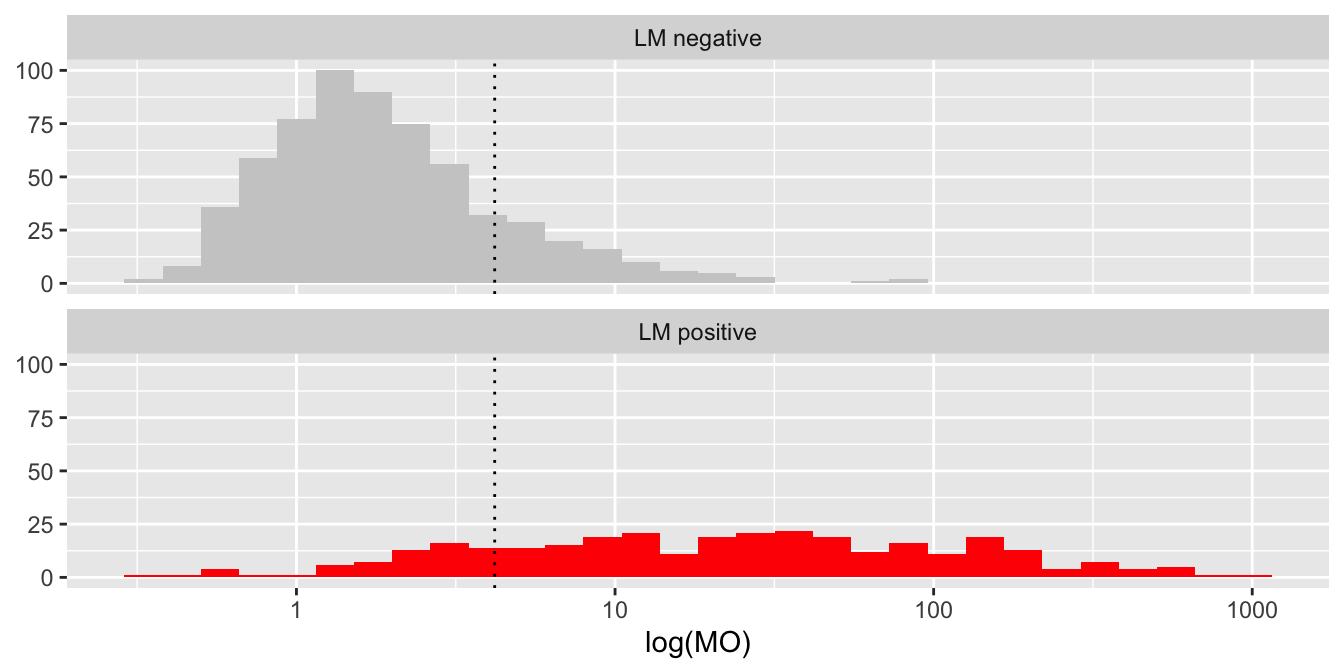
Figure 19.4: Magneto-optical measurements on a log10 scale grouped by the corresponding LM test result
Dashed lines have been drawn at the magneto-optical test cut-off. The log(MO) values are higher for the positive LM group, although there are some small values too. The same applies in reverse for the negative LM group. The choice of cut-off will depend on the numbers of ‘errors’ and on the relative importance assigned to false negatives and false positives.
Some other information was available in the dataset, including the age, weight, and sex of those tested. Figure 19.5 plots weight by age for females and males separately.
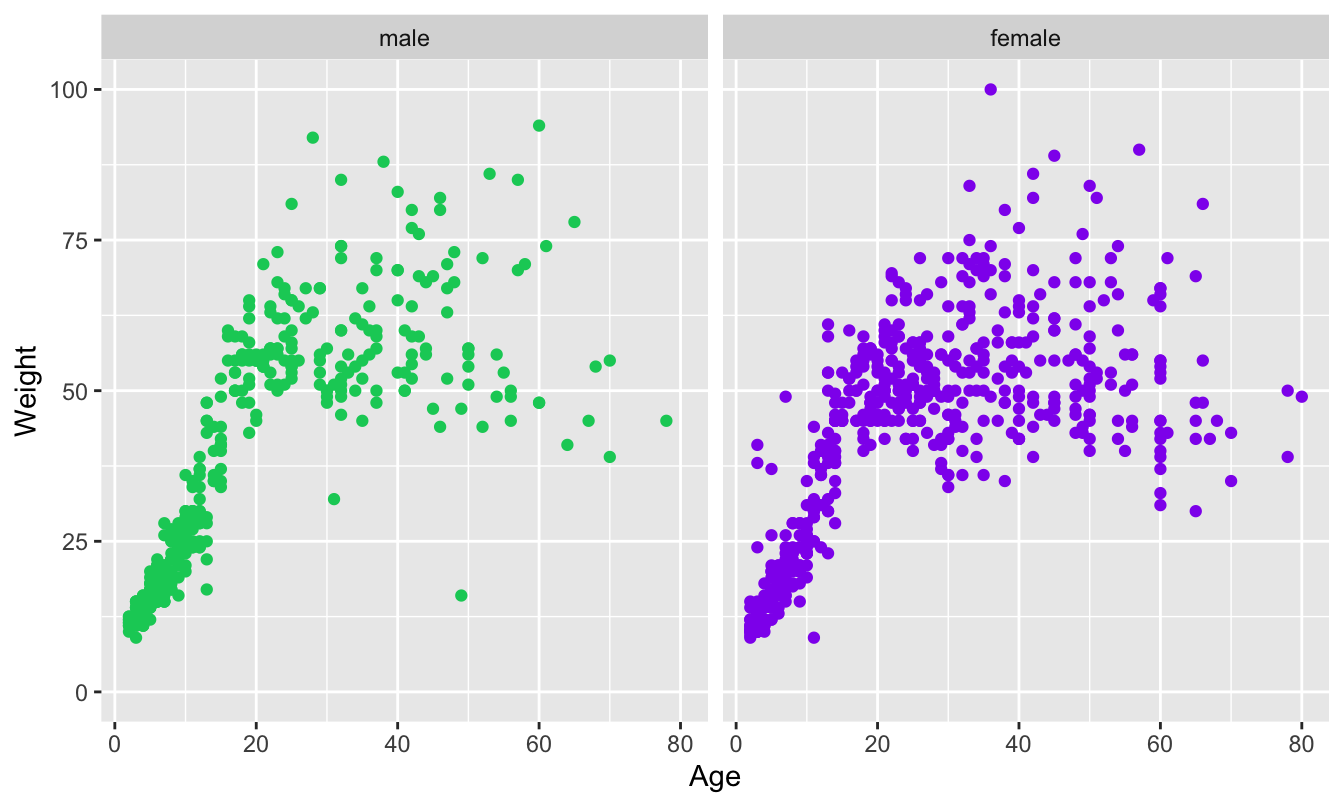
Figure 19.5: Weight by age and sex of the people tested for malaria
It is interesting to see how many young people were tested. In general those tested do not seem particularly heavy. There are a couple of low weights which look unusual and a few heavy younger women.
Answers The methods mostly agreed but disagreed on about one third of the cases. ROMD, the proposed new method, identified more cases as having malaria than the other three methods.
Further questions How sensitive are the results to changing the ROMD cut-off? Do any of the additional variables in the dataset provide information on the cases the methods differ on?