19.1 How much agreement is there between the four tests?
Malaria is endemic in Papua New Guinea. The authors of Arndt et al. (2021) have made available the raw data of their study there, involving 956 individuals checked with four different tests, so that the methods could be compared. Each test uses a different measure of the disease. Eleven cases were excluded where there were missing values for two of the tests.
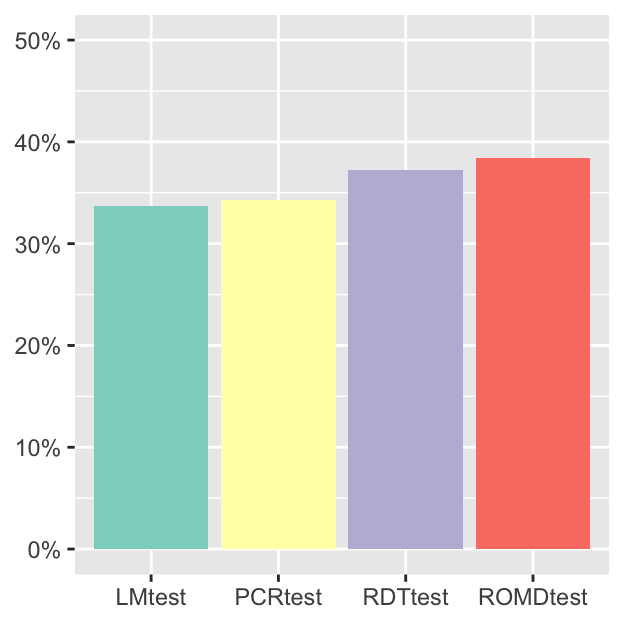
Figure 19.1 summarises the results for the remaining 945 cases.

Figure 19.1: Percentages of positives for the four tests
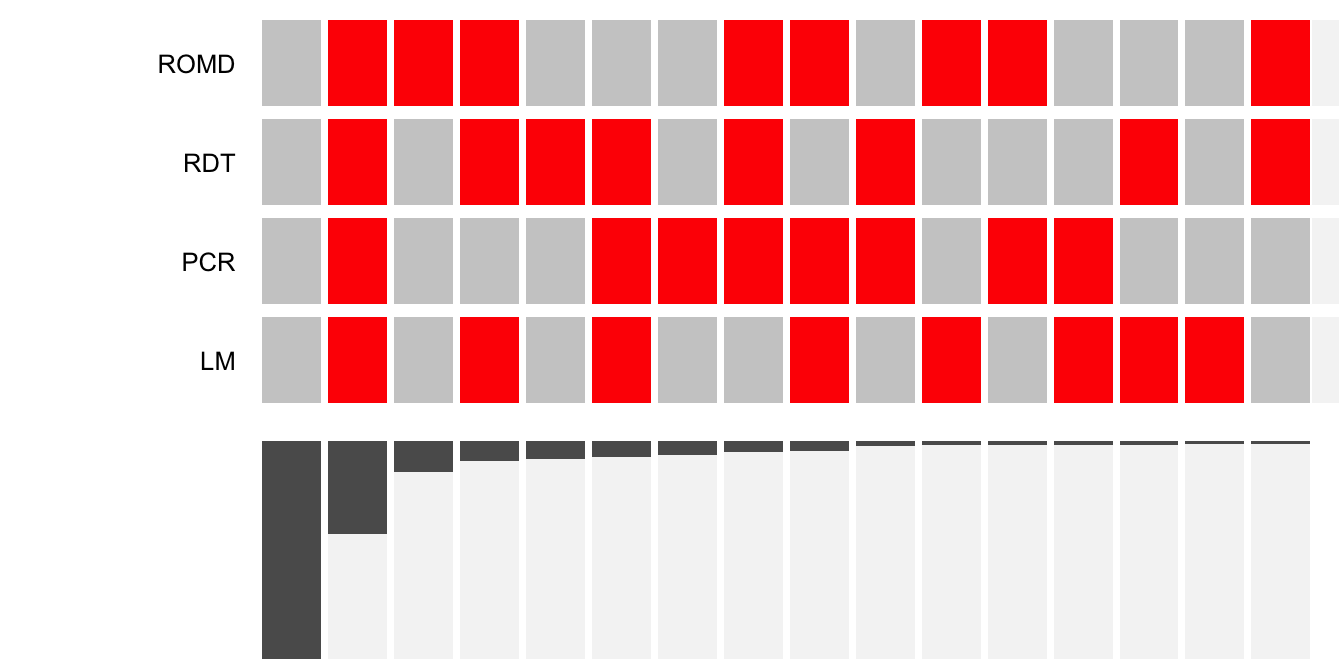
The tests found between 33.7% and 38.4% positives with the new test reporting the most positives. The authors believe that the new method may detect previous as well as current infections. Figure 19.2 displays how often the different combinations of test results arose.

Figure 19.2: Combinations of individual malaria test results (red rectangles are positives)
The first column shows the cases in which all tests gave negative results for malaria (47.4%) and the second column all cases with positive results (20.3%). The barchart at the foot of the plot shows how often each combination of test results was observed. Rules for the four tests are given in Arndt et al. (2021). There was disagreement at one level or another for 32.3% of the cases. All 16 possible combinations of results are in evidence.
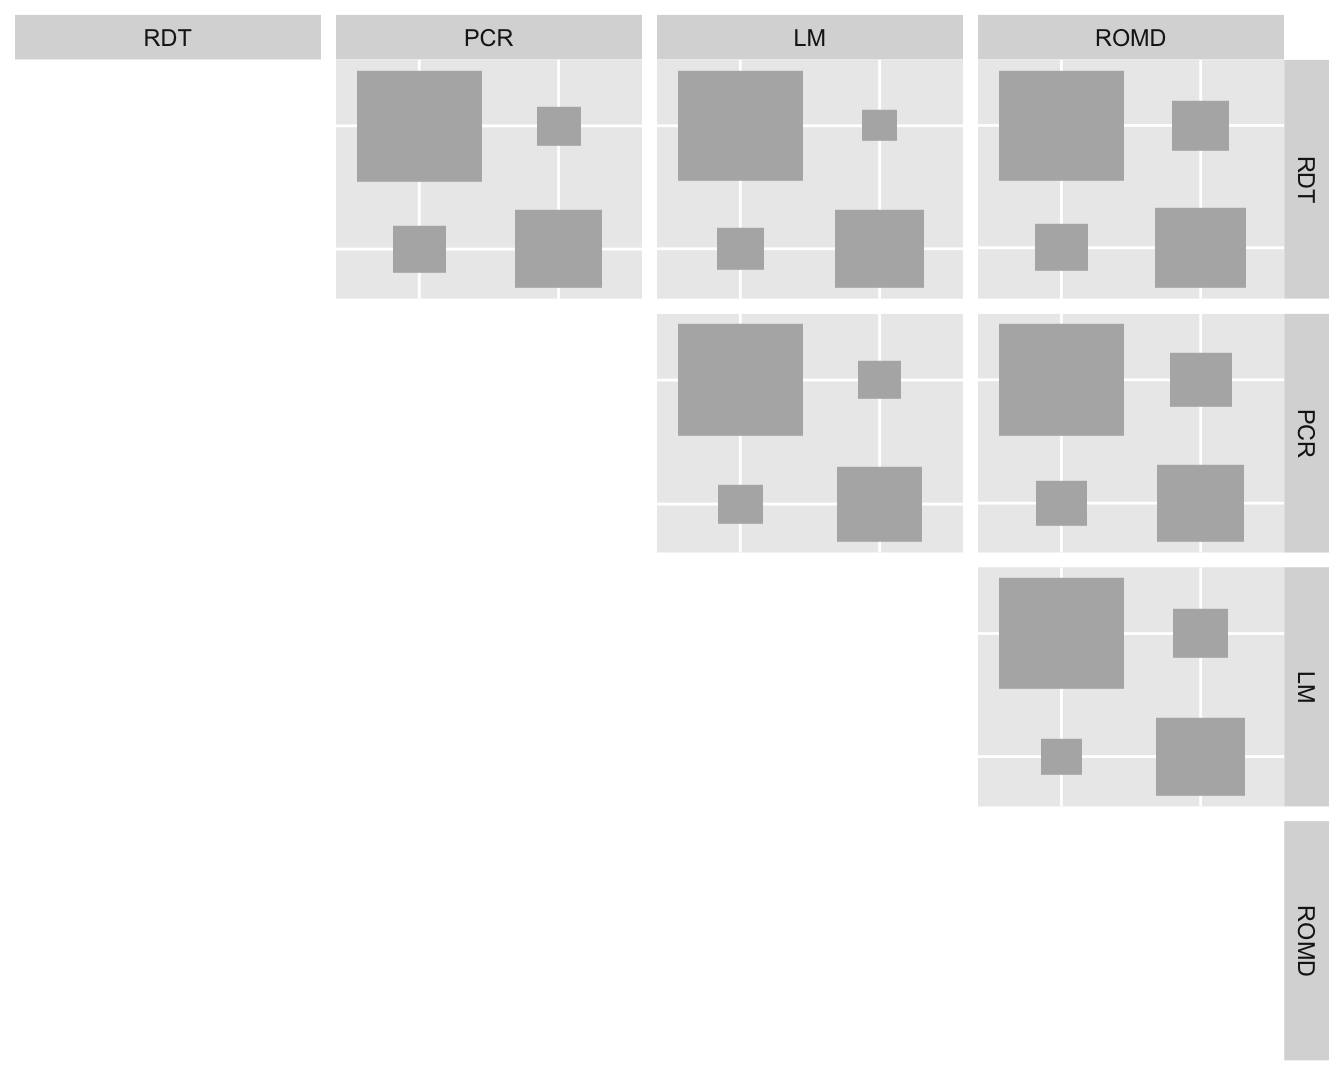
The next display shows that no one test dominates another. The main diagonal elements in each subdisplay show the numbers of disagreements between those two tests. In each case there are disagreements of both kinds, positive-negative and negative-positive. Serious cases are presumably recognised by all methods. Borderline cases may be recognised by some but not by others.

Figure 19.3: Paired comparisons of the results of the four tests