13.3 Charging patterns through the week
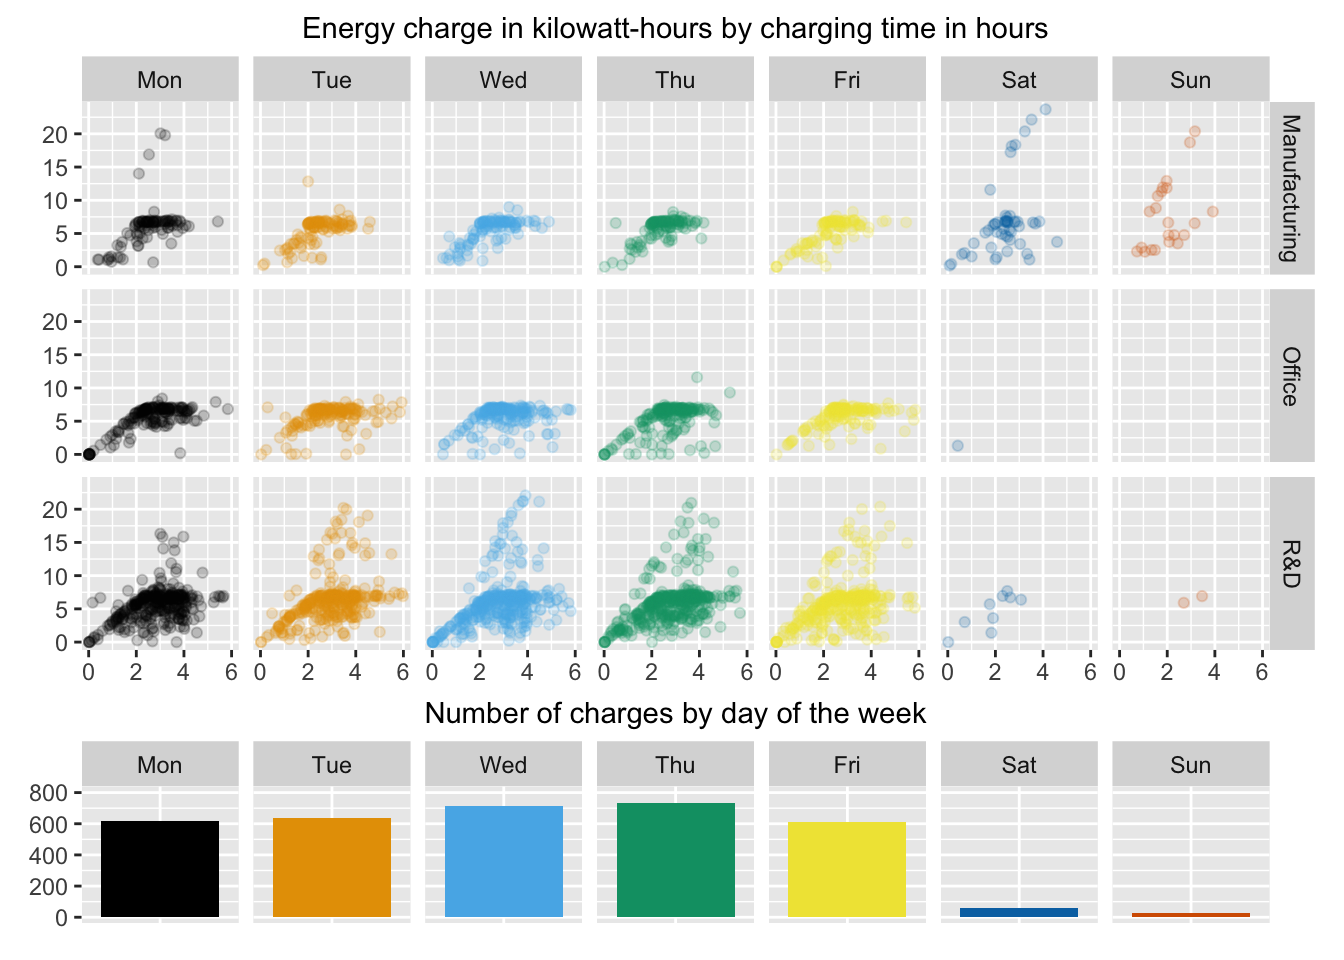
Figure 13.11 shows how scatterplots of total kilowatt charge by charge times vary by day of the week and type of facility, excluding longer charge times of over six hours and the few sessions at the two ‘Other’ locations.

Figure 13.11: Energy charge in kilowatt-hours by charging time in hours, grouped by day of the week and type of facility, excluding charging times over six hours. The barchart shows the number of charges by day.
There were few charging sessions at the weekends. As Figure 13.1 showed, there were more sessions at the R&D locations than elsewhere. The scatterplots suggest some kind of limit at around 7 kWh and the sessions at R&D included a few bigger charges during the week. There seems to be a lower boundary that at least a certain amount of time is needed for a particular charge. The authors of the study omitted 55 charging sessions when no charging took place, even though charge times were not negligible. They did include sessions with very small charges.
Answers About half the users in the study charged their cars rarely, if at all. Cars were seldom charged at weekends. Some charging locations were not used much at all. Users generally charged for less than 4 hours, at which point they had to start paying a fee.
Further questions Do charging patterns change over time? When did users start and stop using chargers during the day? What percentage of time had stations got cars connected to them?