21.4 Comparing times for men and women
21.4.1 Best times for men and women
Women have officially been allowed to run since 1975. At first few took part. Since 1980 over 30 women have finished each year, rising to over 3000 in 2019.

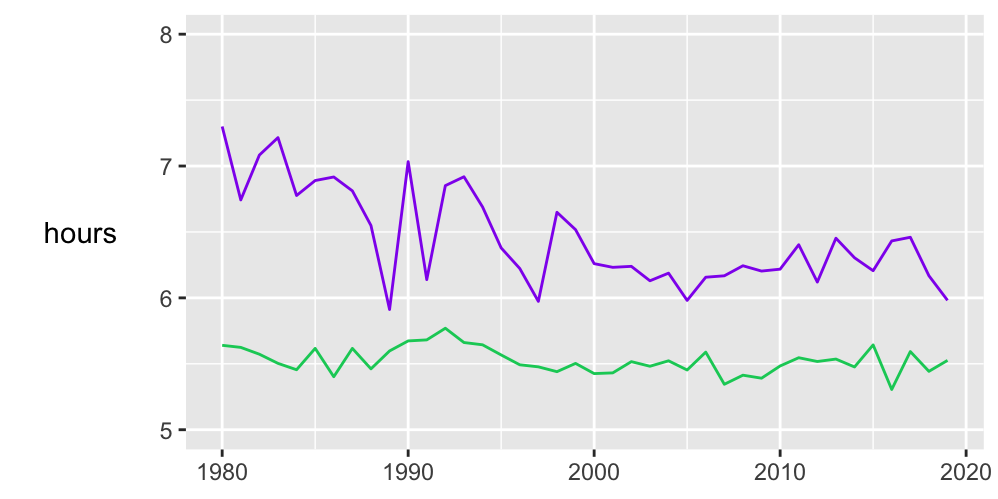
Figure 21.6: Best times for women (purple) and men (green) since 1980
Between 2000 and 2019 the mean best time for men has been about 5.5 hours and for women about 6.25 hours. Over this period some four to five times as many men have finished each year as women. The record for women is still the 1989 time of 5:54:43 by Frith van der Merwe. Not many records last that long.
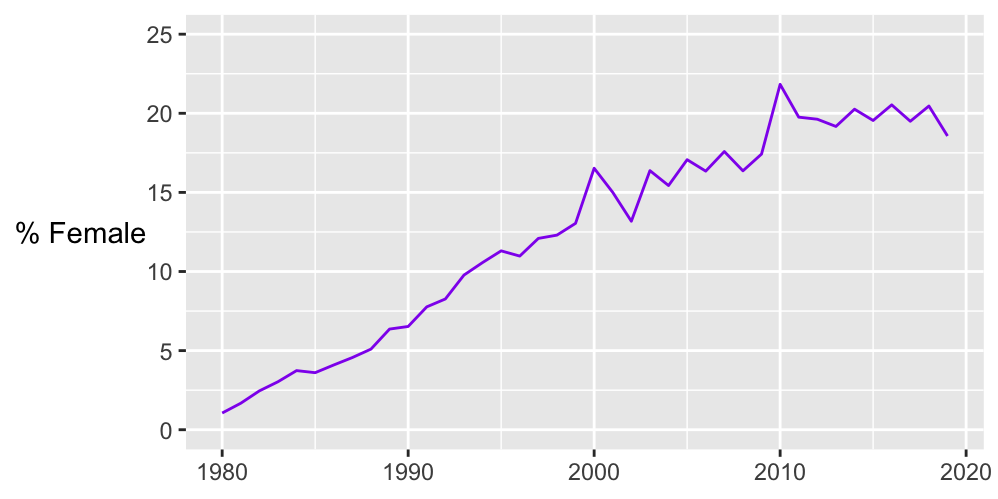
The proportion of women taking part rose fairly steadily from 1980 to 2010 and has remained at about 20% since (Figure 21.7).

Figure 21.7: Percentage of women participants since 1980
21.4.2 Median times for men and women
Best times can vary quite a lot between years, whereas median times are likely to be more stable. Figure 21.8 shows the patterns of medians for men and women since 1980.
Figure 21.8: Median times for men and women for “up” (dark orange) and “down” (black) races since 1980 and the numbers finishing
The medians have been increasing steadily, apart from the year 2000 which has already been discussed. The graph for the “up” runs tends to be slightly higher than the graph for the “down” runs. The average difference between the male and female medians has been just over half an hour. Again, it is important to remember the much greater numbers of males running.