7.1 Bertin’s classic book
The book Semiology of Graphics (Bertin (2010)) is deservedly a classic amongst texts on statistical graphics. Wainer has written that “For technical details [it] is without peer” (Wainer (1997)) and that it “laid the groundwork for modern research in graphics” (Wainer (2004)). Lee Wilkinson has stated (Wilkinson (2005)) : “It has taken me ten years of programming graphics to understand and appreciate the details in Bertin.” Bertin’s work is important because he wrote about general principles for drawing graphics and introduced theoretical structure.
The book includes a whole chapter of \(39\) pages devoted to the workforce dataset (Part One Chapter III A). As a section heading on its first page says, “A hundred different graphics for the same information”. Most of the data are printed out at the beginning of the chapter: the numbers of people working in the three sectors of Agriculture, Industry, and Commerce in each department, given in thousands. An original source for the data is not given and there are no details on how the sectors were defined. There are minor inconsistencies in the totals, some, but not all, doubtless due to rounding. Paris is included as a separate entity and Corsica is excluded.
Bertin also draws graphics for numbers of workers per square kilometre, based on the areas of the departments. To calculate these here, most department areas were taken from a dataset of France in the 1830s provided in the package Guerry. For the few newer French departments the data were taken from Wikipedia.
A shapefile map of the current French departments is available on the website of the Institut Géographique National. Details are given in a French article on cartography with (Coulmont (2010)). The map does not have the five overseas departments, which are not relevant for Bertin’s dataset, but it does include the two Corsican departments and the six new departments created in \(1967\) by splitting up Seine and Seine-et-Oise. To adjust for \(1954\), the year of Bertin’s data, the map was amended accordingly.
Dedicated Geographic Information System (GIS) software includes ways of dealing with enclaves, parts of one area completely enclosed by another. This was not expected to be an issue, but surprisingly it turned out that five departments have enclaves, amongst them, most notably, the Enclaves des Papes in Drôme, which is actually part of the department of Vaucluse. Discovering such tidbits of information is one of the serendipitous pleasures of Exploratory Data Analysis: you end up learning more than just about the data to hand.
7.1.1 A first map: agricultural workers

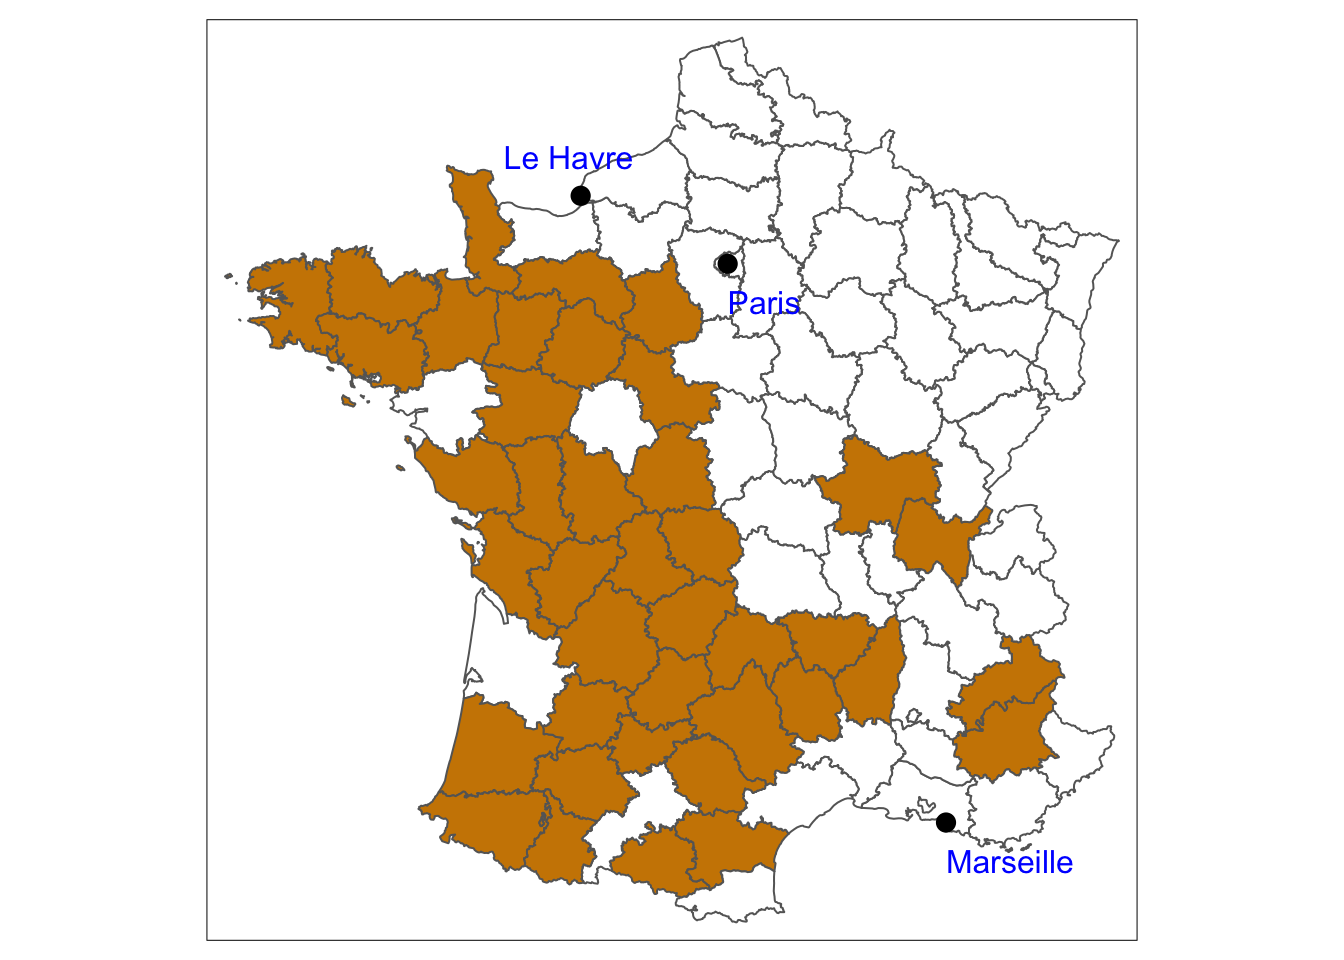
Figure 7.1: Departments in France in 1954 where agricultural workers made up at least 40% of the workforce.
Figure 7.1 shows the \(90\) departments of France in 1954 with the 40 highlighted in which agricultural workers made up at least \(40\%\) of the workforce. There is a fairly clear division into East and West, something that is described in French texts under the heading of the Le Havre-Marseille line. The line may have declined in importance over the last thirty years, but in 1954 it was still relevant.
Given the large number of maps that Bertin included, you would expect several geographic patterns to be identified and discussed, yet none are. It is a puzzling omission.