Visualization
library(panelView)
library(fixest)
library(tidyverse)
base_stagg <- fixest::base_stagg |>
    # treatment status
    dplyr::mutate(treat_stat = dplyr::if_else(time_to_treatment < 0, 0, 1)) |>
    select(id, year, treat_stat, y)

head(base_stagg)
#>   id year treat_stat           y
#> 2 90    1          0  0.01722971
#> 3 89    1          0 -4.58084528
#> 4 88    1          0  2.73817174
#> 5 87    1          0 -0.65103066
#> 6 86    1          0 -5.33381664
#> 7 85    1          0  0.49562631

panelView::panelview(
    y ~ treat_stat,
    data = base_stagg,
    index = c("id", "year"),
    xlab = "Year",
    ylab = "Unit",
    display.all = F,
    gridOff = T,
    by.timing = T
)
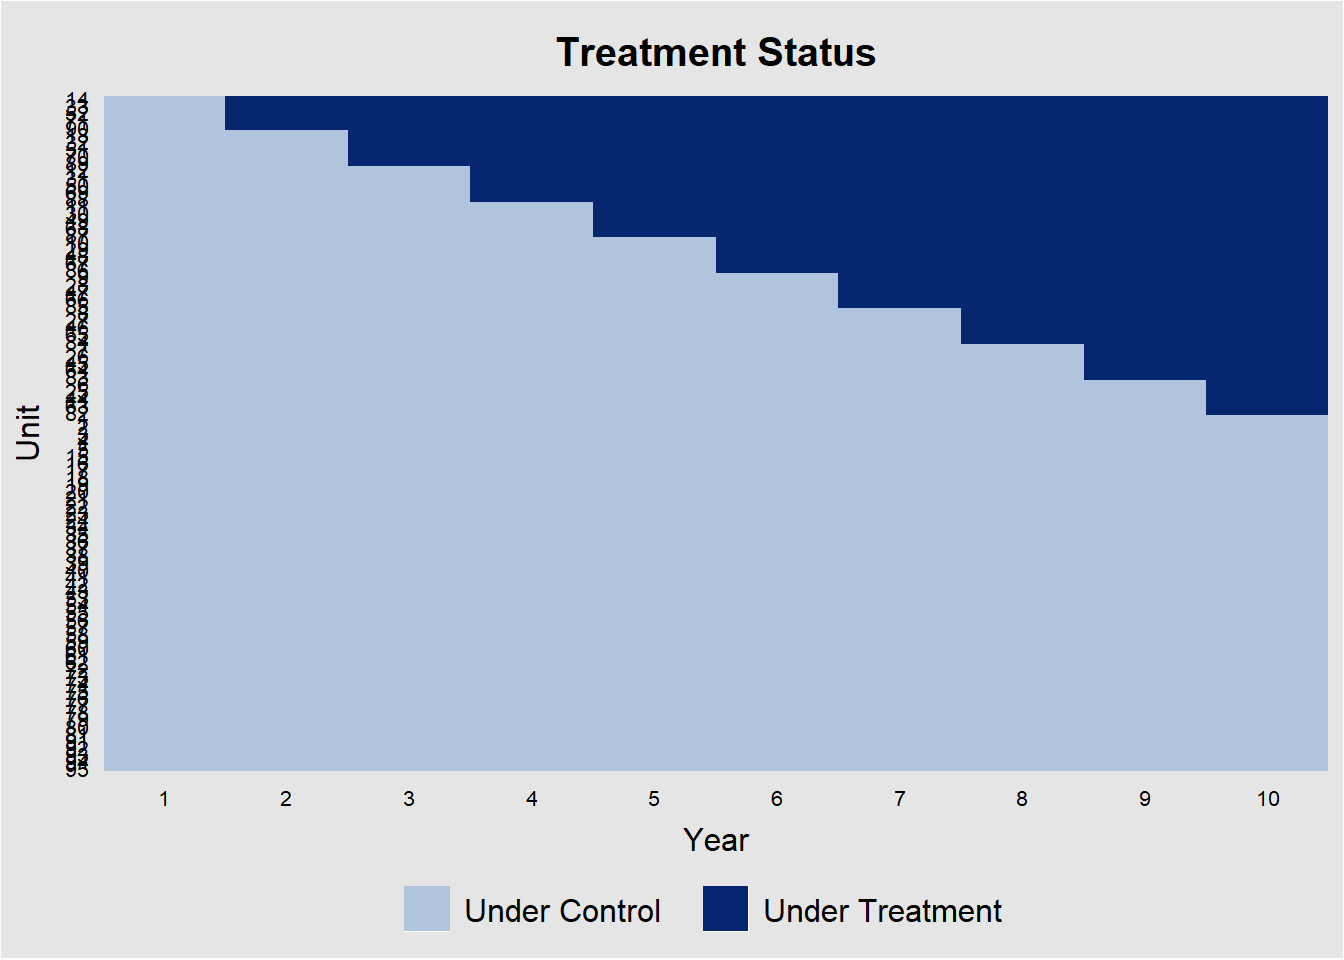
# alternatively specification
panelView::panelview(
    Y = "y",
    D = "treat_stat",
    data = base_stagg,
    index = c("id", "year"),
    xlab = "Year",
    ylab = "Unit",
    display.all = F,
    gridOff = T,
    by.timing = T
)

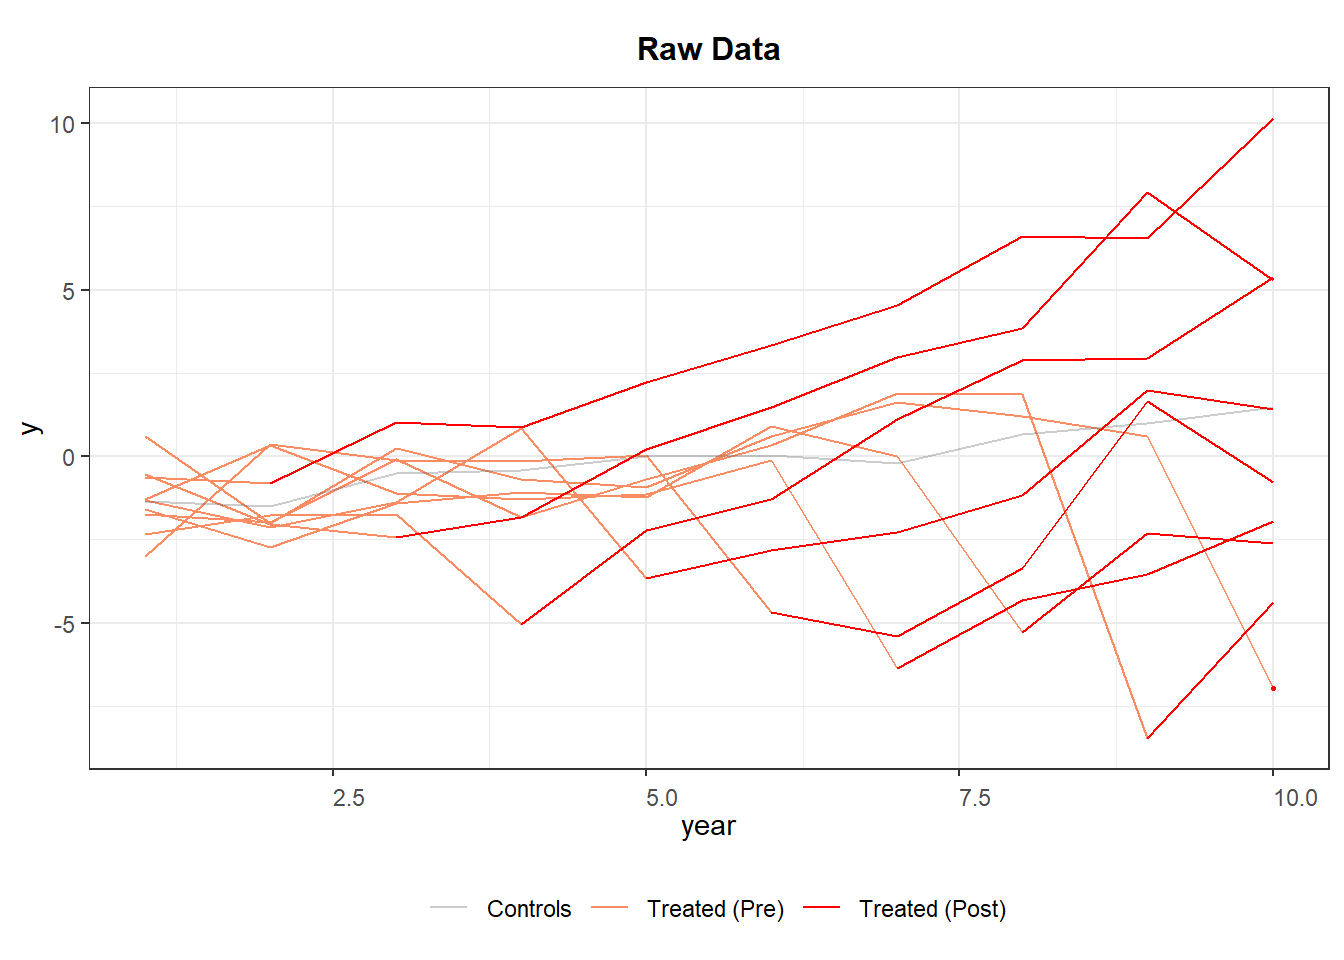
# Average outcomes for each cohort
panelView::panelview(
    data = base_stagg,
    Y = "y",
    D = "treat_stat",
    index = c("id", "year"),
    by.timing = T,
    display.all = F,
    type = "outcome",
    by.cohort = T
)
#> Number of unique treatment histories: 10