13.1 Active versus passive strategies
Strategies followed by investors can be classified into two main families:
Active strategies: the premise is that the market is not perfectly efficient (Shiller, 1981) and through expertise one can add value by choosing high performing assets and beat the market performance. Examples include the portfolios paradigms presented in the previous chapters, namely: mean–variance portfolios (Chapter 7), high-order portfolios (Chapter 9), portfolios with alternative measures of risk (Chapter 10), risk parity portfolios (Chapter 11), and graph-based portfolios (Chapter 12).
Passive strategies: the assumption is that the market is efficient (Fama, 1970), in the sense that prices reflect all available information, and as a consequence the market cannot be beaten in the long run (Malkiel, 1973). Passive investing methods seek to avoid the fees and limited performance that may occur with frequent trading and instead focus on infrequent rebalancing. This chapter precisely deals with the problem of index tracking as a way of passive investment (Benidis et al., 2018a; Prigent, 2007).
13.1.1 Beating the market
Can investors consistently beat the market? One only hears from the winners. Nobody writes articles celebrating the worst-performing mutual fund manager. However, to perform a proper data analysis, we also need to collect data from the losers and separate luck from skill.
Data clearly shows that individual investors who trade stocks directly pay a tremendous performance penalty for active trading (B. M. Barber and Odean, 2000). Perhaps expert financial managers can do better?
The percentage of fund managers who do not outperform the index can vary depending on the time period, the index being used as a benchmark, and the specific group of fund managers being analyzed. However, numerous studies have found that around 85-95% of actively managed mutual funds, which are run by professional fund managers, fail to outperform their respective benchmark indices over the long term (Malkiel, 1973).
Some interesting and even provocative conclusions include (Malkiel, 1973):
“investors are far better off buying and holding an index fund than attempting to buy and sell individual securities or actively managed mutual funds;”
and
“the market prices stocks so efficiently that a blindfolded chimpanzee throwing darts at the stock listings can select a portfolio that performs as well as those managed by the experts.”
As a consequence, most investors have figured out that they are not good at stock-picking or managing trades, not even most professionals are. Thus, paying high mutual fund expenses to a manager who underperforms a benchmark makes little sense. This realization has led to the rise of indices and inexpensive exchange-traded funds (ETFs).
13.1.2 What is a financial index?
A financial index is defined as a collection of carefully selected assets to capture the value of a specific market or a segment of it. An index is effectively equivalent to a hypothetical portfolio of assets; however, one cannot invest directly on it, i.e., an index is not a financial instrument that can be traded.
An index is defined by the universe of assets composing it and also the percentage of the composition. The most common type of index follows a capitalization-weighted (cap-weighted) approach:57 the assets are weighted based on the ratio of their market capitalization (number of outstanding shares multiplied by share price) to the overall capitalization of the assets that compose the index. The index value is then proportional to the weighted average of the capitalization of the underlying assets.
The Standard & Poor’s 500 (S&P 500) is one of the world’s best known (cap-weighted) indices and one of the most commonly used benchmarks for the U.S. stock market. Figure 13.1 shows the price of the S&P 500 index over more than a decade. As can be observed, the S&P 500 has historically risen and reasonable returns can be obtained simply by following the market without an active risk management (this still holds after adjusting the price for inflation assuming a 2% annual inflation rate). Note that this period includes two severe crises: the 2007–2008 global financial crisis and the COVID-19 recession (starting around February 2020).
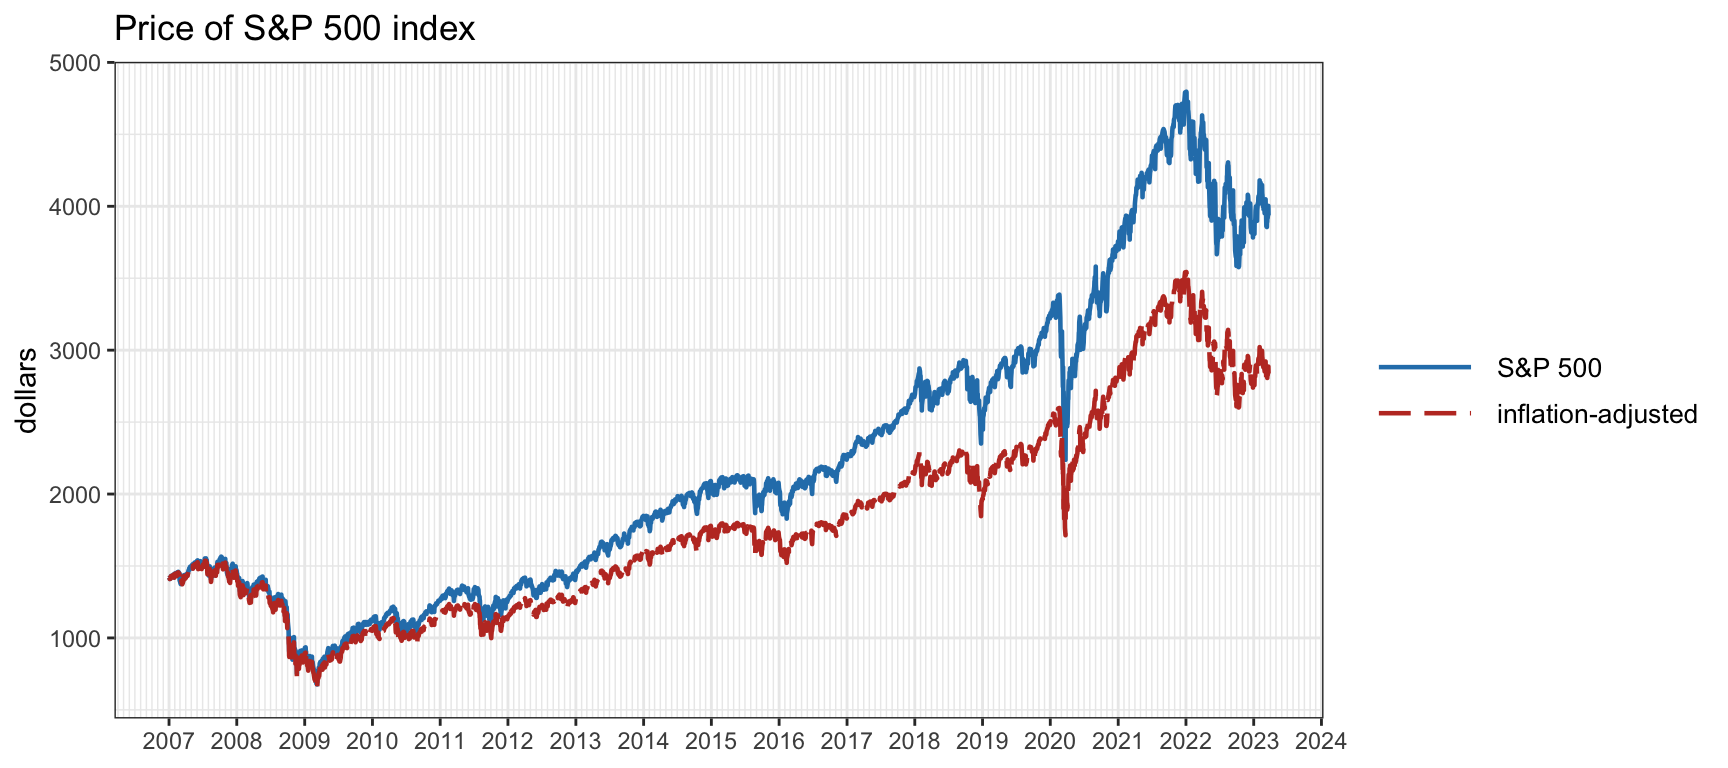
Figure 13.1: Price evolution of the S&P 500 index.
While it is difficult to give a precise number of existing financial indices, as new indices are created and old indices are retired or replaced regularly, it is safe to say that there are thousands of financial indices that cover a wide range of asset classes, sectors, and regions. Some of the most well-known indices include the S&P 500 (USA), Dow Jones Industrial Average (USA), Nasdaq Composite (USA), FTSE 100 (UK), Nikkei 225 (Japan), DAX (Germany), Hang Seng Index (Hong Kong), and IBEX 35 (Spain), among many others.
13.1.3 Index tracking
An index is just a definition based on a hypothetical portfolio of assets and cannot be directly traded. In practice, one has to construct a real portfolio that tracks or mimics the index as closely as possible. Index tracking, also known as index replication, is a passive portfolio management strategy that attempts to reproduce the performance of a market index.
In the current financial markets, there is a staggering number of ETFs that precisely track any given index and investors can directly trade them. However, these ETFs still have to be constructed by financial managers. For example, as of 2023, there are over 250 ETFs that track the S&P 500 index, with the most popular one being the SPDR S&P 500 ETF, which happens to be the largest and oldest ETF in the world. Figure 13.2 shows the S&P 500 index together with the SPDR S&P 500 ETF (under the ticker SPY). As can be observed from the plot, its value is approximately 1/10 of the cash S&P 500 level. Nevertheless, this ratio is not exactly maintained in the long run, as it goes approximately from 1/14 to 1/10 over time during 2007–2023. This is not critical since for hedging purposes it is the short-term variations that matter.
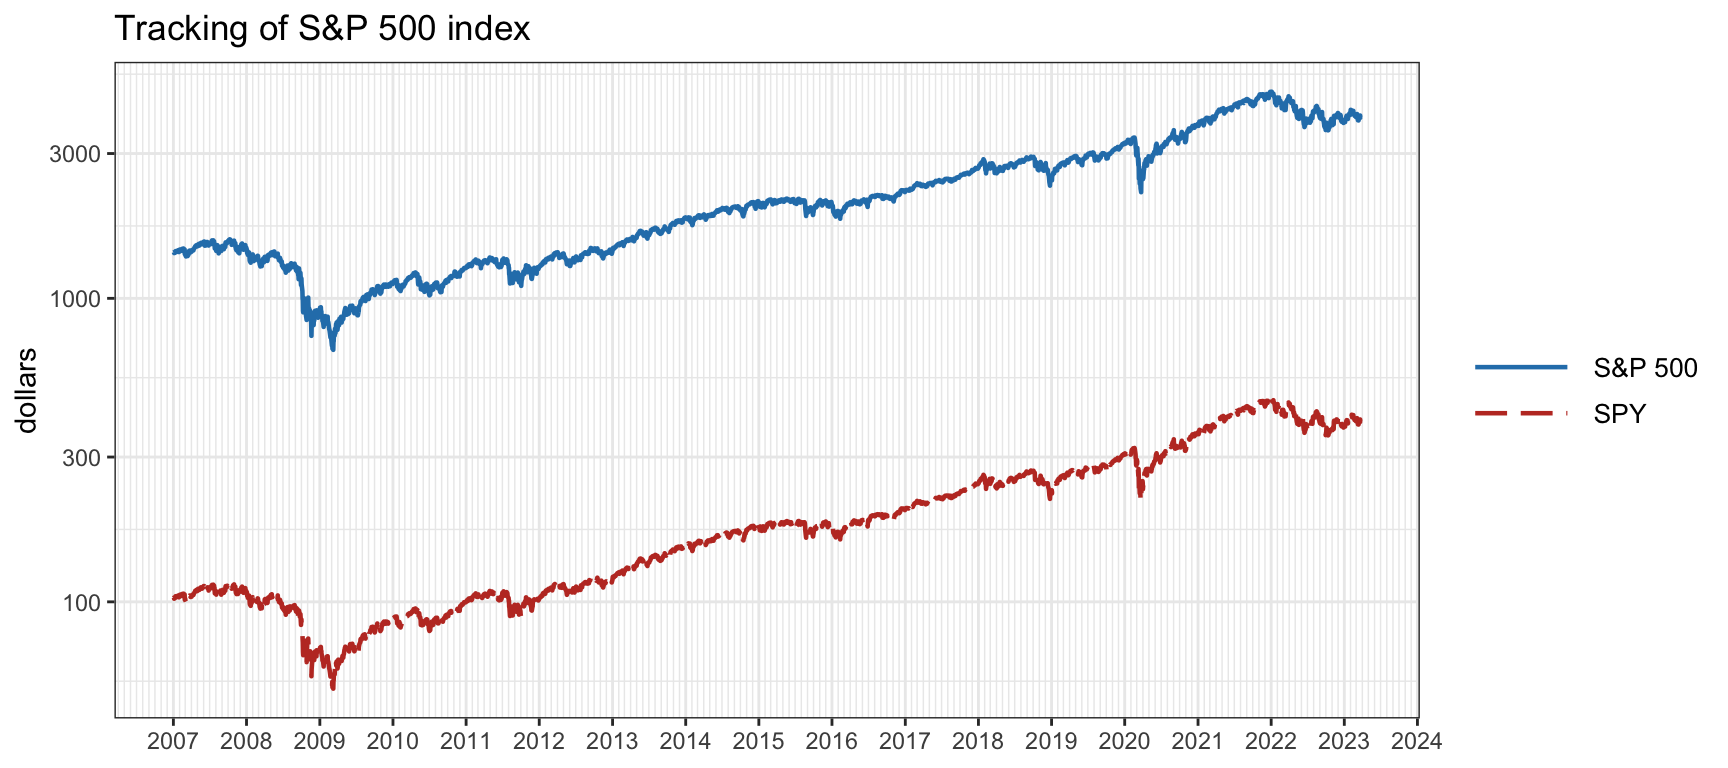
Figure 13.2: Tracking of the S&P 500 index by the SPDR S&P 500 ETF.
The most straightforward approach to create a tracking portfolio is by buying appropriate quantities of all the assets that compose the index, the so-called full replication. This technique requires knowledge of the precise index composition, which is not always available in real time. It also needs a regular rebalancing of all the portfolio positions as the index composition is updated (including the less liquid assets), which translates into transaction costs.
Due to the aforementioned transaction cost reasons and also to logistic arguments (managing a smaller portfolio is more convenient), it is advantageous from a practical standpoint to hold active positions only on a reduced basket of representative assets of the whole index universe. For example, instead of keeping an active portfolio of 500 assets to track the S&P 500 index, it may be better and simpler to invest on, say, only 20 assets properly selected to represent the index. This is referred to as sparse index tracking or portfolio compression (Benidis et al., 2018b, 2018a; Jansen and Van Dijk, 2002; Machkour et al., 2024; Maringer and Oyewumi, 2007; Scozzari et al., 2013; Xu et al., 2016). Interestingly, this problem is related to sparse regression techniques in statistics as overviewed next.
References
Apart from the common cap-weighted indices (weighted according to the market capitalization), there are other types of index construction methods, such as price-weighted, equal-weighted, fundamentally-weighted, and factor-weighted.↩︎