15.3 Pairs Trading
Trading an asset with mean reversion is quite simple: buy when it is below its mean value and unwind the position when it recovers to make a profit; similarly, short-sell it when it is above its mean value and unwind the position when it reverts back. Unfortunately, it is virtually impossible to find such a mean-reverting asset directly in a financial market. In fact, if there were such an asset, then many traders would notice and trade it, which would immediately eliminate its profitability.
In practice, one can attempt to discover a cointegrated pair of assets and then create a virtual mean-reverting asset (a spread). By virtue of the mean reversion property of the constructed spread, the common market trend present in the two original assets is nonexistent in the spread, which means that the spread does not follow the market trend and it is market neutral.
Pairs trading is a market-neutral strategy that trades a mean-reverting spread. That is, it identifies two historically cointegrated financial instruments, such as stocks, and takes long and short positions in the two instruments when their prices deviate from their historical mean relationship, with the expectation that the prices will eventually revert back to the historical equilibrium, allowing the trader to profit from the convergence. Some monographic books on pairs trading include Vidyamurthy (2004), Ehrman (2006), and Chan (2013); see also Feng and Palomar (2016).
Pairs trading was developed in the mid-1980s by a quantitative trading team led by Nunzio Tartaglia at Morgan Stanley, achieving significant success. The team was disbanded in 1989 and the members joined various other trading firms. As a consequence, the initial secrecy of pairs trading was lost and the technique spread over the quant community.
Trading strategies can be broadly classified according to the underlying philosophy as follows:
Momentum-based strategies (or directional trading): These attempt to capture the market trend while treating the fluctuations as undesired noise (risk).
Pairs trading (or statistical arbitrage): These strategies are market neutral and try to trade the mean-reverting fluctuations of the relative mispricings between the two securities.
Figure 15.6 displays the breakdown of an asset’s prices into the trend component (captured by momentum-based strategies) and the mean-reverting component (captured by pairs trading).
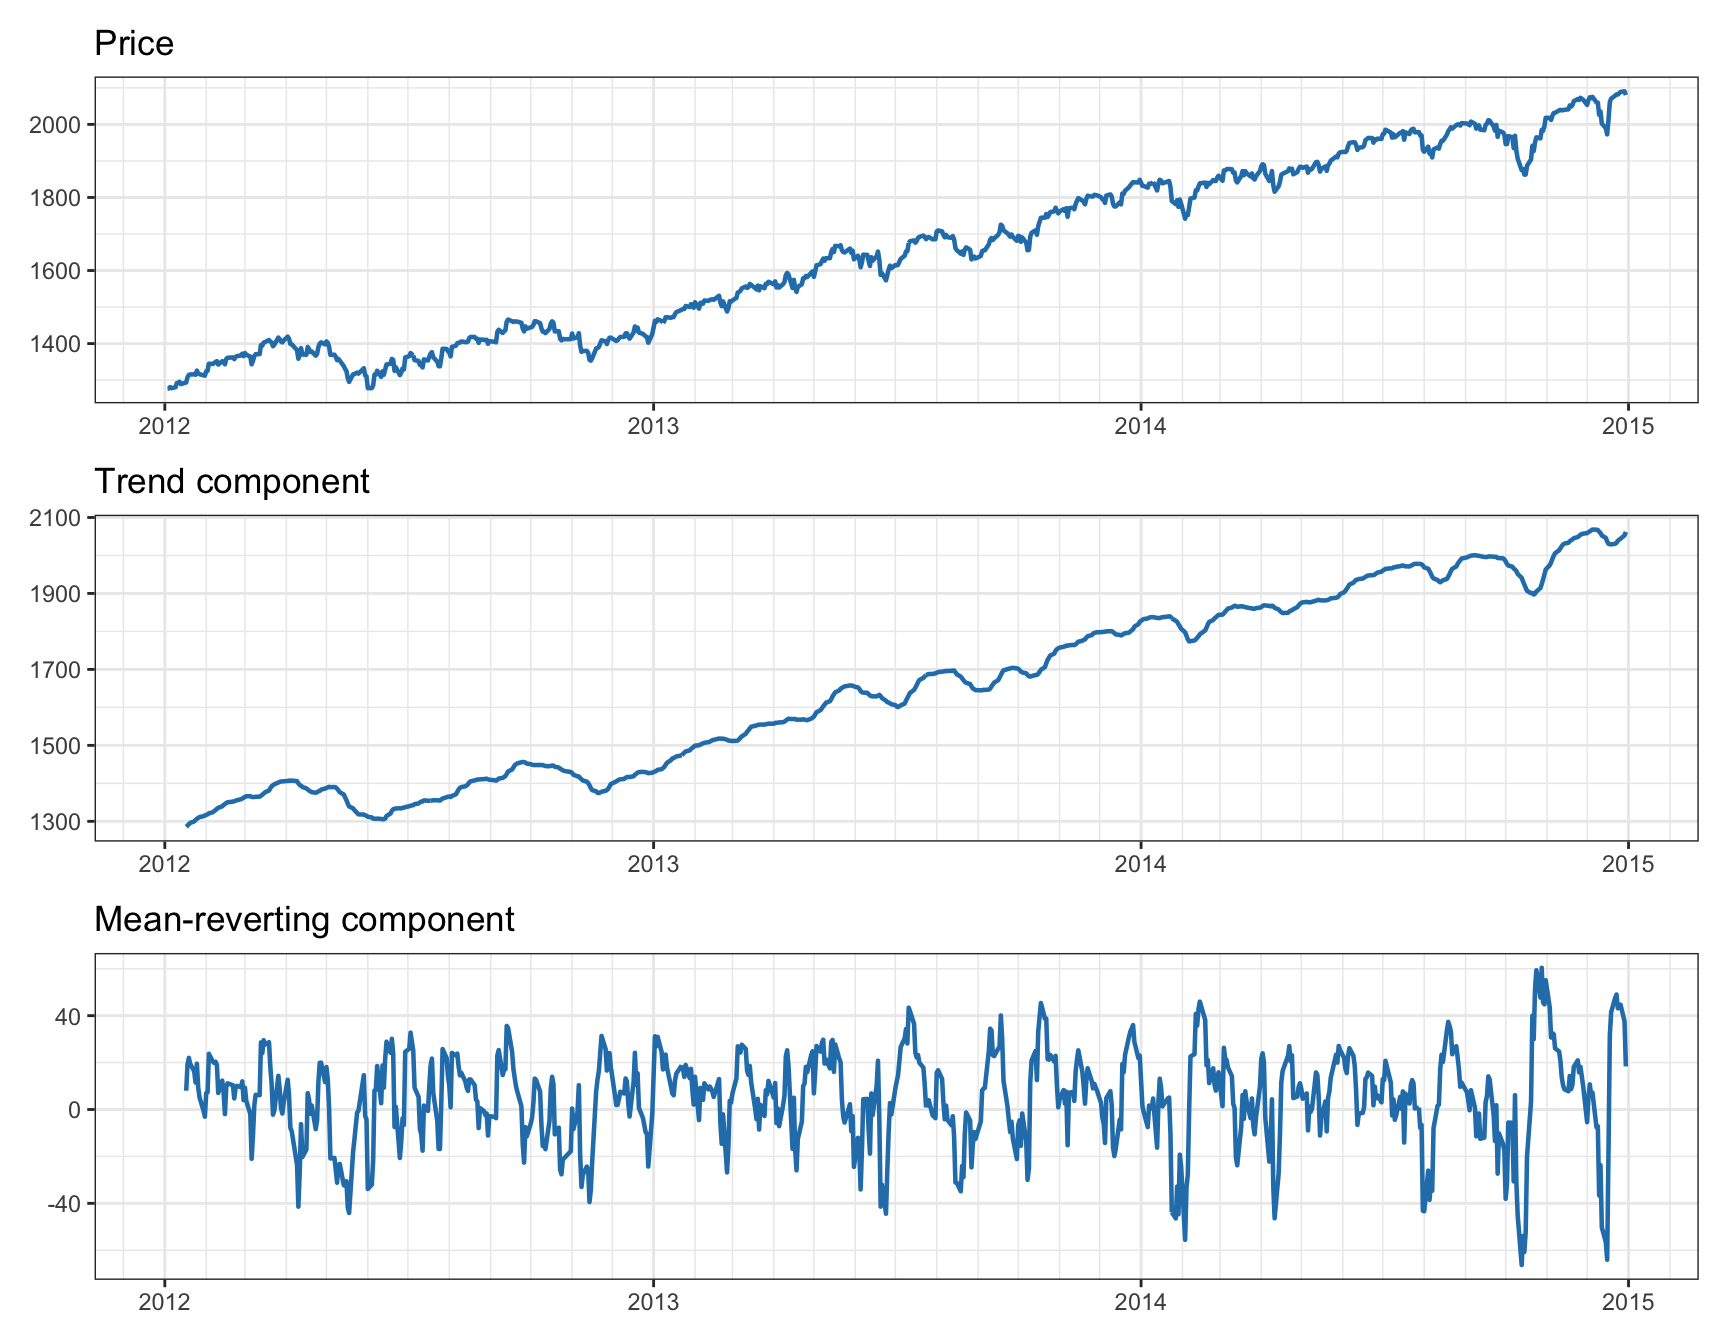
Figure 15.6: Decomposition of asset price into trend component and mean-reverting component.
15.3.1 Spread
The simplest implementation of pairs trading is based on comparing the spread of the two time series \(y_{1t}\) and \(y_{2t}\) to a threshold \(s_0\). Suppose that the spread \[ z_{t} = y_{1t} - \gamma \, y_{2t} \] is mean reverting with mean \(\mu\). Then, the idea is to either buy if the spread is low, \(z_t < \mu - s_0\), or short-sell if it is high, \(z_t > \mu + s_0\), and then unwind the position, for example, when it reverts back to the mean after \(k\) periods, leading to a difference of at least \(|z_{t+k} - z_{t}| \ge s_0\). Figure 15.7 illustrates this process of pairs trading by buying and short-selling the spread according based on the threshold \(s_0 = 1.5\).
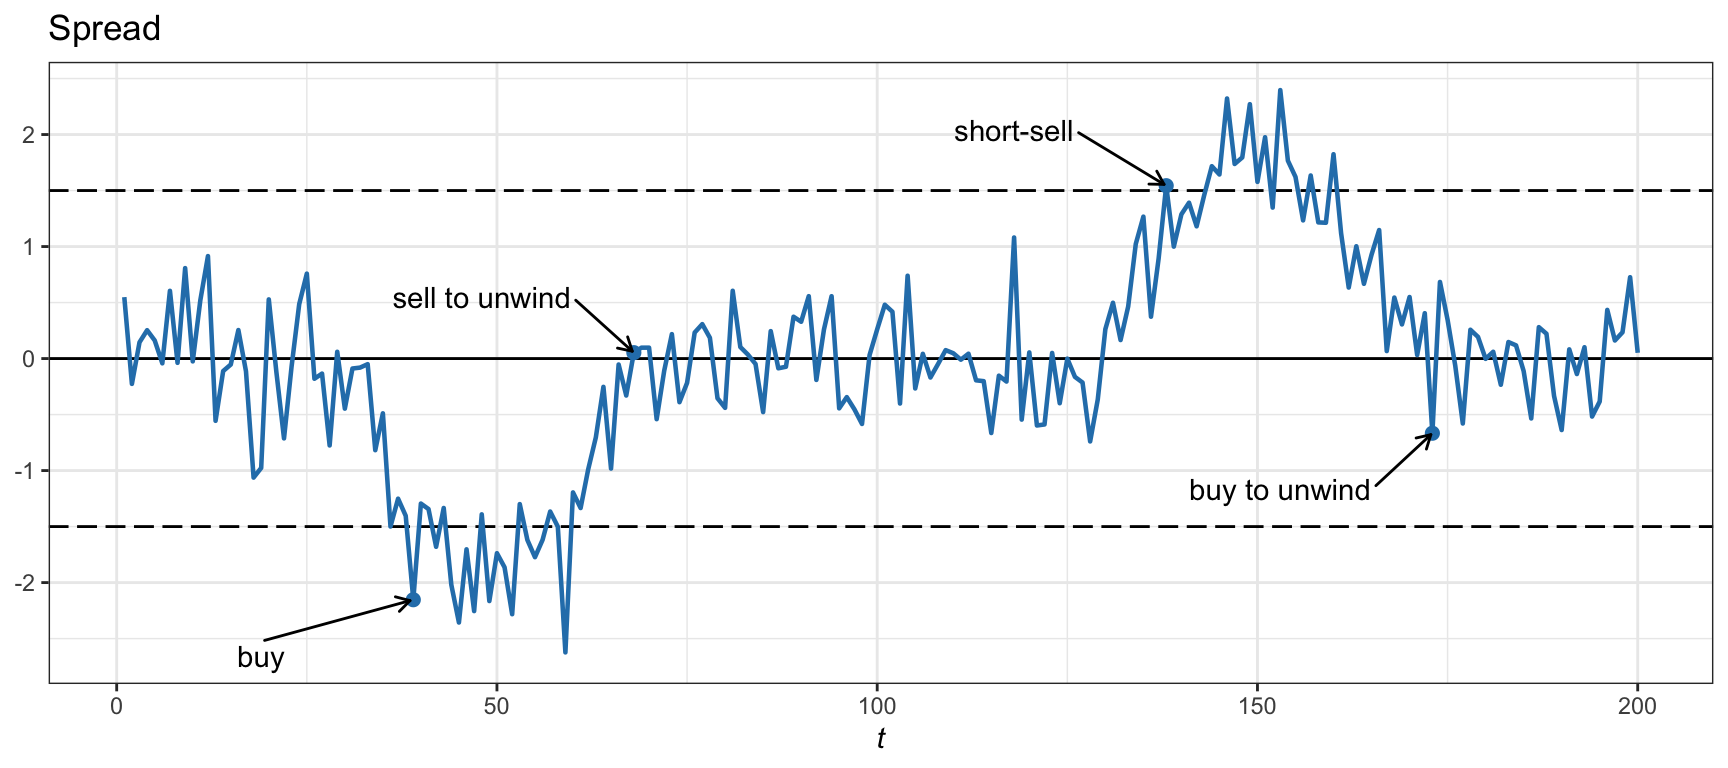
Figure 15.7: Illustration of pairs trading via thresholds on the spread.
15.3.2 Prices vs. Log-Prices
Pairs trading can be implemented in terms of prices or log-prices. This is determined by whether cointegration is exhibited by time series or prices or log-prices. The interpretation is slighly different as explained next.
Suppose first that \(y_{1t}\) and \(y_{2t}\) represent the prices of the two assets that define the mean-reverting spread \(z_{t} = y_{1t} - \gamma \, y_{2t}\). In this case, the coefficients used in the spread (1 and \(\gamma\)) represent number of shares (to be bought and sold) and the spread has a meaning of price value. Thus, the spread difference corresponds to the profit made during the \(k\) periods (ignoring transaction costs): \[ z_{t+k} - z_{t} = s_0. \]
Suppose now that \(y_{1t}\) and \(y_{2t}\) represent the log-prices of two assets. In this case, it is convenient to use the portfolio notation (see Chapter 6). Basically, we can define the two-asset portfolio \[ \w = \begin{bmatrix} \;\;\;1\\ -\gamma \end{bmatrix}, \] where now the coefficients 1 and \(\gamma\) represent normalized dollar values instead of shares, and the spread can be compactly written as \[ z_{t} = \w^\T\bm{y}_{t}, \] where \(\bm{y}_{t} = \begin{bmatrix} y_{1t}\\ y_{2t} \end{bmatrix}\). With this notation, it becomes evident that the spread difference corresponds (approximately) to the return made during the \(k\) periods (ignoring transaction costs): \[ \w^\T \left( \bm{y}_{t+k} - \bm{y}_{t} \right) = z_{t+k} - z_{t} = s_0. \]
Note that this is an approximation because the return of the portfolio should be calculated using the linear returns, \(\w^\T \left( \textm{exp}(\bm{y}_{t+k} - \bm{y}_{t}) - \bm{1} \right)\), instead of the log-returns; nevertheless, these two quantities are approximately equal because \(\textm{exp}(x) - 1 \approx x\) for small \(x\) (see Chapter 6 for details). Also, note that this portfolio has leverage \(1 + \gamma\), so in practice we may want to normalize it to unit leverage.
Summarizing, depending on whether the original cointegrated time series correspond to prices or log-prices, the threshold \(s_0\) will determine the absolute profit or the return of the trade over these \(k\) periods. The choice is dictated by the nature of the cointegration of the time series. It is important to remark that in the case of cointegrated log-prices, the portfolio \(\w\) has a meaning of normalized dollars, which may require a rebalancing over time (increased transaction costs); for cointegrated prices, the number of shares naturally stays constant over time and does not require rebalancing. This makes cointegrated price series more attractive; unfortunately, in practice, it is more difficult to find cointegrated price series since the noise in prices is less symmetric than that in log-prices, making the potential spreads less stationary.
15.3.3 Is Pairs Trading Profitable?
It is important to note that pairs trading relies on the assumption that the historical relationship between the two instruments will persist in the future. However, this is not always the case and cointegration between financial instruments can change over time due to various factors, such as market conditions, industry trends, or company-specific events. Therefore, pairs trading carries risks, and traders should carefully monitor the relationship between the instruments and use risk management techniques to protect their positions. Some publications show that pairs trading can provide profits (Avellaneda and Lee, 2010; Elliott et al., 2005; Gatev et al., 2006), while others indicate that cointegration relationships may not be preserved over time (Chan, 2013; Clegg, 2014).
The positive results should always be taken with a grain of salt for a number of reasons: backtests may ignore transaction costs, which can exceed the profit made trading the spread (Chan, 2008); strategies may have yielded profits in the past while their effectiveness may have diminished in more recent times (Chan, 2013); and the practical implementation entails certain technical difficulties, such as the potential lack of liquidity for short-selling, the danger of margin calls (being forced to liquidate positions during inopportune times), the need for higher-frequency trading due to the competition of other traders, and the decimalization of U.S. stock prices, which caused bid–ask spreads to dramatically narrow, affecting the spreads (Chan, 2013). Nevertheless, the proper use of Kalman filtering (covered in Section 15.6) and VECM modeling (overviewed in Section 15.7) can help remedy many of the shortcomings.
15.3.4 Design of Pairs Trading
We have covered the basic idea of pairs trading, which relies on cointegrated pairs. The rest of this chapter revolves around the design of pairs trading in detail. In a nutshell, the objective is to trade profitably a mean-reverting spread, which requires: (i) discovering cointegrated pairs (Section 15.4), from simple prescreening to more sophisticated statistical tests, and (ii) designing the trading strategy (Section 15.5), which basically boils down to the choice of the threshold \(s_0\) or other more sophisticated methods.
More advanced topics include the use of Kalman filtering for estimating a time-varying cointegration relationship (Section 15.6) and the extension of pairs trading to more than two assets (Section 15.7).