第 15 章 数据规整1
15.1 提问
假定这里有 A, B, C 和 D 四种植物每天生长的记录,
plant_height <- data.frame(
  Day = 1:5,
  A = c(0.7, 1.0, 1.5, 1.8, 2.2),
  B = c(0.5, 0.7, 0.9, 1.3, 1.8),
  C = c(0.3, 0.6, 1.0, 1.2, 2.2),
  D = c(0.4, 0.7, 1.2, 1.5, 3.2)
)


plant_height
## Day A B C D
## 1 1 0.7 0.5 0.3 0.4
## 2 2 1.0 0.7 0.6 0.7
## 3 3 1.5 0.9 1.0 1.2
## 4 4 1.8 1.3 1.2 1.5
## 5 5 2.2 1.8 2.2 3.2大家想想,
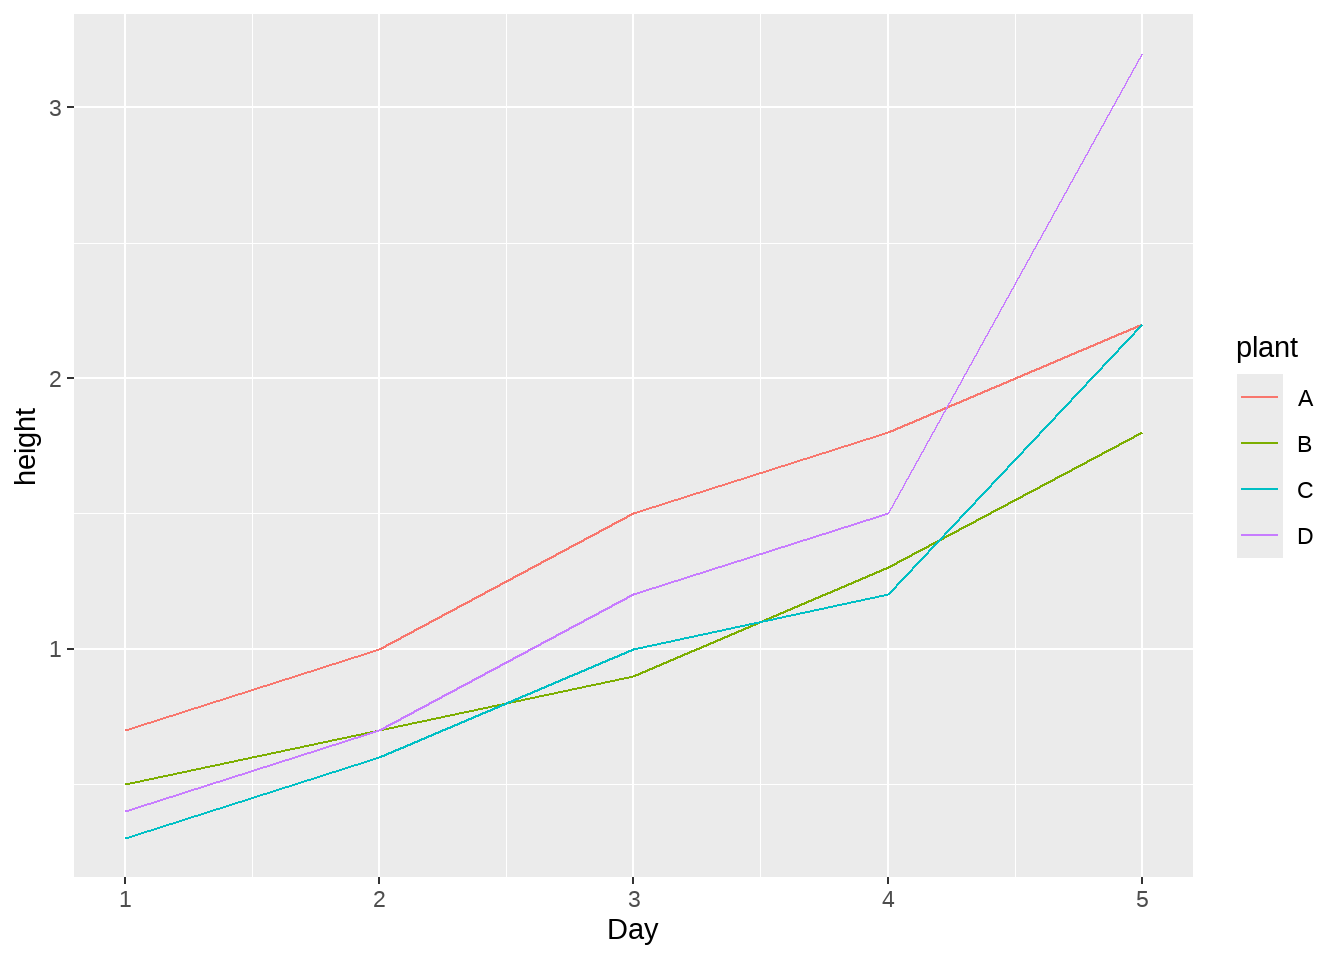
- 把植物高度大于或等于0.8cm的时刻筛选出来,怎么写语句?
- 用不同的颜色画出四种植物生长曲线,怎么写语句?
很显然,我们用第 12 章数据处理和第 14 章数据可视化的技术,可以写成这样
然而,发现遇到了问题?数据的格式与我们期望的不一样!
怎么解决呢?想用上面的语句,数据就得变形。那么怎么变形呢?
下面任意一种都行:
melted <- gather(plant_height, variable, value, 2:3)

## Column names instead of indices
melted <- gather(plant_height, variable, value, A, B)

## Excluding instead of including
melted <- gather(plant_height, variable, value, -1)

## Excluding using column name
melted <- gather(plant_height, variable, value, -Day)但我更推荐大家使用tidyr::pivot_longer(), 这是2019年9月份,tidyr 1.0.0新增的一组函数pivot_longer()/pivot_wider(),用来补充和完善原来的gather()/spread()
-
gather()/pivot_longer宽表格变成长表格 -
spread()/pivot_wider长表格变成宽表格
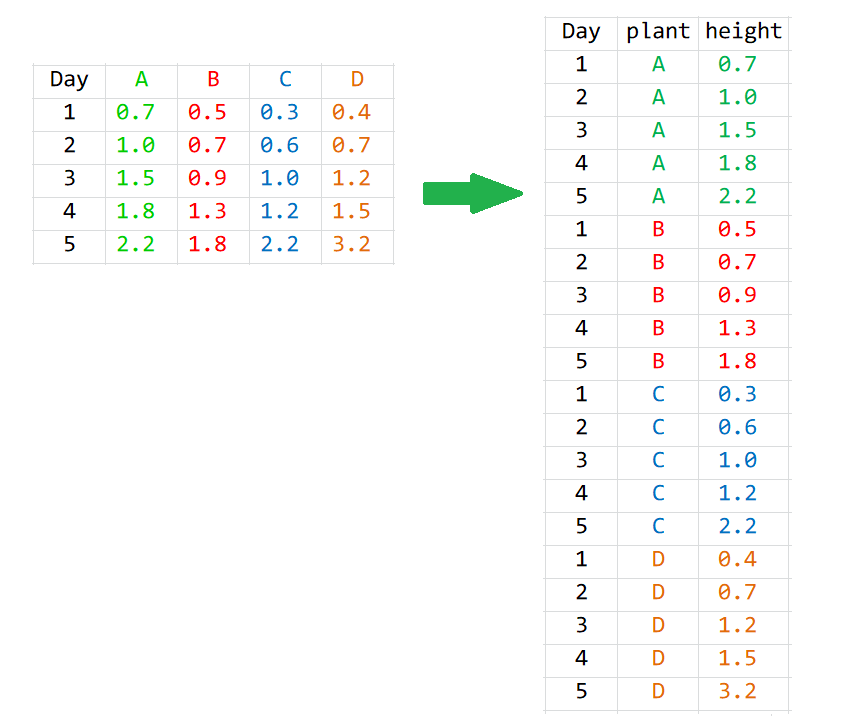
15.2 宽表格变成长表格
所以现在使用pivot_longer()函数
long <- plant_height %>%
  pivot_longer(
    cols = A:D,
    names_to = "plant",
    values_to = "height"
  )
long
## # A tibble: 20 × 3
## Day plant height
## <int> <chr> <dbl>
## 1 1 A 0.7
## 2 1 B 0.5
## 3 1 C 0.3
## 4 1 D 0.4
## 5 2 A 1
## 6 2 B 0.7
## 7 2 C 0.6
## 8 2 D 0.7
## 9 3 A 1.5
## 10 3 B 0.9
## 11 3 C 1
## 12 3 D 1.2
## 13 4 A 1.8
## 14 4 B 1.3
## 15 4 C 1.2
## 16 4 D 1.5
## 17 5 A 2.2
## 18 5 B 1.8
## 19 5 C 2.2
## 20 5 D 3.2这里pivot_longer()函数有三个主要的参数:
- 参数
cols,表示哪些列需要转换. - 参数
names_to,表示cols选取的这些列的名字,构成了新的一列,这里需要取一个名字. - 参数
values_to, 表示cols选取的这些列的值,构成了新的一列,这里也需要取一个名字. - 数据框总的信息量不会丢失
当然,参数cols 的写法可以多种形式的,具体见第 39 章select()函数.
plant_height %>%
  pivot_longer(
  cols = -Day,         # A:D or c(A, B, C, D) or c("A", "B", "C", "D")
  names_to = "plant",
  values_to = "height"
)
画图的问题也就解决了
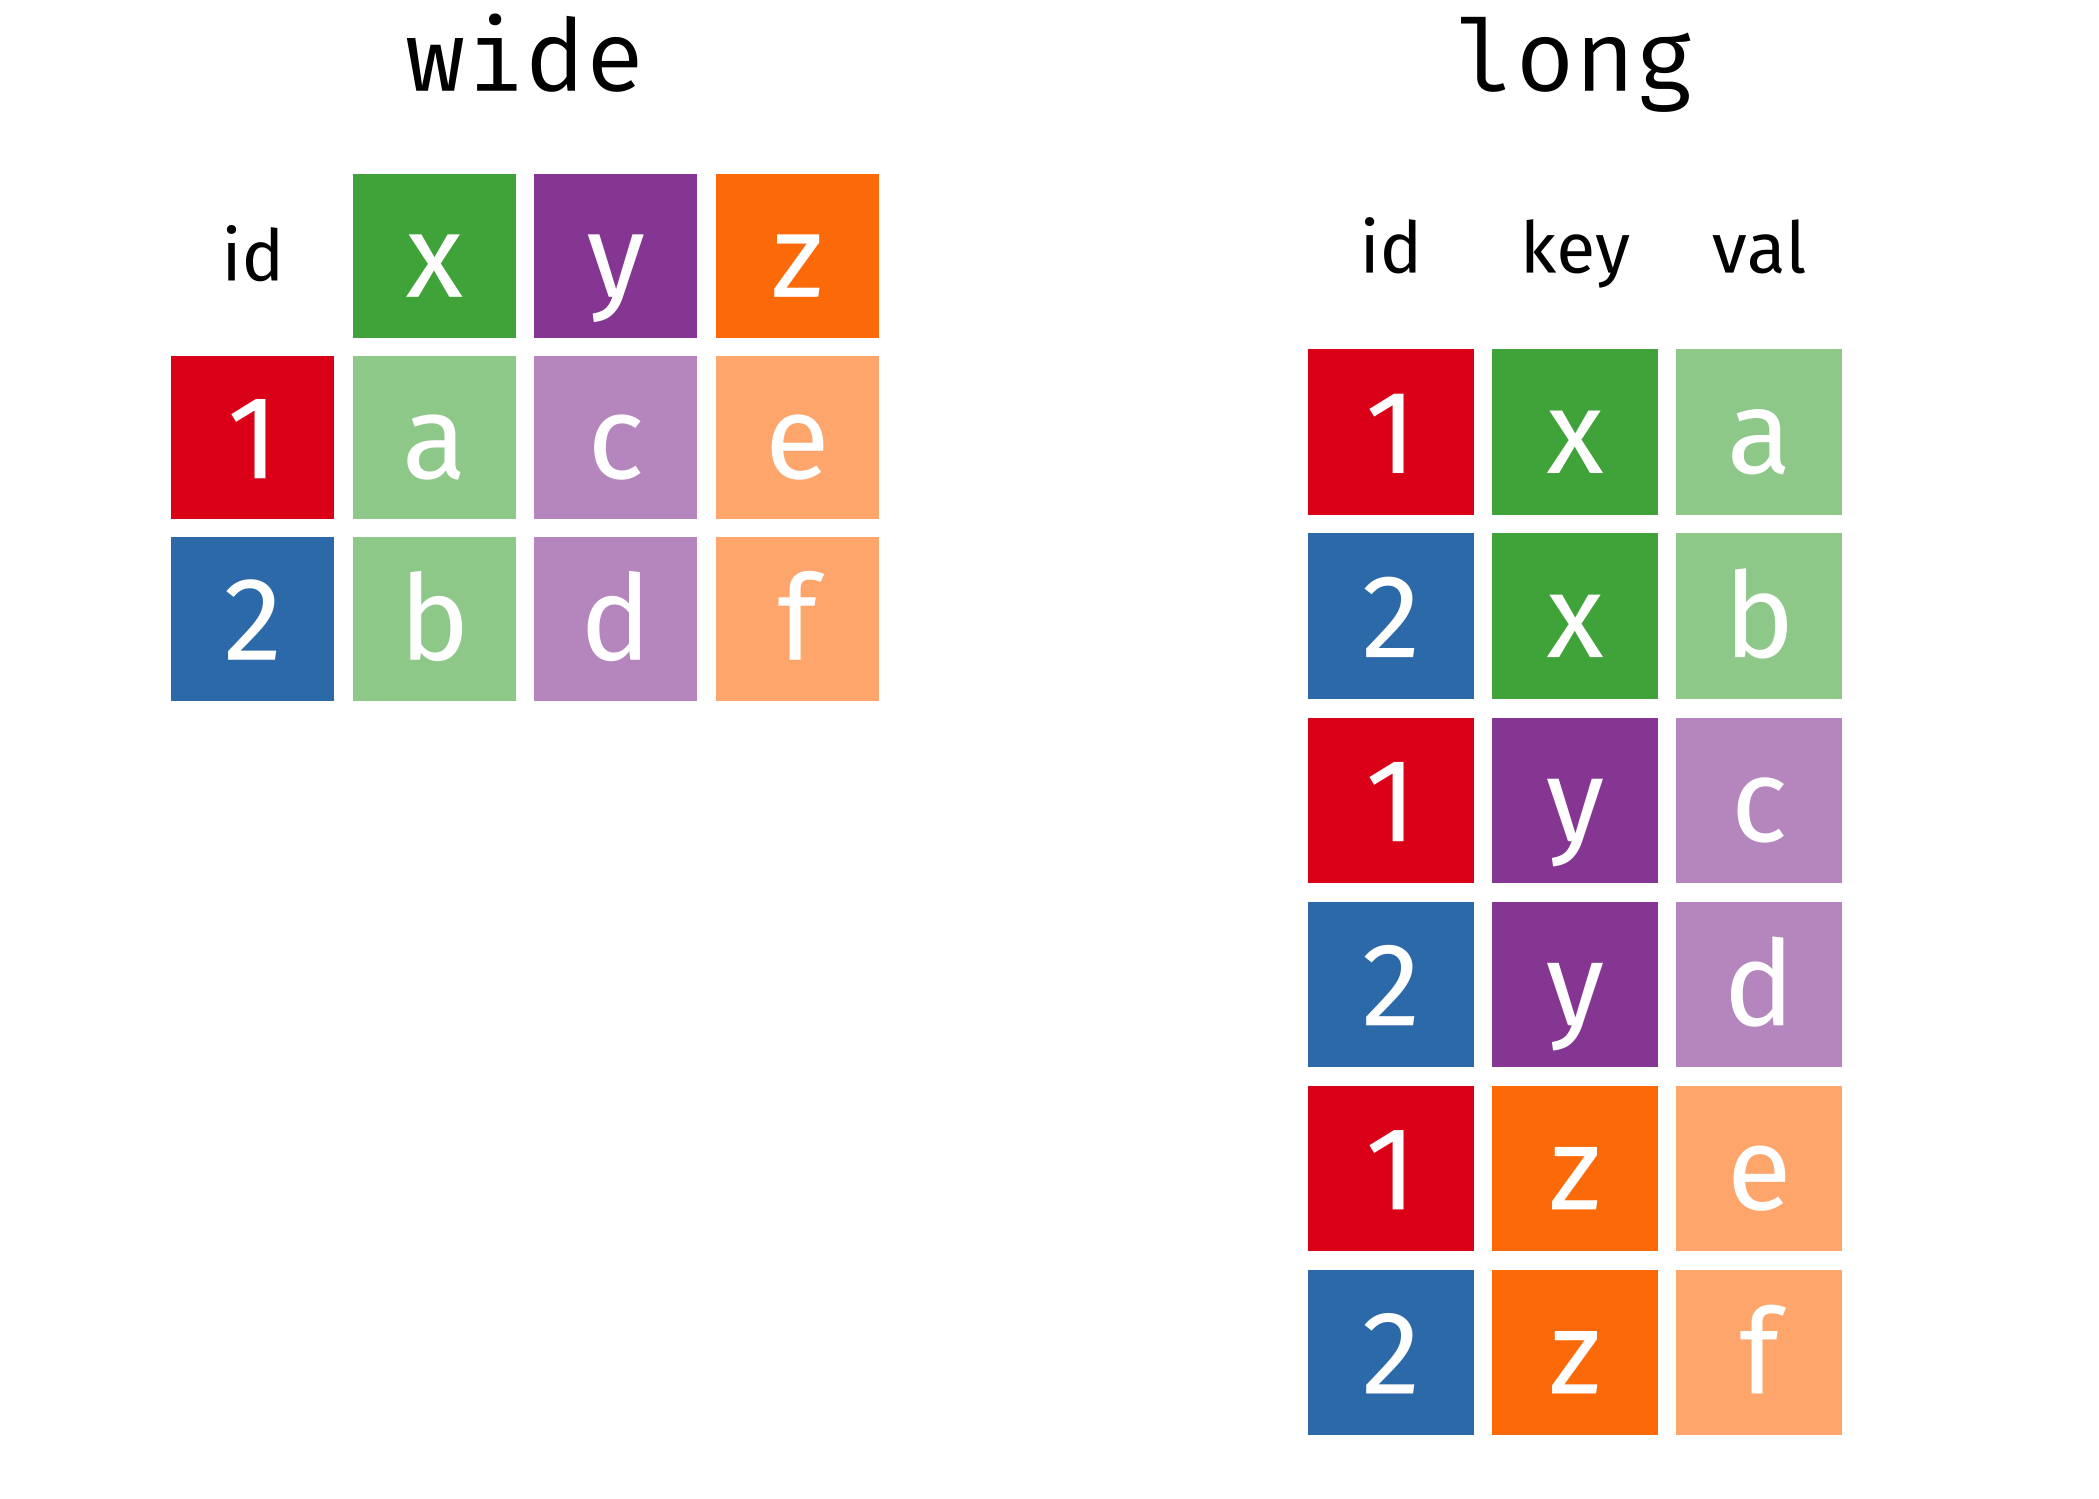
15.3 长表格变成宽表格
如果,长表格变回宽表格呢?需要用到pivot_wider()
wide <- long %>%
  pivot_wider(
  names_from = "plant",
  values_from = "height"
)
wide
## # A tibble: 5 × 5
## Day A B C D
## <int> <dbl> <dbl> <dbl> <dbl>
## 1 1 0.7 0.5 0.3 0.4
## 2 2 1 0.7 0.6 0.7
## 3 3 1.5 0.9 1 1.2
## 4 4 1.8 1.3 1.2 1.5
## 5 5 2.2 1.8 2.2 3.215.4 列名转换成多个变量
假定 A, B, C 三种植物每天生长的记录,包括三个特征(height, width, depth)
plant_record <- data.frame(
         day = c(1L, 2L, 3L, 4L, 5L),
    A_height = c(1.1, 1.2, 1.3, 1.4, 1.5),
     A_width = c(2.1, 2.2, 2.3, 2.4, 2.5),
     A_depth = c(3.1, 3.2, 3.3, 3.4, 3.5),
    B_height = c(4.1, 4.2, 4.3, 4.4, 4.5),
     B_width = c(5.1, 5.2, 5.3, 5.4, 5.5),
     B_depth = c(6.1, 6.2, 6.3, 6.4, 6.5),
    C_height = c(7.1, 7.2, 7.3, 7.4, 7.5),
     C_width = c(8.1, 8.2, 8.3, 8.4, 8.5),
     C_depth = c(9.1, 9.2, 9.3, 9.4, 9.5)
)
plant_record %>%
knitr::kable()| day | A_height | A_width | A_depth | B_height | B_width | B_depth | C_height | C_width | C_depth |
|---|---|---|---|---|---|---|---|---|---|
| 1 | 1.1 | 2.1 | 3.1 | 4.1 | 5.1 | 6.1 | 7.1 | 8.1 | 9.1 |
| 2 | 1.2 | 2.2 | 3.2 | 4.2 | 5.2 | 6.2 | 7.2 | 8.2 | 9.2 |
| 3 | 1.3 | 2.3 | 3.3 | 4.3 | 5.3 | 6.3 | 7.3 | 8.3 | 9.3 |
| 4 | 1.4 | 2.4 | 3.4 | 4.4 | 5.4 | 6.4 | 7.4 | 8.4 | 9.4 |
| 5 | 1.5 | 2.5 | 3.5 | 4.5 | 5.5 | 6.5 | 7.5 | 8.5 | 9.5 |
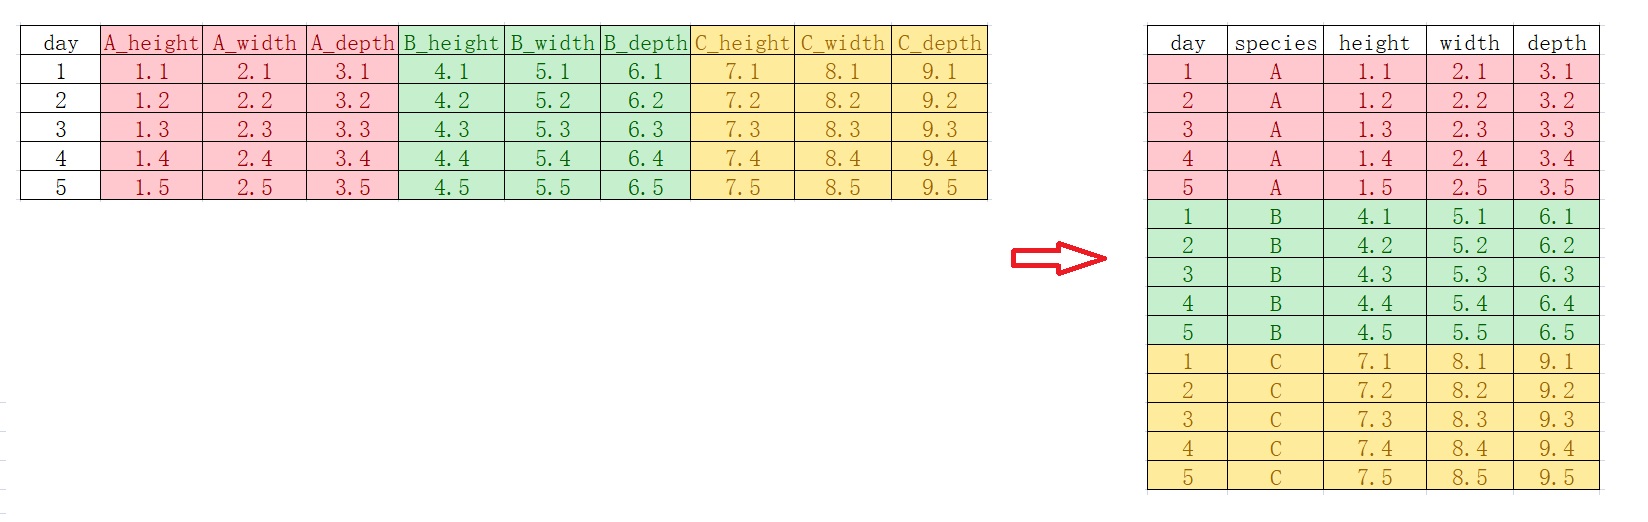
我们想原始数据框的列名,转换成多个变量,比如A,B,C成为物种(species)变量,(height, width, depth)成为parameter变量
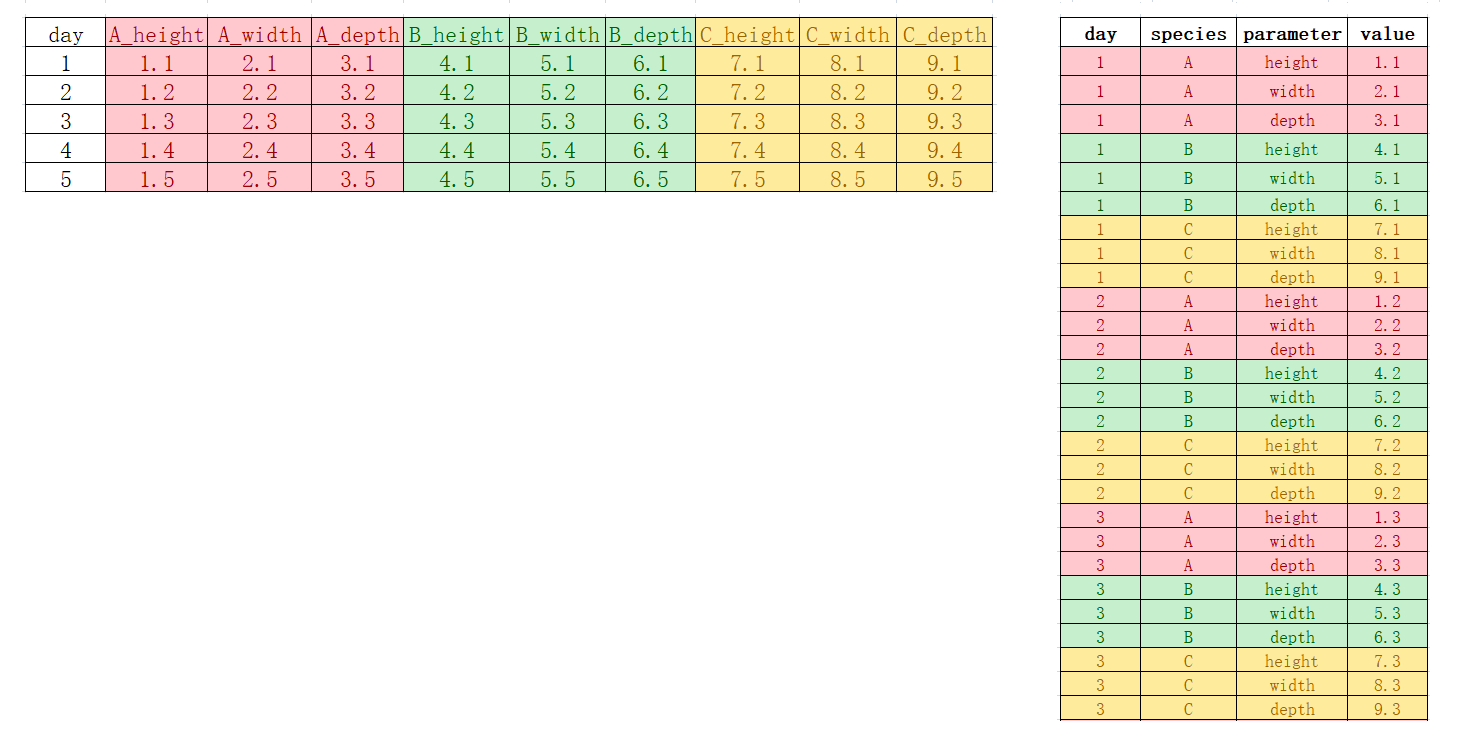
用pivot_longer()函数,
plant_record %>%
  tidyr::pivot_longer(
    cols = !day,
    names_to = c("species", "parameter"),
    names_pattern = "(.*)_(.*)",
    values_to = "value"
)
## # A tibble: 45 × 4
## day species parameter value
## <int> <chr> <chr> <dbl>
## 1 1 A height 1.1
## 2 1 A width 2.1
## 3 1 A depth 3.1
## 4 1 B height 4.1
## 5 1 B width 5.1
## 6 1 B depth 6.1
## 7 1 C height 7.1
## 8 1 C width 8.1
## 9 1 C depth 9.1
## 10 2 A height 1.2
## # ℹ 35 more rows15.5 复杂的情形
我们希望原始数据框的列名中,一部分进入变量,一部分保持原来的列名,比如,
plant_record_longer <- plant_record %>%
  tidyr::pivot_longer(
   cols = !day,
   names_to = c("species", ".value"),
   names_pattern = "(.*)_(.*)"
)
plant_record_longer
## # A tibble: 15 × 5
## day species height width depth
## <int> <chr> <dbl> <dbl> <dbl>
## 1 1 A 1.1 2.1 3.1
## 2 1 B 4.1 5.1 6.1
## 3 1 C 7.1 8.1 9.1
## 4 2 A 1.2 2.2 3.2
## 5 2 B 4.2 5.2 6.2
## 6 2 C 7.2 8.2 9.2
## 7 3 A 1.3 2.3 3.3
## 8 3 B 4.3 5.3 6.3
## 9 3 C 7.3 8.3 9.3
## 10 4 A 1.4 2.4 3.4
## 11 4 B 4.4 5.4 6.4
## 12 4 C 7.4 8.4 9.4
## 13 5 A 1.5 2.5 3.5
## 14 5 B 4.5 5.5 6.5
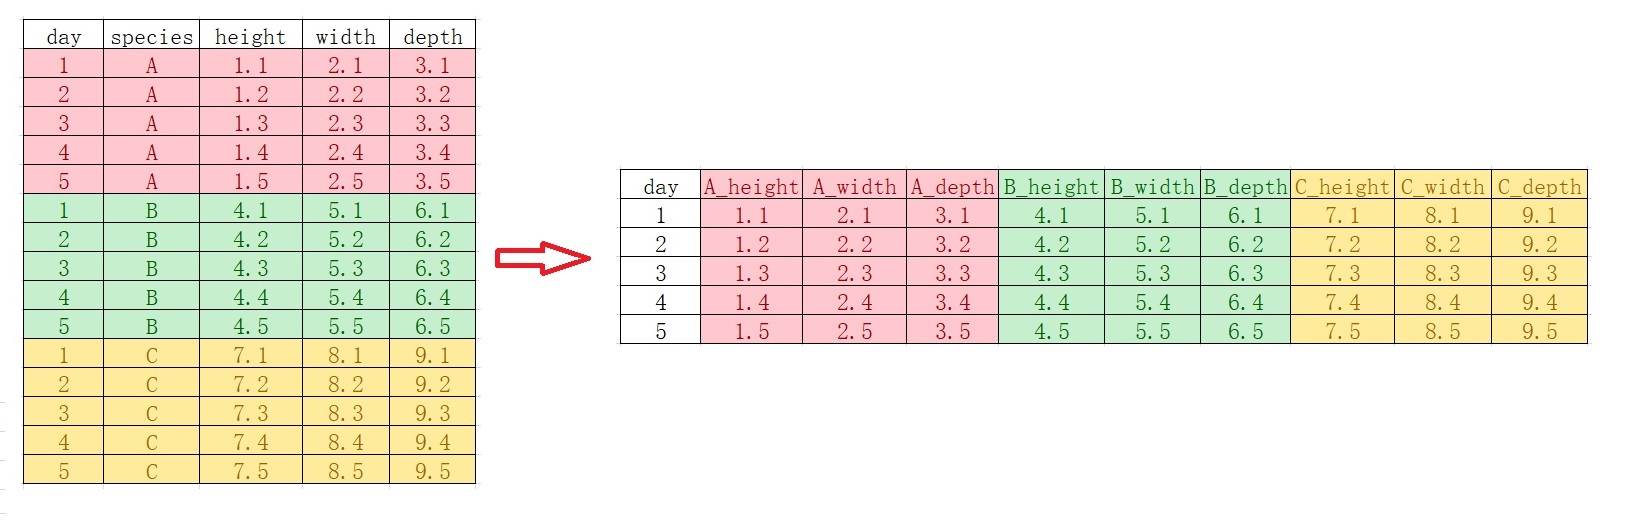
## 15 5 C 7.5 8.5 9.5如果,反过来,又该怎么弄呢?
us_rent_income %>%
  pivot_wider(
    names_from = variable,
    names_glue = "{variable}_{.value}",
    values_from = c(estimate, moe)
  )
plant_record_longer %>%
  tidyr::pivot_wider(
    names_from = species,
    values_from = c(height, width, depth),
    names_glue = "{species}_{.value}"
  )
## # A tibble: 5 × 10
## day A_height B_height C_height A_width B_width C_width A_depth B_depth
## <int> <dbl> <dbl> <dbl> <dbl> <dbl> <dbl> <dbl> <dbl>
## 1 1 1.1 4.1 7.1 2.1 5.1 8.1 3.1 6.1
## 2 2 1.2 4.2 7.2 2.2 5.2 8.2 3.2 6.2
## 3 3 1.3 4.3 7.3 2.3 5.3 8.3 3.3 6.3
## 4 4 1.4 4.4 7.4 2.4 5.4 8.4 3.4 6.4
## 5 5 1.5 4.5 7.5 2.5 5.5 8.5 3.5 6.5
## # ℹ 1 more variable: C_depth <dbl>
看明白.value它代表的意思了吗?
- 注意 .value 而不是value,说明这里不是单个列名,而是匹配得到的多个值做列名
15.6 tidy data原则
Hadley Wickhamt提出了数据科学tidy原则,我结合自己的理解,tidy思想体现在:
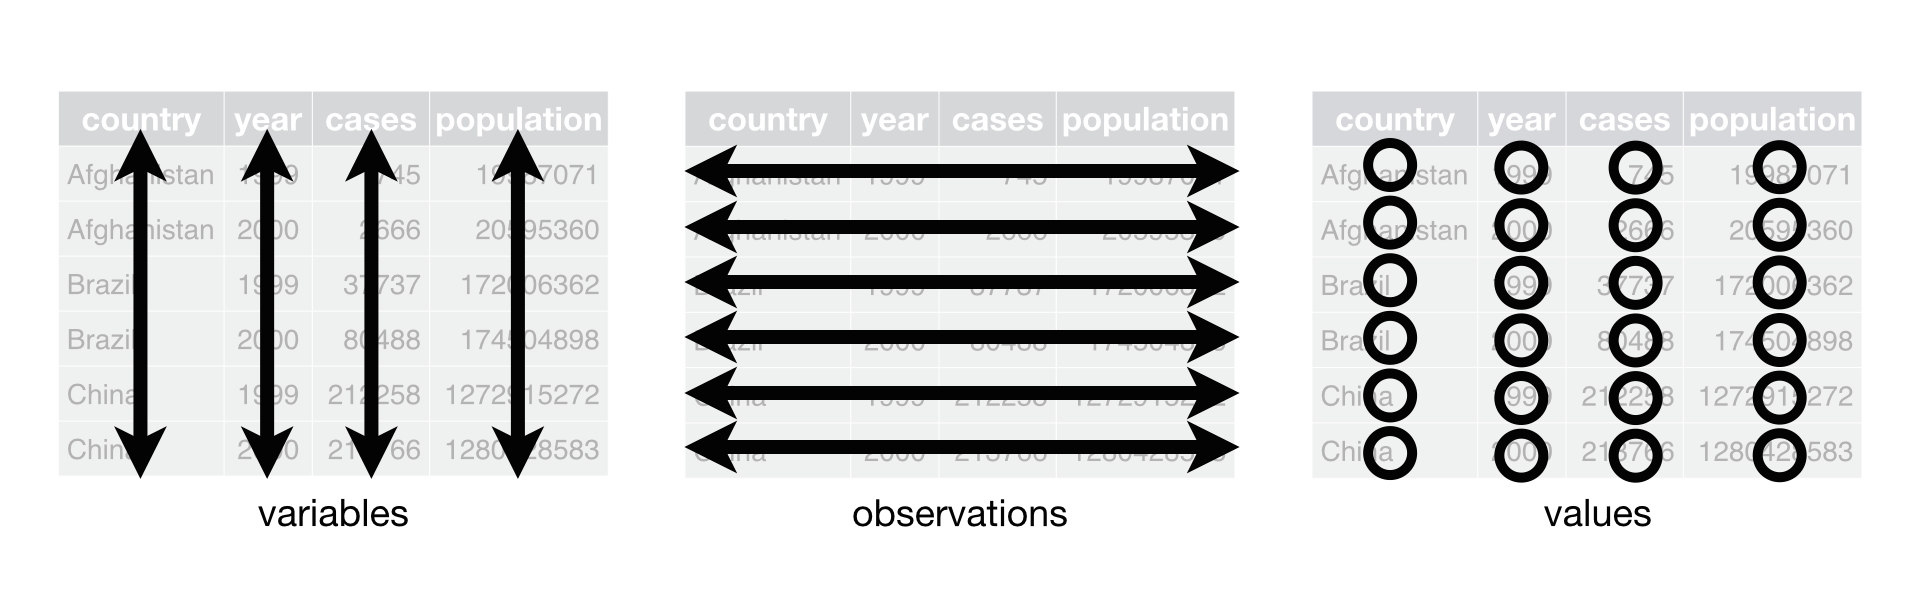
- 一切都是数据框,任何数据都可以规整
- 数据框的一列代表一个变量,数据框的一行代表一次观察
- 函数处理数据时,数据框进数据框出(函数的第一个参数始终为数据框)
根据Hadley Wickham的思想,这里的宽表格(plant_heigt和 wide)不是tidy的,只有长表格(long)才是tidy的,
long## # A tibble: 20 × 3
## Day plant height
## <int> <chr> <dbl>
## 1 1 A 0.7
## 2 1 B 0.5
## 3 1 C 0.3
## 4 1 D 0.4
## 5 2 A 1
## 6 2 B 0.7
## 7 2 C 0.6
## 8 2 D 0.7
## 9 3 A 1.5
## 10 3 B 0.9
## 11 3 C 1
## 12 3 D 1.2
## 13 4 A 1.8
## 14 4 B 1.3
## 15 4 C 1.2
## 16 4 D 1.5
## 17 5 A 2.2
## 18 5 B 1.8
## 19 5 C 2.2
## 20 5 D 3.2以后,我们会意识到tidyverse中的很多函数都喜欢tidy的(尤其是ggplot2时)!