第 93 章 地理数据处理
获取世界地图数据
world_map_data <- ne_countries(scale = "medium", returnclass = "sf")

ggplot(data = world_map_data) +
    geom_sf()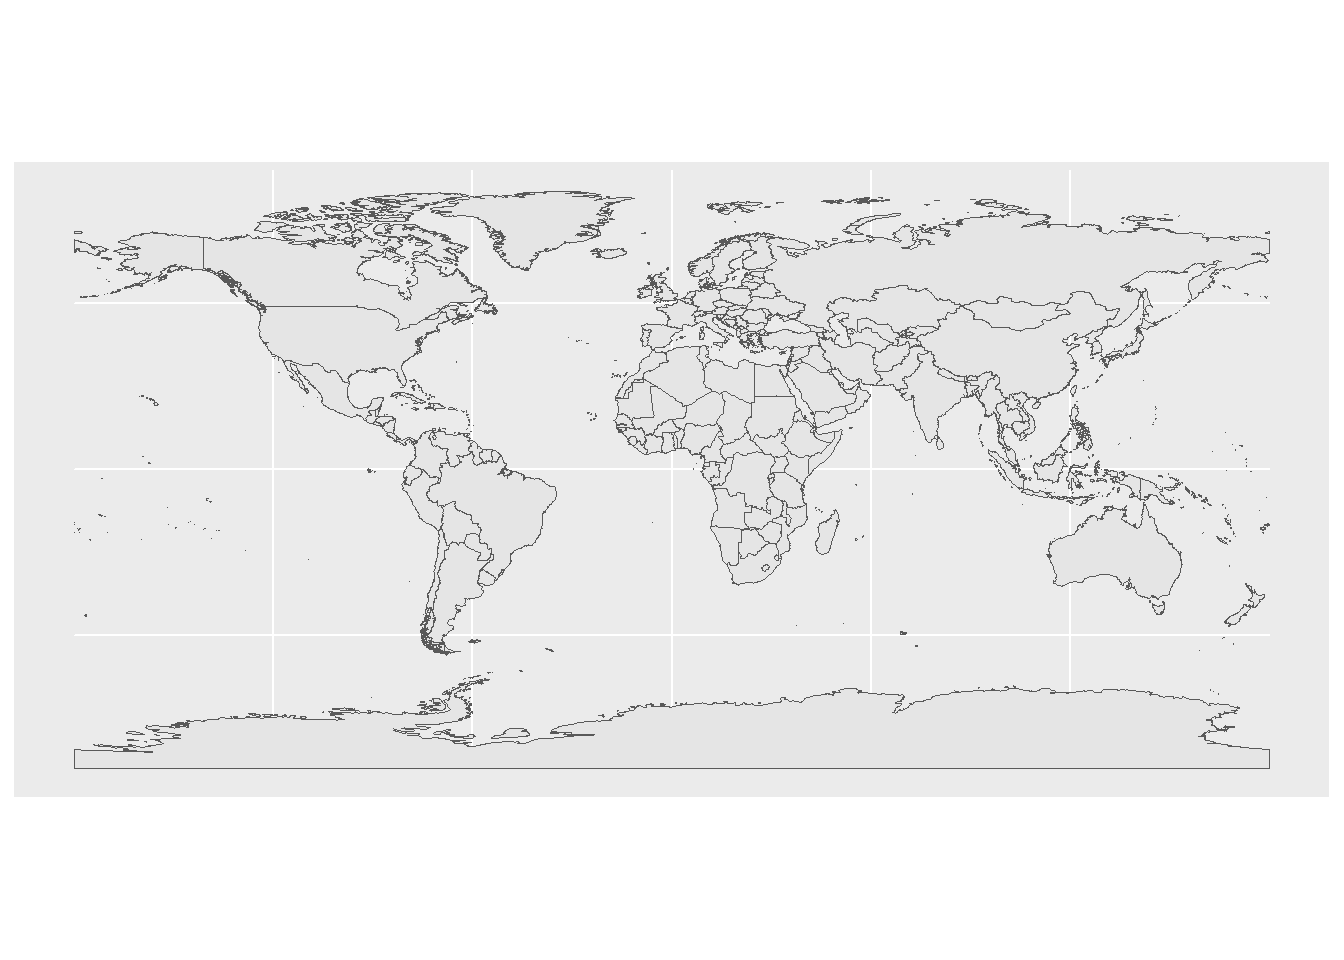
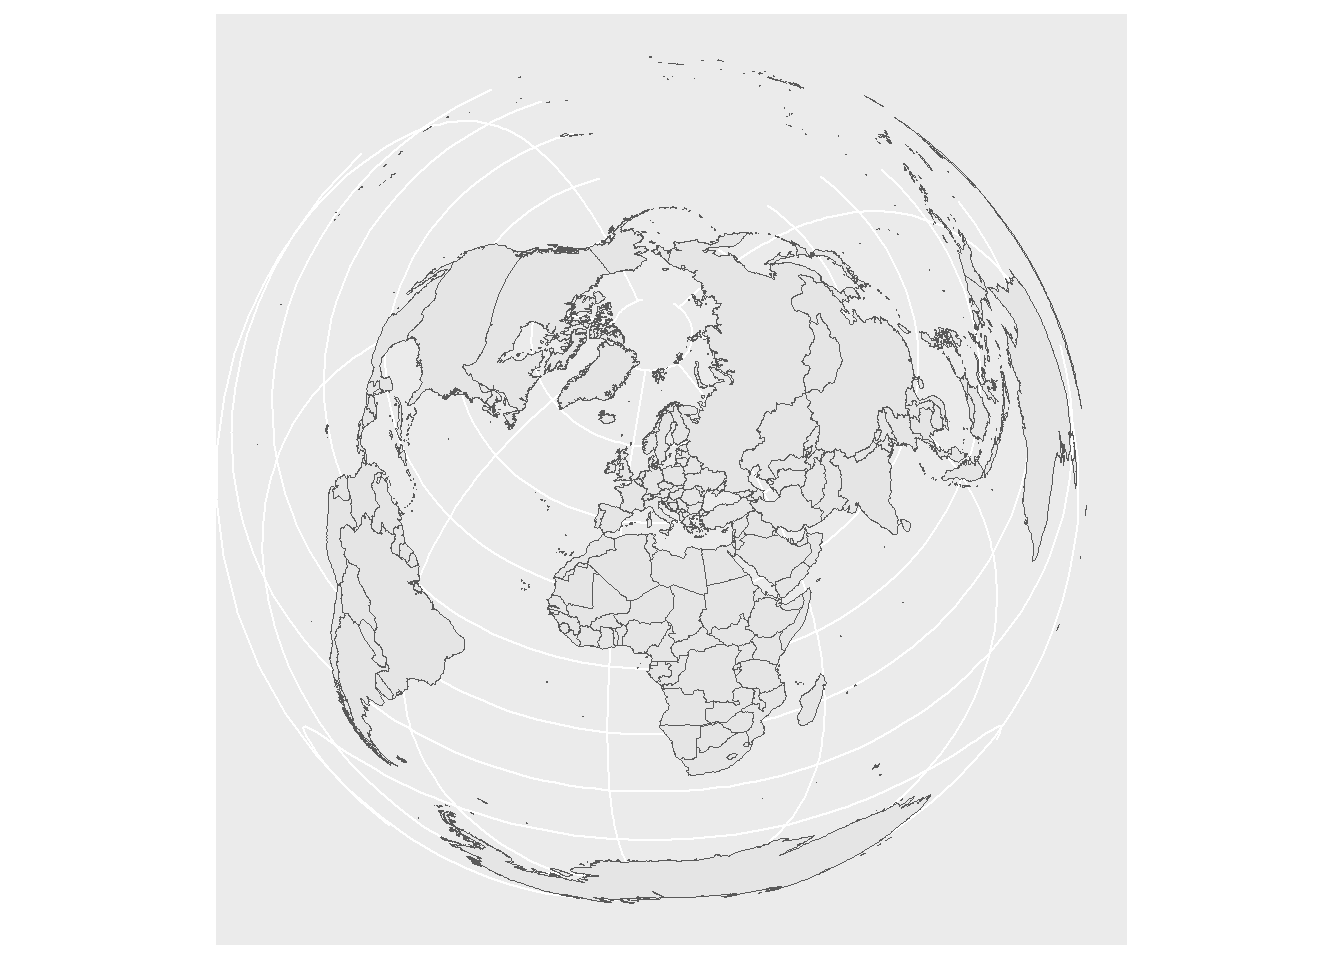
使用不同的坐标系统
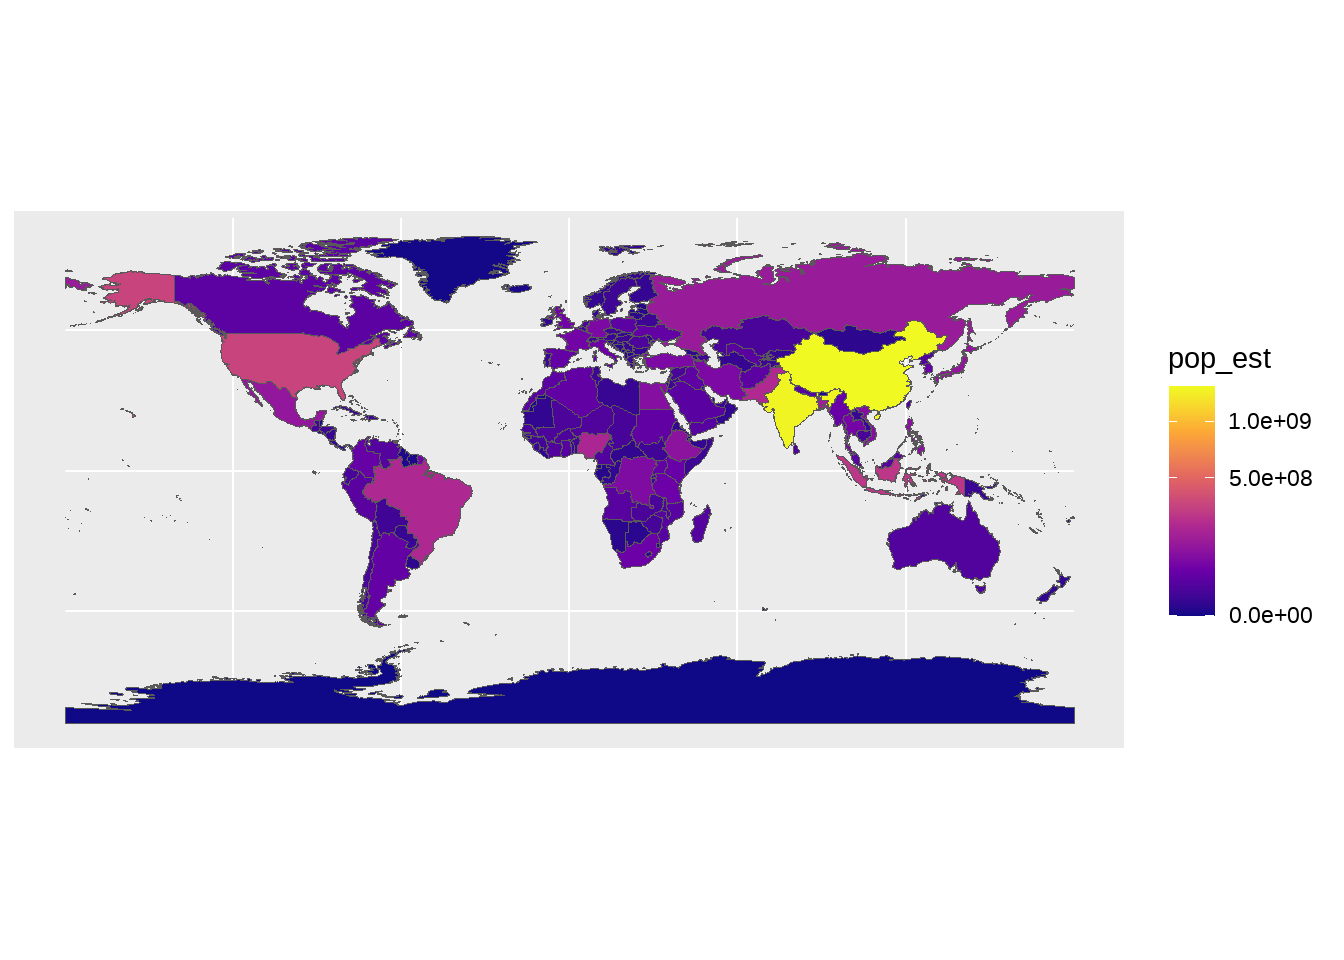
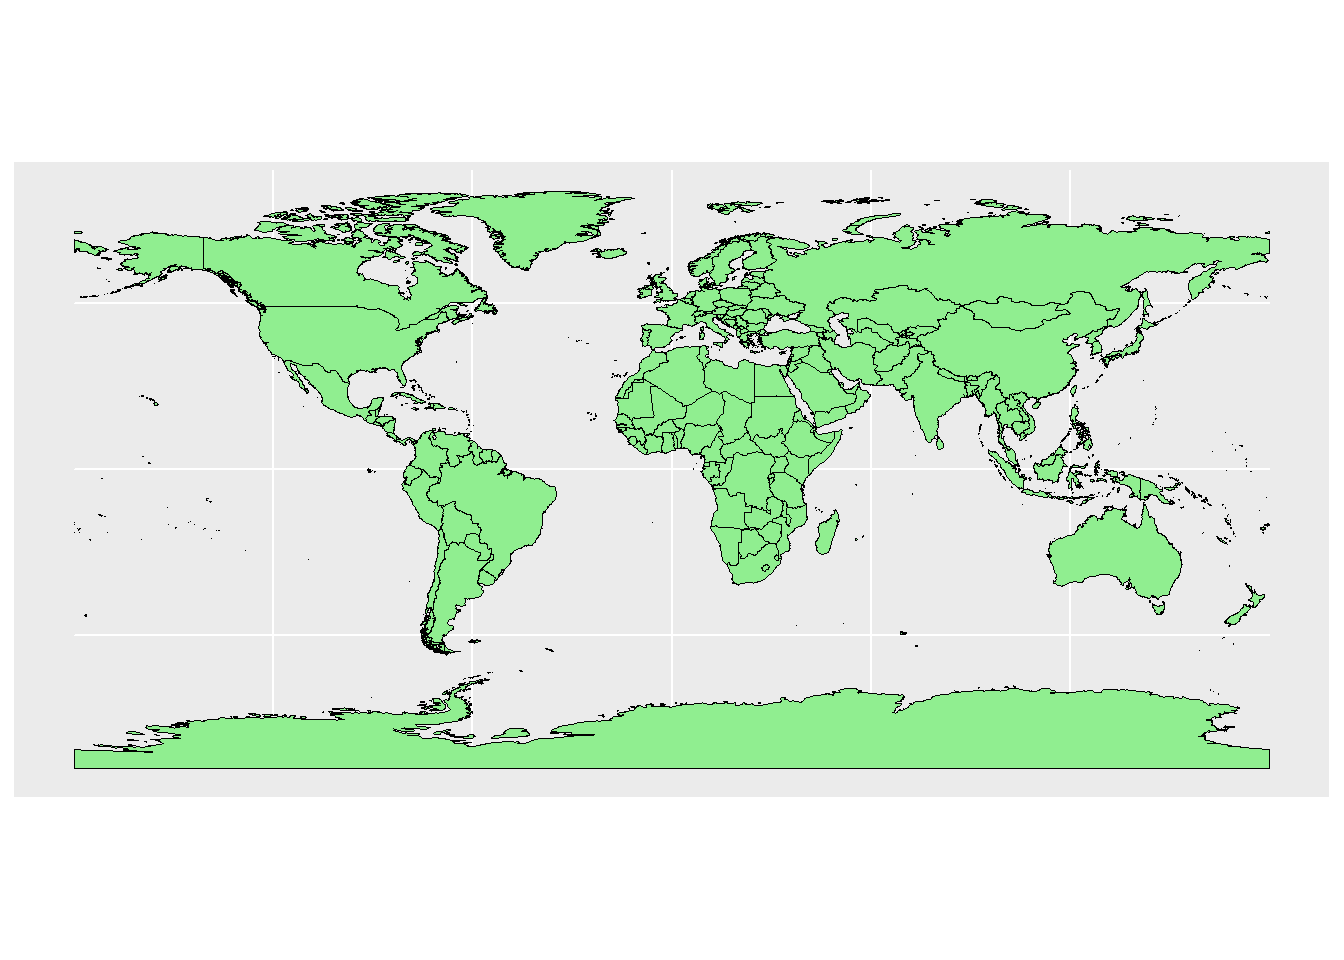
上色
ggplot(data = world_map_data) +
    geom_sf(aes(fill = pop_est)) +
    scale_fill_viridis_c(option = "plasma", trans = "sqrt")