第 87 章 探索性数据分析-哺乳动物脑量与体重的关系
我在网上看到这张图
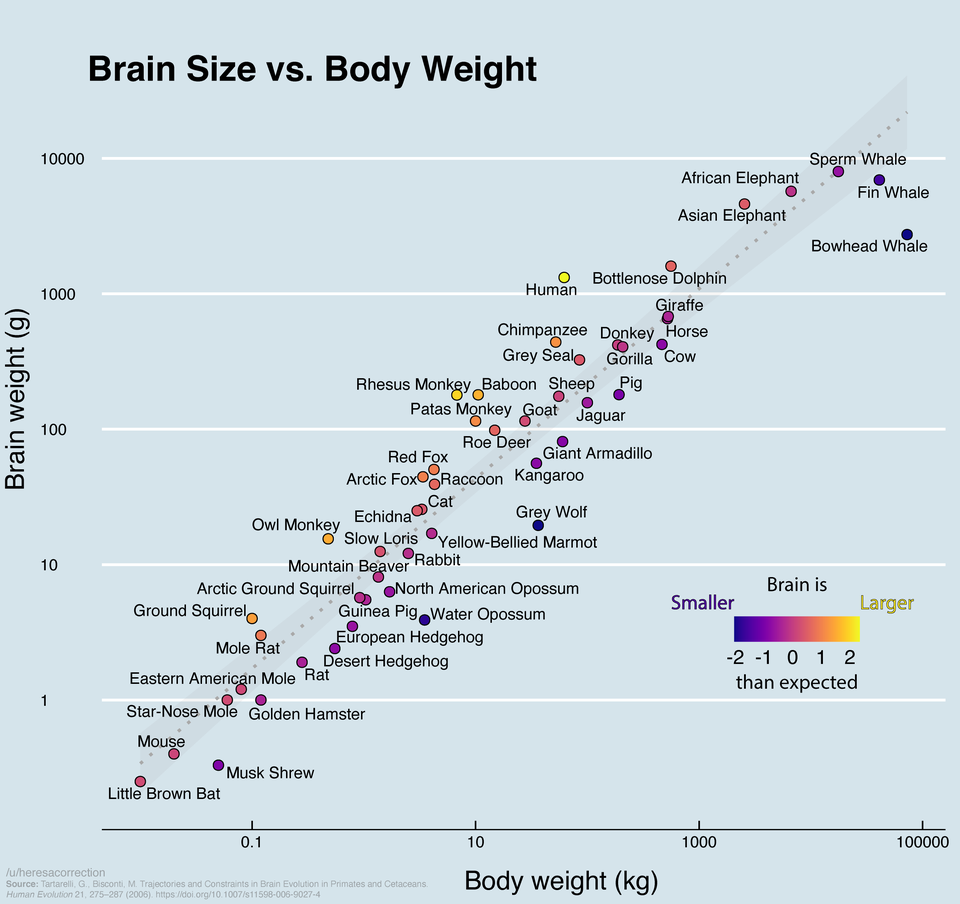
找到数据来源是一篇文章,我下载了数据,希望能重复这张图。
87.1 读取数据
library(tidyverse)

data <- readr::read_rds("./demo_data/brain_size.rds") %>%
   janitor::clean_names()
data
## # A tibble: 70 × 3
## species body_weight_kg brain_weight_g
## <chr> <dbl> <dbl>
## 1 Arctic fox 3.38 44.5
## 2 Owl monkey 0.48 15.5
## 3 Mountain beaver 1.35 8.1
## 4 Cow 465 423
## 5 Grey wolf 36.3 19.5
## 6 Goat 27.7 115
## 7 Roe deer 14.8 98.2
## 8 Guinea pig 1.04 5.5
## 9 Vervet 4.19 58
## 10 Chinchilla 0.43 6.4
## # ℹ 60 more rows87.2 数据变换
tb <- data %>%
  filter(body_weight_kg > 0, brain_weight_g > 0) %>%
  mutate(
    across(where(is.numeric), log10)
  )
tb
## # A tibble: 69 × 3
## species body_weight_kg brain_weight_g
## <chr> <dbl> <dbl>
## 1 Arctic fox 0.529 1.65
## 2 Owl monkey -0.319 1.19
## 3 Mountain beaver 0.130 0.908
## 4 Cow 2.67 2.63
## 5 Grey wolf 1.56 1.29
## 6 Goat 1.44 2.06
## 7 Roe deer 1.17 1.99
## 8 Guinea pig 0.0170 0.740
## 9 Vervet 0.622 1.76
## 10 Chinchilla -0.367 0.806
## # ℹ 59 more rows87.3 线性模型
m <- lm(brain_weight_g ~ body_weight_kg, data = tb)

df <- tb %>% modelr::add_residuals(m)
87.4 可视化
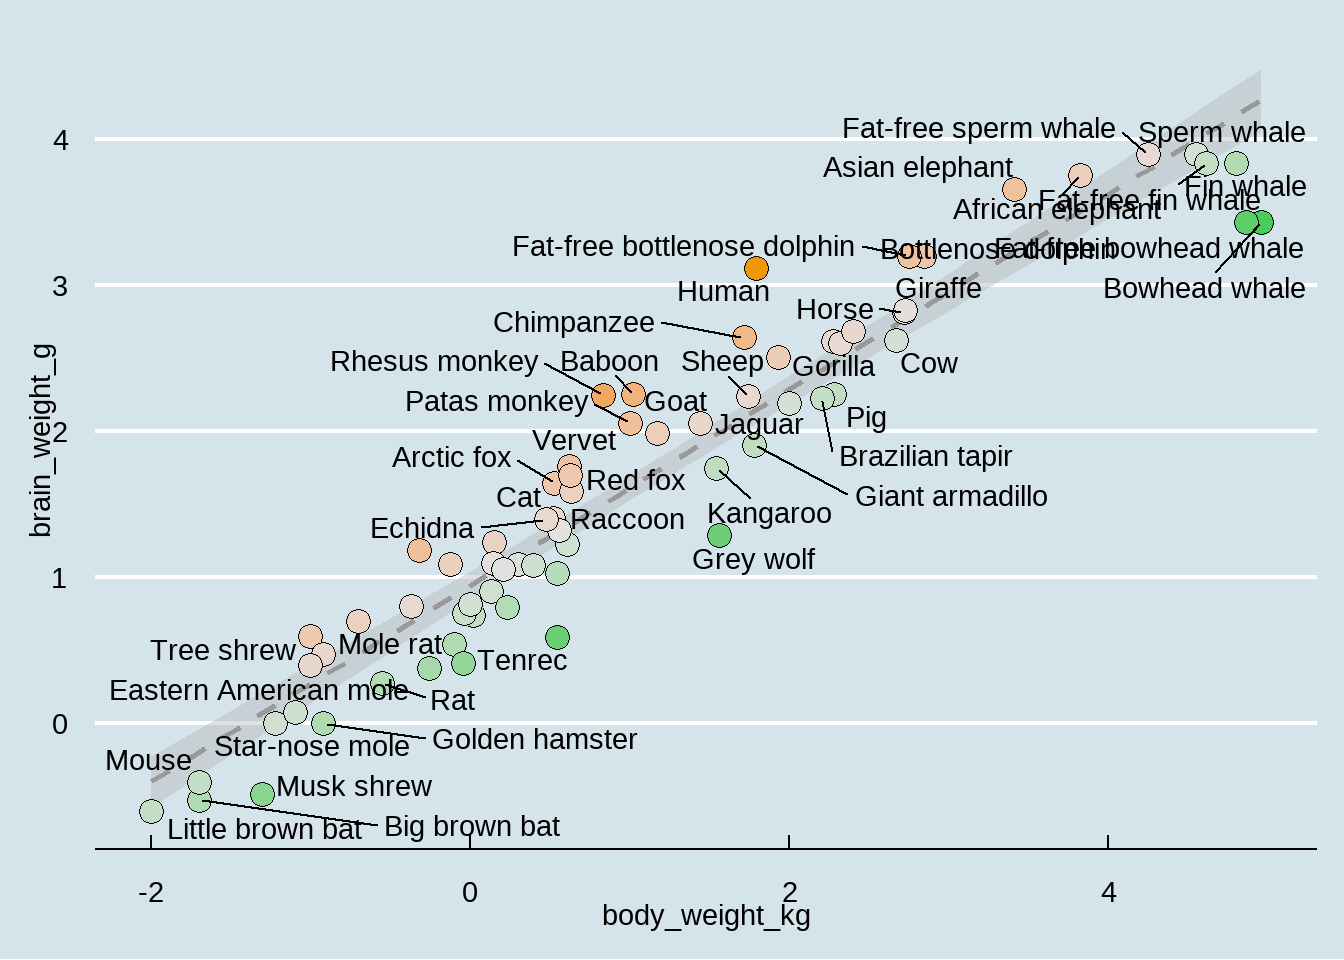
library(colorspace)

df %>%
  ggplot(aes(x = body_weight_kg, y = brain_weight_g)) +
  geom_smooth(method = "lm", se = TRUE, color = "gray60", fill = "gray70", linetype = "dashed") +
  geom_point(aes(fill = resid), color = "black", size = 4, shape = 21) +
  ggrepel::geom_text_repel(aes(label = species)) +
  #scale_x_log10() +
  #scale_y_log10() +
  ggthemes::theme_economist() +
  theme(
    legend.position = "none"
  ) +
  scale_fill_continuous_diverging(palette = "Green-Orange")