第 59 章 logistic回归模型
本章讲广义线性模型中的logistic回归模型。
59.1 问题
假定这里有一组数据,包含学生GRE成绩和被录取的状态(admit = 1,就是被录取;admit = 0,没有被录取)
## # A tibble: 400 × 4
##    admit   gre   gpa  rank
##    <dbl> <dbl> <dbl> <dbl>
##  1     0   380  3.61     3
##  2     1   660  3.67     3
##  3     1   800  4        1
##  4     1   640  3.19     4
##  5     0   520  2.93     4
##  6     1   760  3        2
##  7     1   560  2.98     1
##  8     0   400  3.08     2
##  9     1   540  3.39     3
## 10     0   700  3.92     2
## # ℹ 390 more rows我们能用学生GRE的成绩预测录取状态吗?回答这个问题需要用到logistic回归模型,
$$ \[\begin{align*} \text{admit}_{i} &\sim \mathrm{Binomial}(1, p_{i}) \\ \text{logit}(p_{i}) &= \log\Big(\frac{p_{i}}{1 - p_{i}}\Big) = \alpha + \beta \cdot \text{gre}_{i} \\ \text{equivalent to,} \quad p_{i} &= \frac{1}{1 + \exp[- (\alpha + \beta \cdot \text{gre}_{i})]} \\ & = \frac{\exp(\alpha + \beta \cdot \text{gre}_{i})}{1 + \exp (\alpha + \beta \cdot\text{gre}_{i})} \\ \end{align*}\] $$
这里 \(p_i\) 就是被录取的概率。预测因子 \(gre\) 的线性组合模拟的是 \(log\Big(\frac{p_{i}}{1 - p_{i}}\Big)\) ,即对数比率(log-odds).
按照上面表达式,用glm函数写代码,
model_logit <- glm(admit ~ gre,
  data = gredata,
  family = binomial(link = "logit")
)

summary(model_logit)
##
## Call:
## glm(formula = admit ~ gre, family = binomial(link = "logit"),
## data = gredata)
##
## Coefficients:
## Estimate Std. Error z value Pr(>|z|)
## (Intercept) -2.901344 0.606038 -4.787 1.69e-06 ***
## gre 0.003582 0.000986 3.633 0.00028 ***
## ---
## Signif. codes: 0 '***' 0.001 '**' 0.01 '*' 0.05 '.' 0.1 ' ' 1
##
## (Dispersion parameter for binomial family taken to be 1)
##
## Null deviance: 499.98 on 399 degrees of freedom
## Residual deviance: 486.06 on 398 degrees of freedom
## AIC: 490.06
##
## Number of Fisher Scoring iterations: 4得到gre的系数是
coef(model_logit)[2]## gre
## 0.003582212怎么理解这个0.003582呢?
59.2 模型的输出
为了更好地理解模型的输出,这里用三种不同的度量方式(scales)来计算系数。
假定 \(p\) 为录取的概率
| num | scale | formula |
|---|---|---|
| 1 | The log-odds scale | \(log \frac{p}{1 - p}\) |
| 2 | The odds scale | \(\frac{p}{1 -p}\) |
| 3 | The probability scale | \(p\) |
59.2.1 The log-odds scale
模型给出系数(0.003582)事实上就是log-odds度量方式的结果,具体来说, 这里系数(0.003582)代表着: GRE考试成绩每增加1个单位,那么log-odds(录取概率)就会增加0.003582. (注意,不是录取概率增加0.003582,而是log-odds(录取概率)增加0.003582)
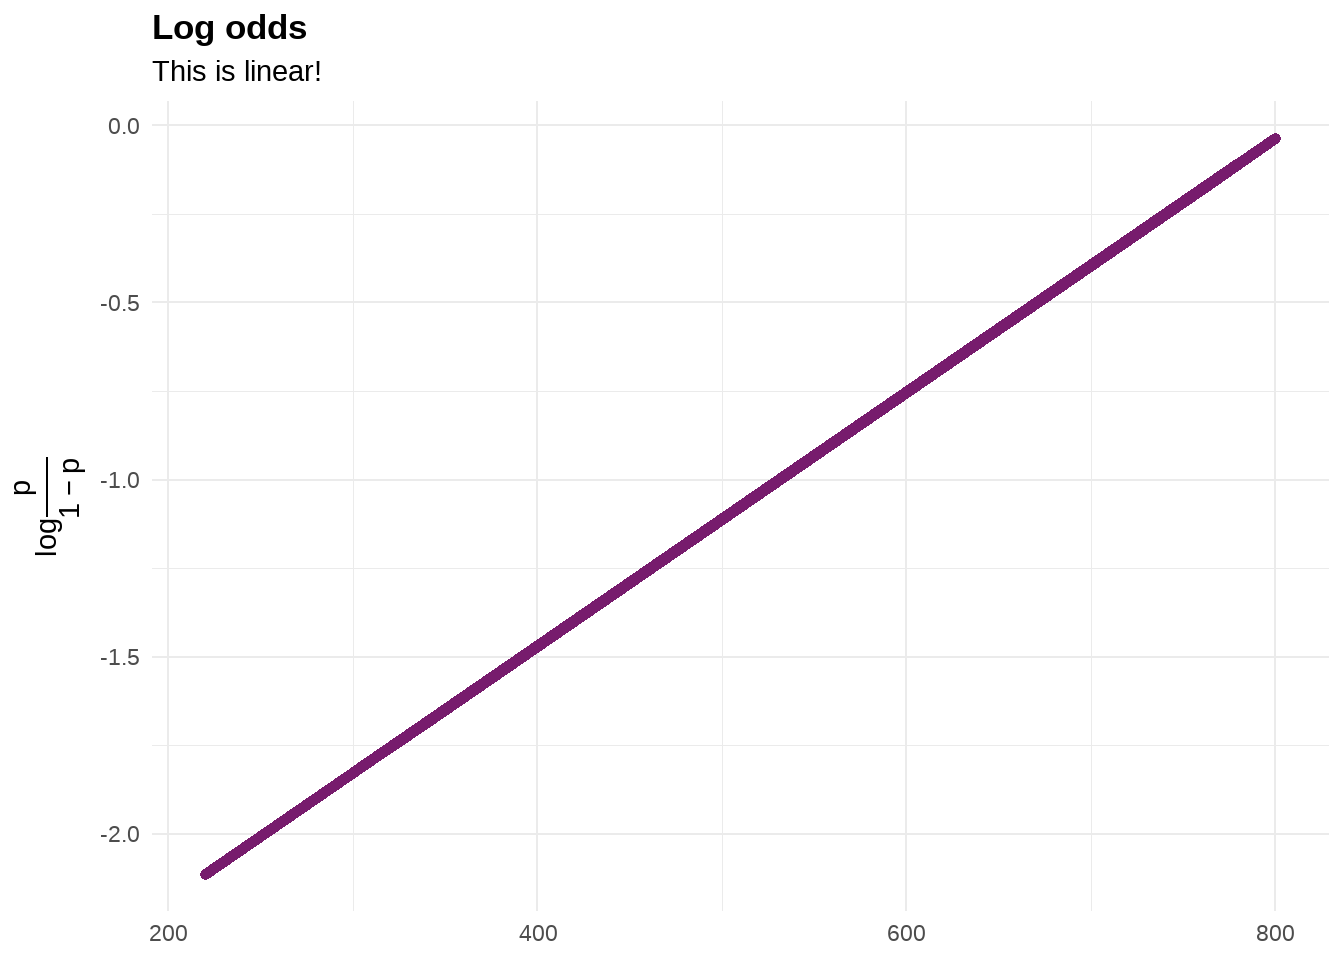
为了更清楚的理解,我们把log-odds的结果与gre成绩画出来看看
logit_log_odds <- broom::augment_columns(
  model_logit,
  data = gredata,
  type.predict = c("link")
) %>%
  rename(log_odds = .fitted)
library(latex2exp)
logit_log_odds %>%
    ggplot(aes(x = gre, y = log_odds)) +
    geom_path(color = "#771C6D", size = 2) +
    labs(title = "Log odds",
        subtitle = "This is linear!",
        x = NULL,
        y = TeX("$log \\frac{p}{1 - p}$")) +
    theme_minimal() +
    theme(
      plot.title = element_text(face = "bold"),
      axis.title.y = element_text(angle = 90)
          )
由图看到,GRE成绩 与log-odds(录取概率)这个值的关系是线性的,斜率就是模型给出的系数0.003582
59.2.2 The odds scale
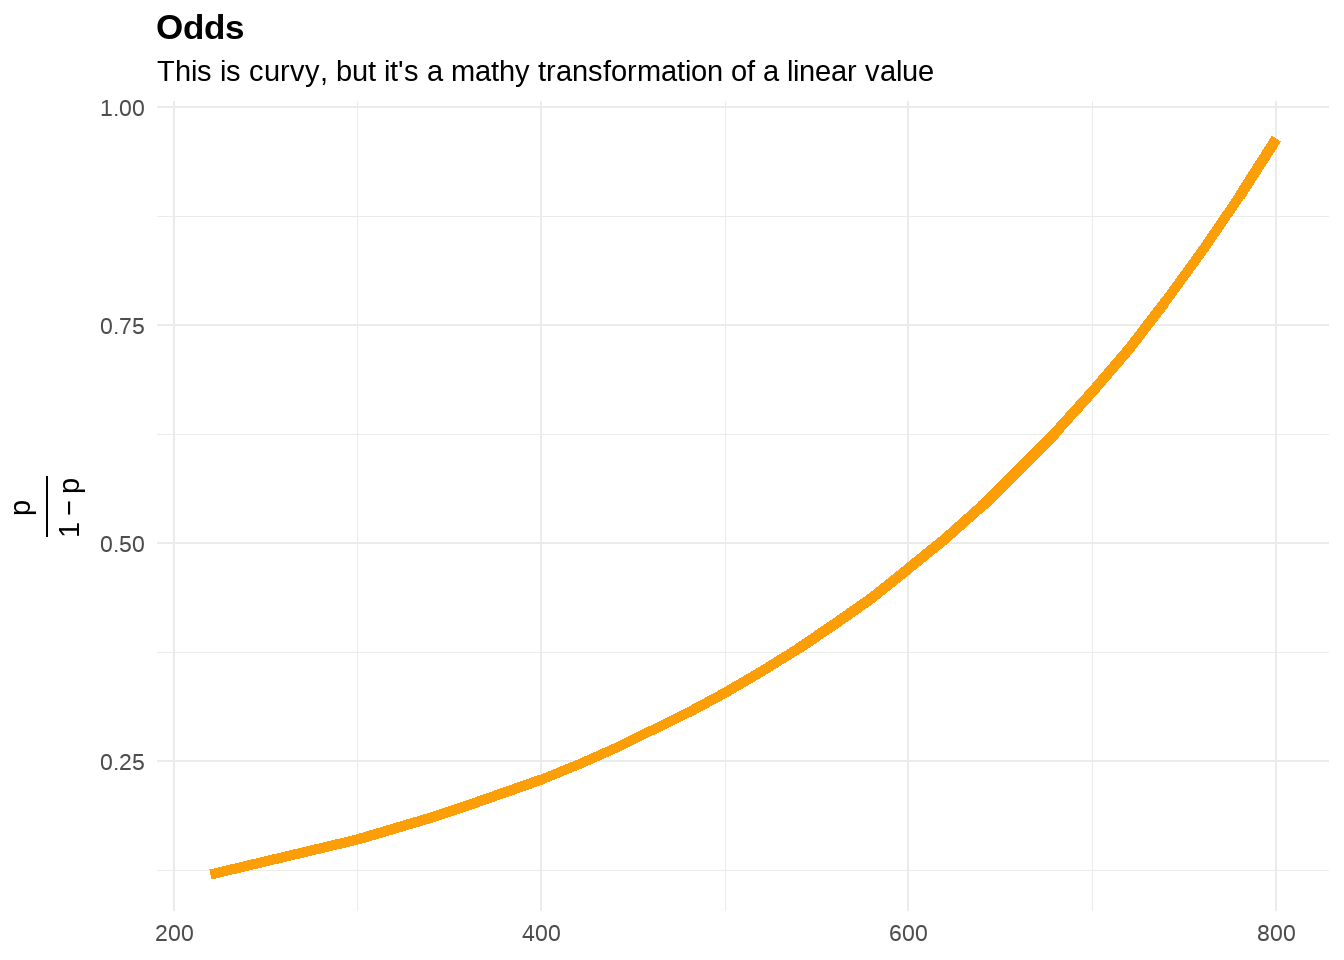
第二种odds scale度量方式可能要比第一种要好理解点,我们先求系数的指数,exp(0.003582) = 1.003588
exp(0.003582)## [1] 1.0035881.003588的含义是: GRE考试成绩每增加1个单位,那么odds(录取概率)就会增大1.003588倍;若增加2个单位,那么odds(录取概率)就会增大(1.003588 * 1.003588)倍,也就说是个乘法关系。
有时候,大家喜欢用增长百分比表述,那么就是
(exp(0.003582) - 1) x 100% = (1.003588 - 1) x 100% = 0.36%
即,GRE考试成绩每增加1个点,那么odds(录取概率)就会增长百分之0.36.
同样,我们把odds(录取概率)的结果与GRE成绩画出来看看
logit_odds <- broom::augment_columns(
  model_logit,
  data = gredata,
  type.predict = c("link")
) %>%
  rename(log_odds = .fitted) %>%
  mutate(odds_ratio = exp(log_odds))
logit_odds %>%
    ggplot(aes(x = gre, y = odds_ratio)) +
    geom_line(color = "#FB9E07", size = 2) +
    labs(title = "Odds",
        subtitle = "This is curvy, but it's a mathy transformation of a linear value",
        x = NULL,
        y = TeX("$\\frac{p}{1 - p}$")) +
    theme_minimal() +
    theme(
      plot.title = element_text(face = "bold"),
      axis.title.y = element_text(angle = 90)
    )
59.2.3 The probability scale.
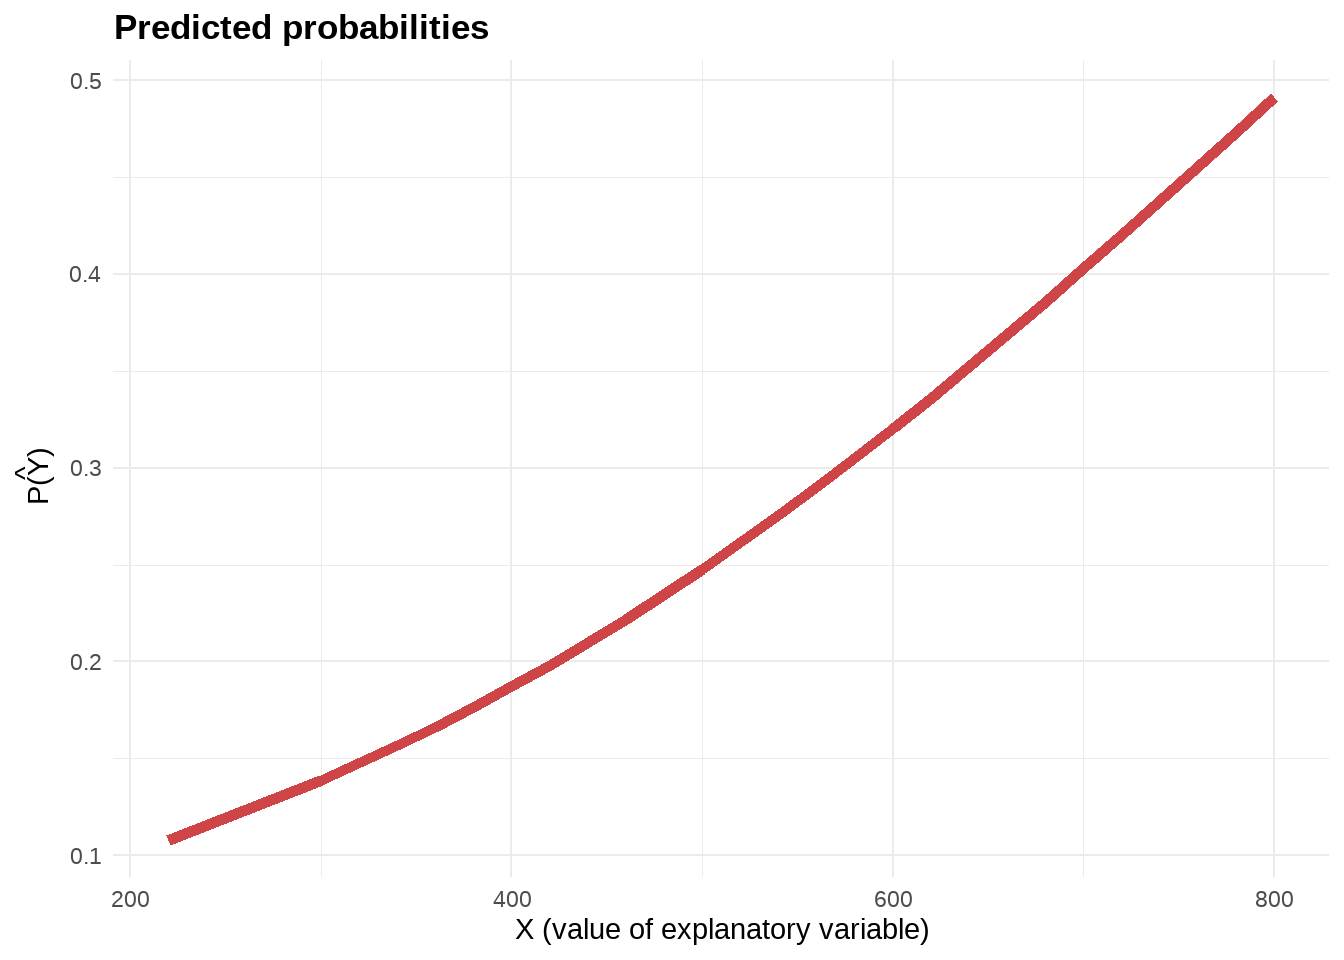
第三种度量方式是概率度量(probability scale),因为模型假定的是,GRE的分数与log-odds(录取概率)呈线性关系,那么很显然GRE的分数与录取概率就不可能是线性关系了,而是呈非线性关系。我们先看下非线性关系长什么样。
logit_probs <- broom::augment_columns(
  model_logit,
  data = gredata,
  type.predict = c("response")
) %>%
  rename(pred_prob = .fitted)
logit_probs %>%
    ggplot(aes(x = gre, y = pred_prob)) +
    #geom_point(aes(x = gre, y = admit)) +
    geom_line(color = "#CF4446", size = 2) +
    labs(title = "Predicted probabilities",
        sutitle = "Plug values of X into ",
        x = "X (value of explanatory variable)",
        y = TeX("\\hat{P(Y)} ")) +
    theme_minimal() +
    theme(plot.title = element_text(face = "bold"))
可以看到,GRE分数对录取的概率的影响是正的且非线性的,具体来说,
- GRE分数200分左右,录取概率约0.1;
- GRE分数500分左右,录取概率约0.25;
- GRE分数800分左右,录取概率接近0.5;
提请注意的是,以上三种度量的方式中:
-
log_odds scale,预测因子与log_odds()的关系是一个固定值,具有可加性 -
odds scale, 预测因子与odds()的关系是一个固定值,具有乘法性 -
probability,预测因子与probability的关系不再是一个固定值了
用哪种度量方式来理解模型的输出,取决不同的场景。第一种方式容易计算但理解较为困难,第三种方式最容易理解,但不再是线性关系了。
59.3 预测
59.3.1 预测与拟合
先认识下两个常用的函数predict()和fitted().
## # A tibble: 400 × 6
##    admit   gre   gpa  rank    pred fitted
##    <dbl> <dbl> <dbl> <dbl>   <dbl>  <dbl>
##  1     0   380  3.61     3 -1.54    0.177
##  2     1   660  3.67     3 -0.537   0.369
##  3     1   800  4        1 -0.0356  0.491
##  4     1   640  3.19     4 -0.609   0.352
##  5     0   520  2.93     4 -1.04    0.261
##  6     1   760  3        2 -0.179   0.455
##  7     1   560  2.98     1 -0.895   0.290
##  8     0   400  3.08     2 -1.47    0.187
##  9     1   540  3.39     3 -0.967   0.275
## 10     0   700  3.92     2 -0.394   0.403
## # ℹ 390 more rows线性模型中,predict()和fitted()这种写法的返回结果是一样的。但在glm模型中,两者的结果是不同的。predict()返回的是log_odds(录取概率)度量的结果;而fitted()返回的是录取概率。如果想保持一致,需要对predict()返回结果做反向的log_odds计算
\[p = \exp(\alpha) / (1 + \exp(\alpha) )\]
具体如下
gredata %>%
  mutate(
    pred = predict(model_logit),
    fitted = fitted(model_logit),
    pred2 = exp(pred) / (1 + exp(pred) )
    )
## # A tibble: 400 × 7
## admit gre gpa rank pred fitted pred2
## <dbl> <dbl> <dbl> <dbl> <dbl> <dbl> <dbl>
## 1 0 380 3.61 3 -1.54 0.177 0.177
## 2 1 660 3.67 3 -0.537 0.369 0.369
## 3 1 800 4 1 -0.0356 0.491 0.491
## 4 1 640 3.19 4 -0.609 0.352 0.352
## 5 0 520 2.93 4 -1.04 0.261 0.261
## 6 1 760 3 2 -0.179 0.455 0.455
## 7 1 560 2.98 1 -0.895 0.290 0.290
## 8 0 400 3.08 2 -1.47 0.187 0.187
## 9 1 540 3.39 3 -0.967 0.275 0.275
## 10 0 700 3.92 2 -0.394 0.403 0.403
## # ℹ 390 more rows我这样折腾无非是想让大家知道,在glm中predict()和fit()是不同的。
如果想让predict()也返回录取概率,也可以不用那么麻烦,事实上predict的type = "response") 选项已经为我们准备好了。
## # A tibble: 400 × 6
##    admit   gre   gpa  rank  pred fitted
##    <dbl> <dbl> <dbl> <dbl> <dbl>  <dbl>
##  1     0   380  3.61     3 0.177  0.177
##  2     1   660  3.67     3 0.369  0.369
##  3     1   800  4        1 0.491  0.491
##  4     1   640  3.19     4 0.352  0.352
##  5     0   520  2.93     4 0.261  0.261
##  6     1   760  3        2 0.455  0.455
##  7     1   560  2.98     1 0.290  0.290
##  8     0   400  3.08     2 0.187  0.187
##  9     1   540  3.39     3 0.275  0.275
## 10     0   700  3.92     2 0.403  0.403
## # ℹ 390 more rows
59.3.2 预测
有时候,我们需要对给定的GRE分数,用建立的模型预测被录取的概率
## # A tibble: 4 × 1
##     gre
##   <dbl>
## 1   550
## 2   660
## 3   700
## 4 780前面讲到predict()中type参数有若干选项type = c("link", "response", "terms"),
可参考第 61 章
-
type = "link",预测的是log_odds,实际上就是coef(model_logit)[1] + gre * coef(model_logit)[2]
newdata %>%
  mutate(
    pred_log_odds = predict(model_logit, newdata = newdata, type = "link"),
    #
    pred_log_odds2 = coef(model_logit)[1] + gre * coef(model_logit)[2]

  )
## # A tibble: 4 × 3
## gre pred_log_odds pred_log_odds2
## <dbl> <dbl> <dbl>
## 1 550 -0.931 -0.931
## 2 660 -0.537 -0.537
## 3 700 -0.394 -0.394
## 4 780 -0.107 -0.107-
type = "response"",预测的是probabilities, 实际上就是exp(pred_log_odds) / (1 + exp(pred_log_odds) )
newdata %>%
  mutate(
    pred_log_odds = predict(model_logit, newdata = newdata, type = "link")
    ) %>%
  mutate(
    pred_prob = predict(model_logit, newdata = newdata, type = "response"),
    #
    pred_prob2 = exp(pred_log_odds) / (1 + exp(pred_log_odds) )
  )
## # A tibble: 4 × 4
## gre pred_log_odds pred_prob pred_prob2
## <dbl> <dbl> <dbl> <dbl>
## 1 550 -0.931 0.283 0.283
## 2 660 -0.537 0.369 0.369
## 3 700 -0.394 0.403 0.403
## 4 780 -0.107 0.473 0.473-
type = "terms",返回一个矩阵,具体计算为:模型的设计矩阵中心化以后,与模型返回的系数相乘而得到的新矩阵10。
## # A tibble: 6 × 1
##      gre
##    <dbl>
## 1 -0.744
## 2  0.259
## 3  0.761
## 4  0.187
## 5 -0.243
## 6  0.617
我们复盘一次
X <- model.matrix(admit ~ gre, data = gredata)

X %>%
  as.data.frame() %>%
  mutate(
    across(everything(), ~ .x - mean(.x))
  ) %>%
  transmute(
    term = coef(model_logit)[2] * gre
    ) %>%
  head()
## term
## 1 -0.7440254
## 2 0.2589939
## 3 0.7605035
## 4 0.1873497
## 5 -0.2425157
## 6 0.6172151