第 10 章 可重复性文档
有时候,我们需要展示和分享我们的数据分析结果给同行、老板或者老师。 那么,为了让老板能快速地的理解我们的分析思路和方法, 最好的方法,就是将分析背景、分析过程、分析结果以及图表等形成报告,让读者能重复和验证我们的结果,确保结论的真实可信。 因此,本章就将介绍如何生成分析报告(可重复性报告)。
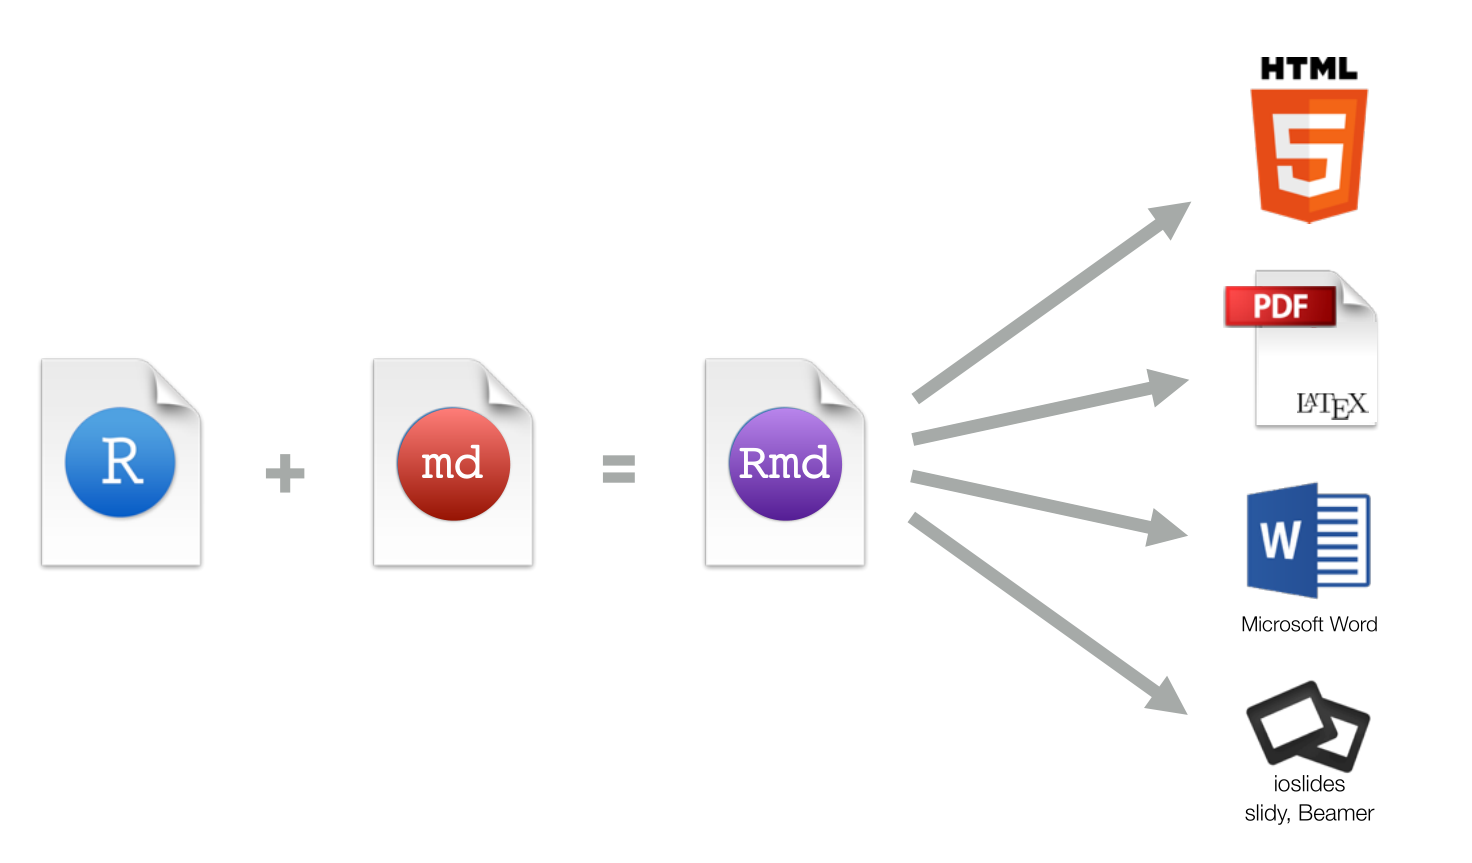
10.2 markdown 基本语法
# This is a title

#  第一章   (注意   "#" 与 "第一章"之间有空格)
##  第一节  (同上,"##" 与 "第一节"之间有空格)

This is a sentence.

Now a list begins:

- no importance
- again
- repeat

A numbered list:

1. first
2. second

__bold__, _italic_, ~~strike through~~常用的Markdown 语法:
| Type this… | …to get this |
|---|---|
normal text |
normal text |
*italic text* |
italic text |
**bold text** |
bold text |
***bold italic text*** |
bold italic text |
superscript^2^ |
superscript2 |
~~strikethrough~~ |
|
`code text` |
code text |
对于章节, 使用 # 符号:
# Header 1
## Header 2
### Header 3
#### Header 4
##### Header 5
###### Header 6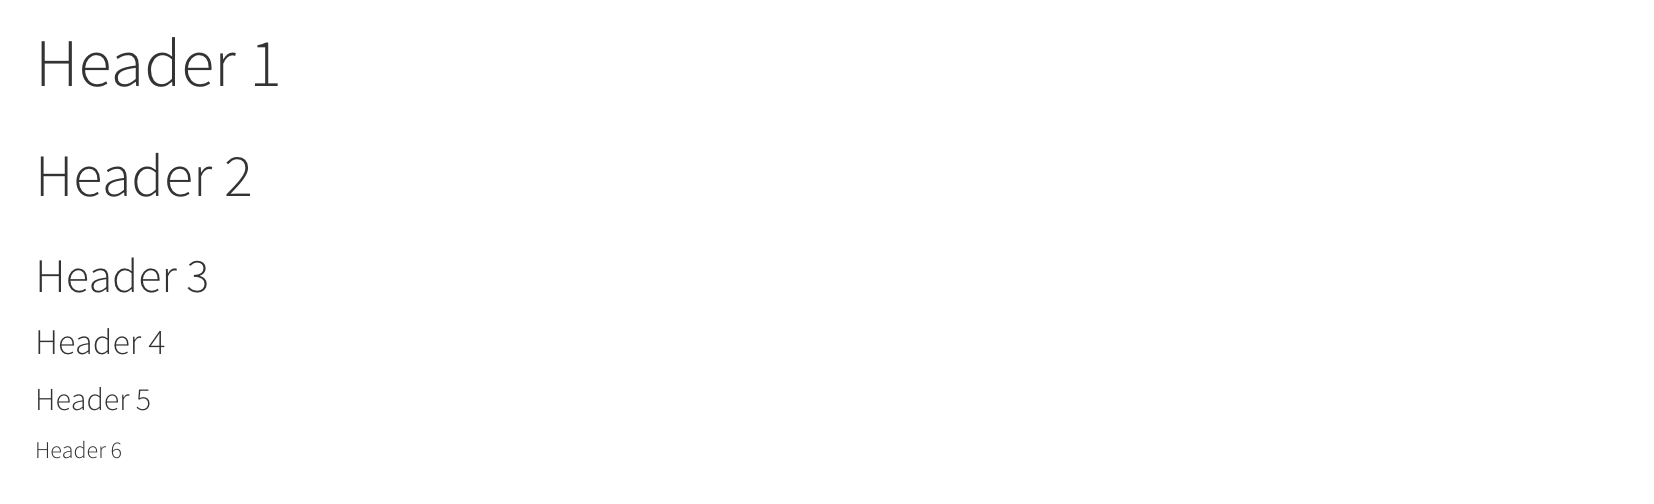
如果需要制作列表,可以使用-符号
- first item
- second item
- third item
如果希望列表带有数字编号,可以加上编号
- first item
- second item
- third item
如果想添加网页链接,可以用方括号和圆括号
如果想制作简单表格,列与列之间用 | 分隔,表格的首行下面添加--------
Table Header  | Second Header
------------- | -------------
Cell 1, 1     | Cell 2, 1
Cell 1, 2 | Cell 2, 2| Table Header | Second Header |
|---|---|
| Cell 1, 1 | Cell 2, 1 |
| Cell 1, 2 | Cell 2, 2 |
这样作表格可能会比较麻烦,我经常在这个网站在线表格转化器把表格弄好后,然后复制粘贴过来。
10.3 Elements of RMarkdown
Rstudio 创建 Rmd 文件: File -> New File -> R Markdown.
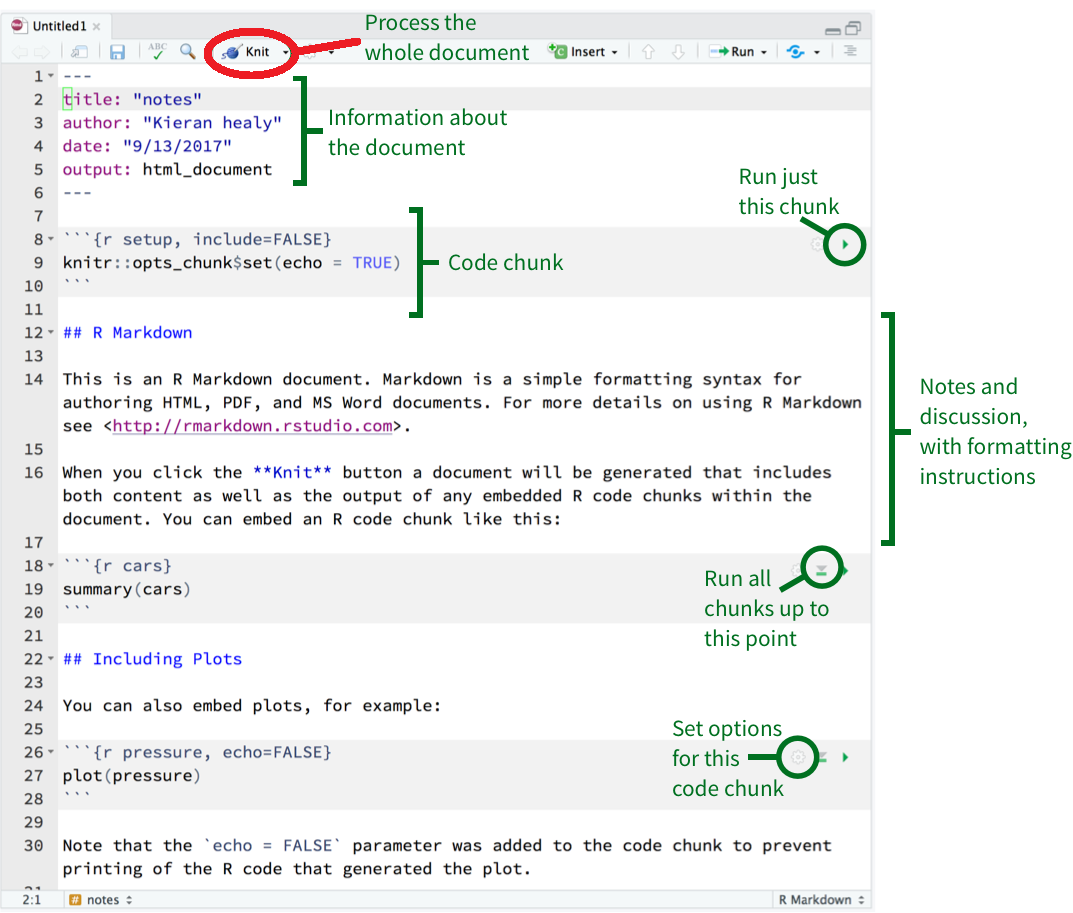
Rmd 文件基本构成(图中绿色括号地方)
- metadata
- text
- code
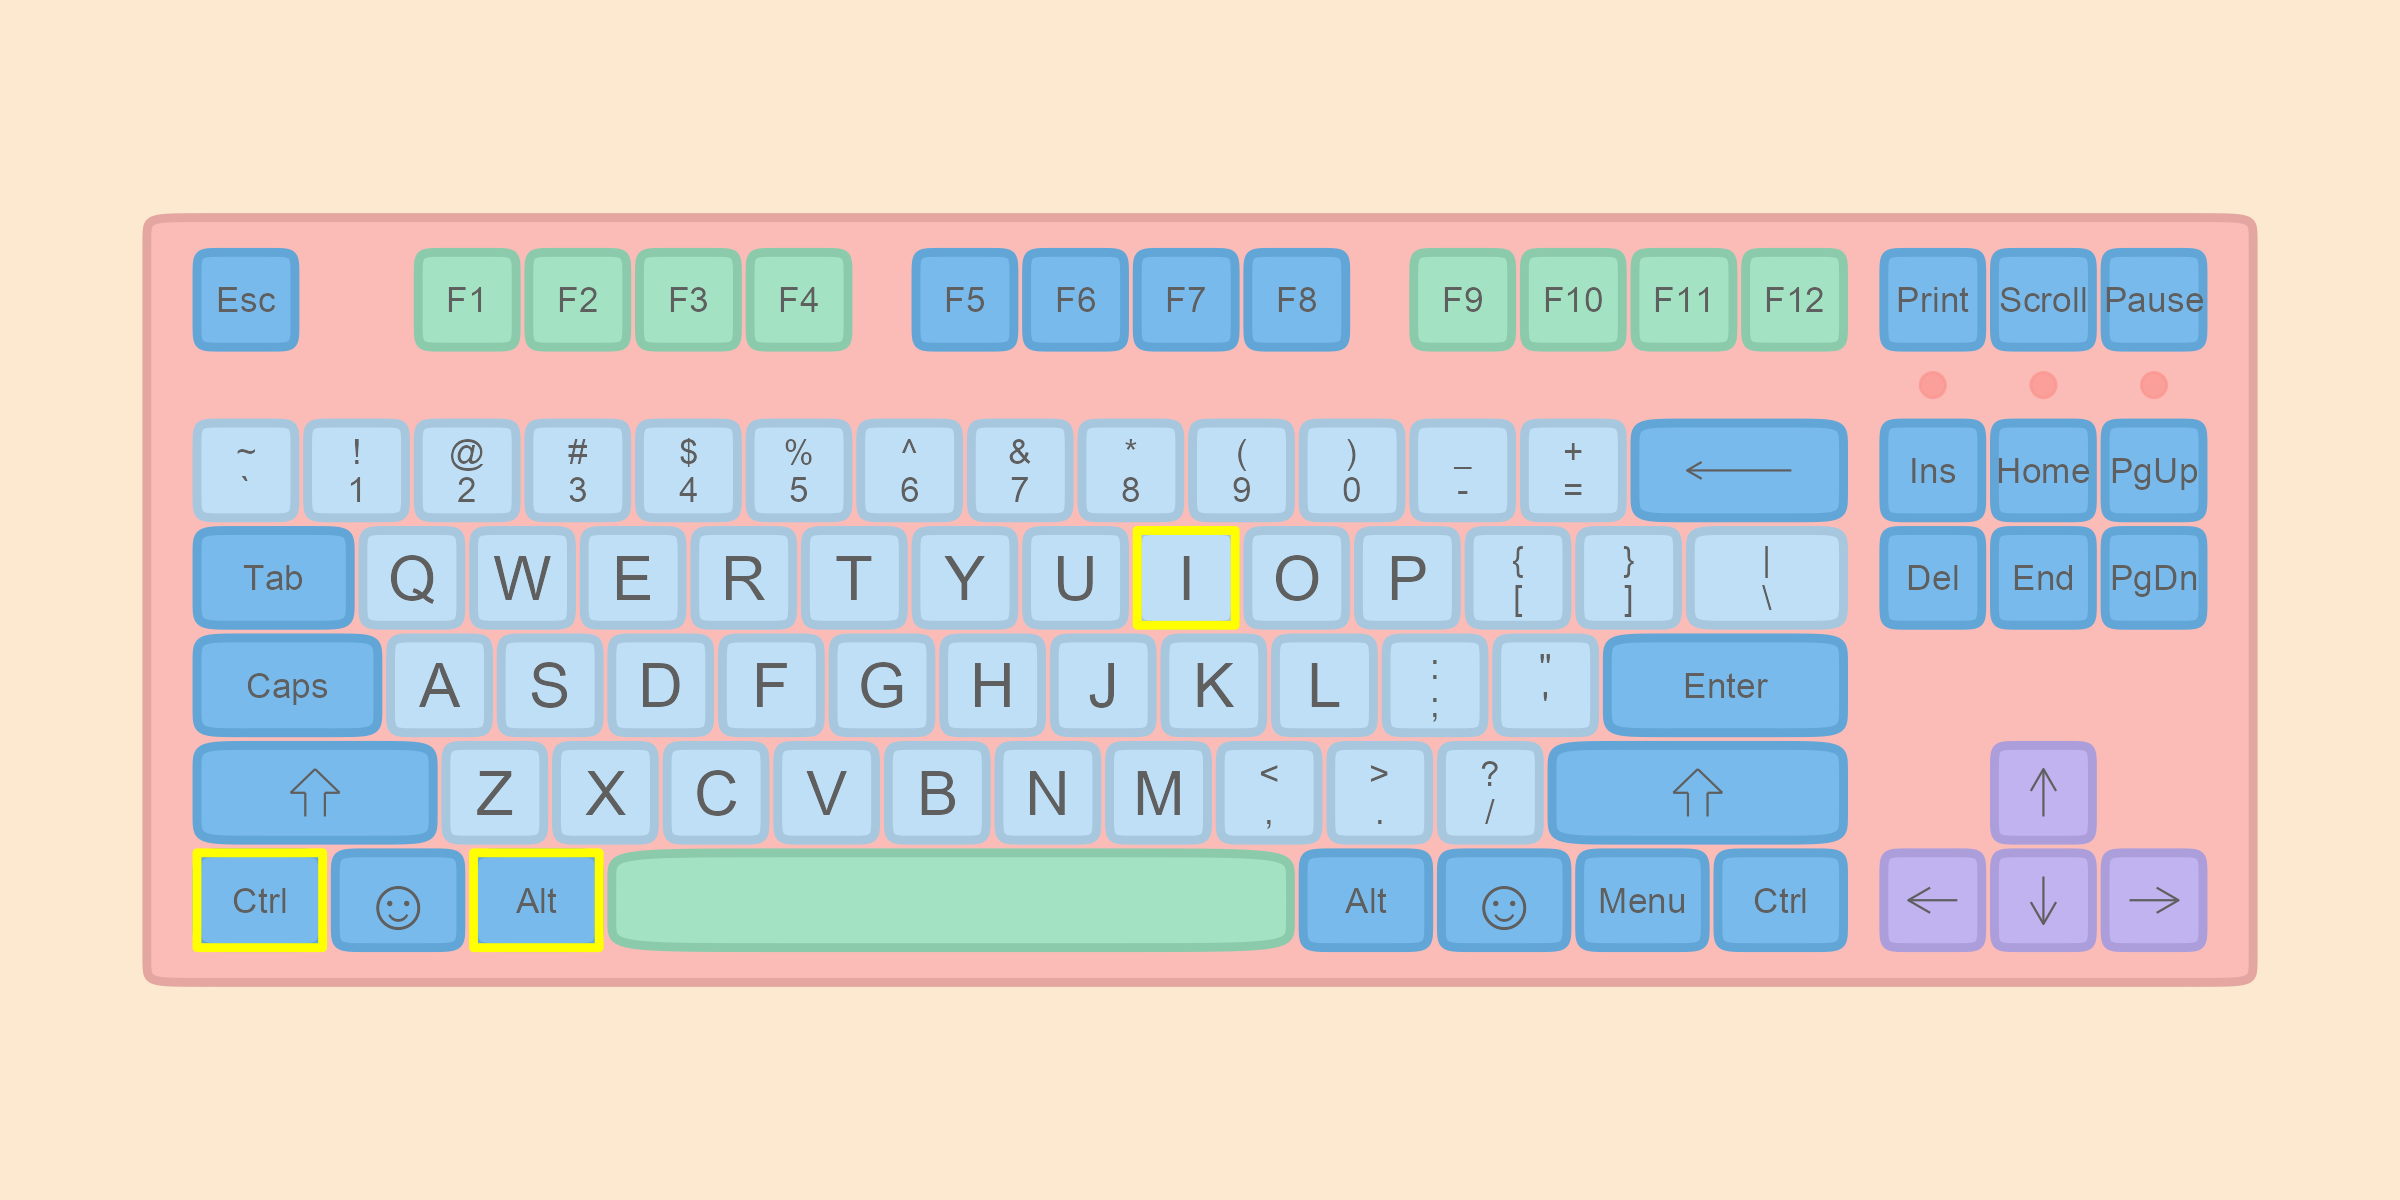
10.4 R Code chunks
在 Rmd 文档中写 R 代码,需要插入代码块(Code chunks),具体以 ```{r} 开始,以 ```结尾。可以用快捷方式Ctrl + Alt + I (OS X: Cmd + Option + I)创建代码块。
点击knit(下图中红色地方),选择想要输出的文档格式即可。下图是Rmd文档与渲染效果效果,
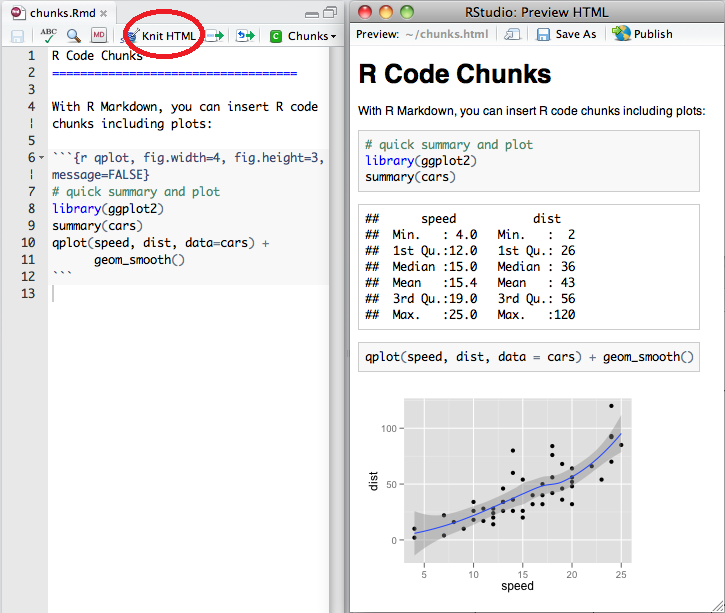
图 10.1: Rmd文档与渲染效果对比
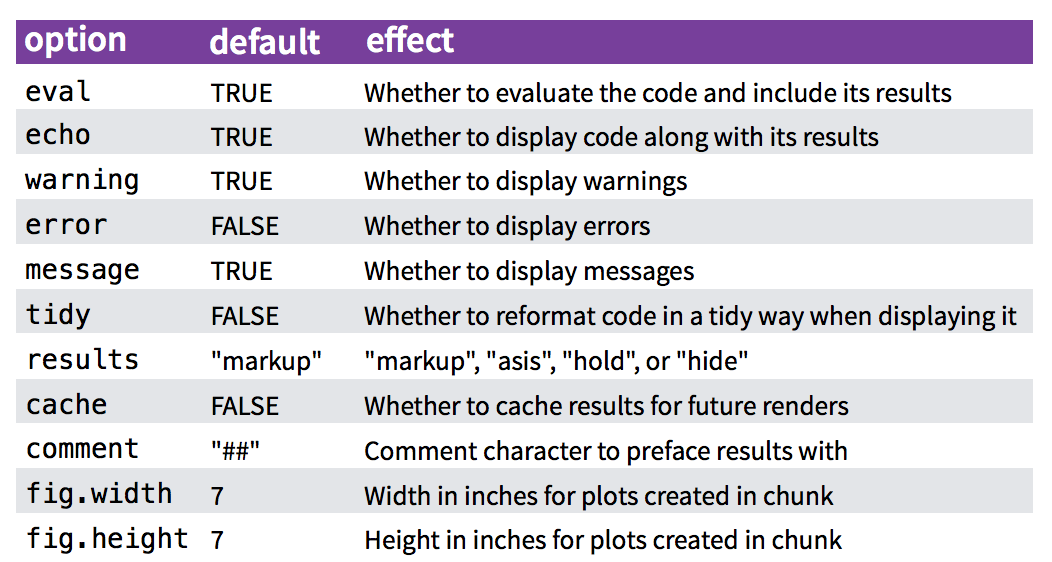
我们也可以设置一些选项,控制代码块的运行方式(for more details see http://yihui.name/knitr/):
10.6 生成word文档
rmarkdown 生成的word功能不是很多,推荐使用officedown , officer, flextable宏包
10.7 生成pdf文档
pdf文档可以插入漂亮的矢量图和优雅的数学公式,所以备受同学们的喜欢。但往往我们写中文的时候,编译不成功。这里就来讲讲如何解决这些问题,推荐阅读这里,或者看这个视频。
Instructions
- 安装最新版本 R (>3.5) 和 RStudio Desktop (>1.2).
- 安装pdf查看器,sumatrapdf网站
- 安装 LaTeX. 然而这个软件会比较大 (e.g. MacTeX is approximate 3.9G). 如果你之前没有安装过 LaTeX,我推荐你安装轻量级的 tinytex. 安装方法如下,打开R,然后再命令行输入:
install.packages("tinytex")
tinytex::install_tinytex(dir = "D:\\Tinytex", force = T)
中途会有两次警告,按 “ 确定 ” 就可以了。
国内下载 TinyTeX 比较慢,可以用浏览器或其它下载工具直接下载:https://github.com/yihui/tinytex-releases/releases 然后把下载的文件路径传给安装函数,下面四步走:
install.packages("tinytex")tinytex::tlmgr_repo('http://mirrors.tuna.tsinghua.edu.cn/CTAN/')tinytex:::install_prebuilt('TinyTeX-v2022.05.zip', dir = "D:\\Tinytex")- 添加环境变量
D:\Tinytex\bin\win32
- 修改头文件,用下面的内容替换Rmarkdown的头文件, 不要修改缩进
10.8 使用方法
10.8.1 插入公式
我相信你已经熟悉了latex语法,那么我们在Rmarkdwon里输入
$$\frac{\sum (\bar{x} - x_i)^2}{n-1}$$,那么实际输出:
\[\frac{\sum (\bar{x} - x_i)^2}{n-1}\]
也可以使用latex的等式环境, 比如
输出
\[ \Theta = \begin{pmatrix}\alpha & \beta\\ \gamma & \delta \end{pmatrix} \]
10.8.2 插入图片
```{r out.width = '35%', fig.align='left', fig.cap='this is caption', echo = F}
knitr::include_graphics("images/R_logo.png")
```
图 10.2: this is caption
10.8.3 运行代码
summary(cars)## speed dist
## Min. : 4.0 Min. : 2.00
## 1st Qu.:12.0 1st Qu.: 26.00
## Median :15.0 Median : 36.00
## Mean :15.4 Mean : 42.98
## 3rd Qu.:19.0 3rd Qu.: 56.00
## Max. :25.0 Max. :120.0010.8.4 表格
| Sepal.Length | Sepal.Width | Petal.Length | Petal.Width | Species |
|---|---|---|---|---|
| 5.1 | 3.5 | 1.4 | 0.2 | setosa |
| 4.9 | 3.0 | 1.4 | 0.2 | setosa |
| 4.7 | 3.2 | 1.3 | 0.2 | setosa |
| 4.6 | 3.1 | 1.5 | 0.2 | setosa |
| 5.0 | 3.6 | 1.4 | 0.2 | setosa |
需要更优美的表格,可参考这里
10.8.5 生成图片
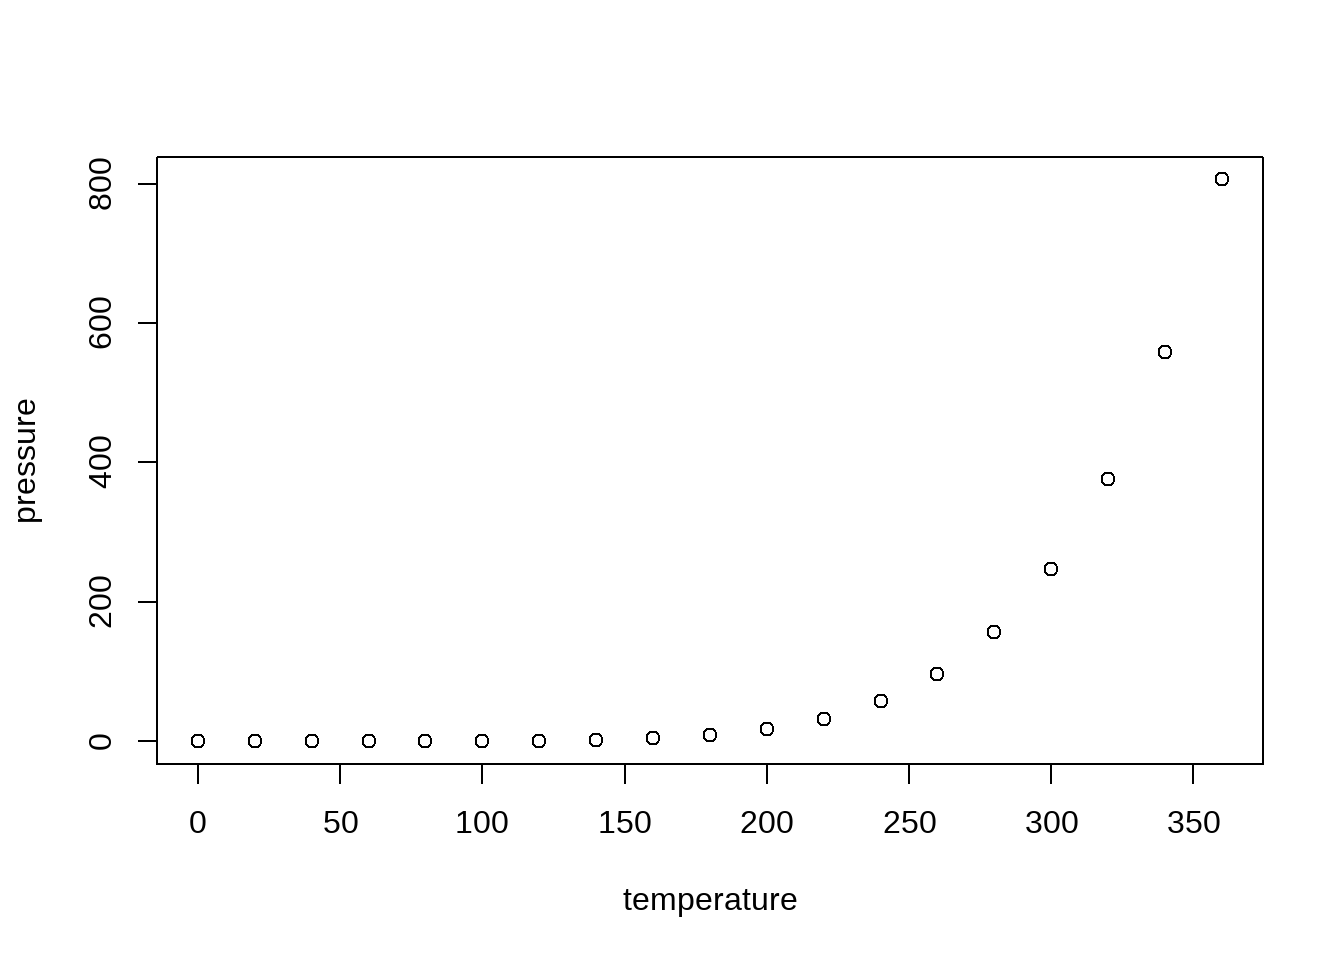
或者
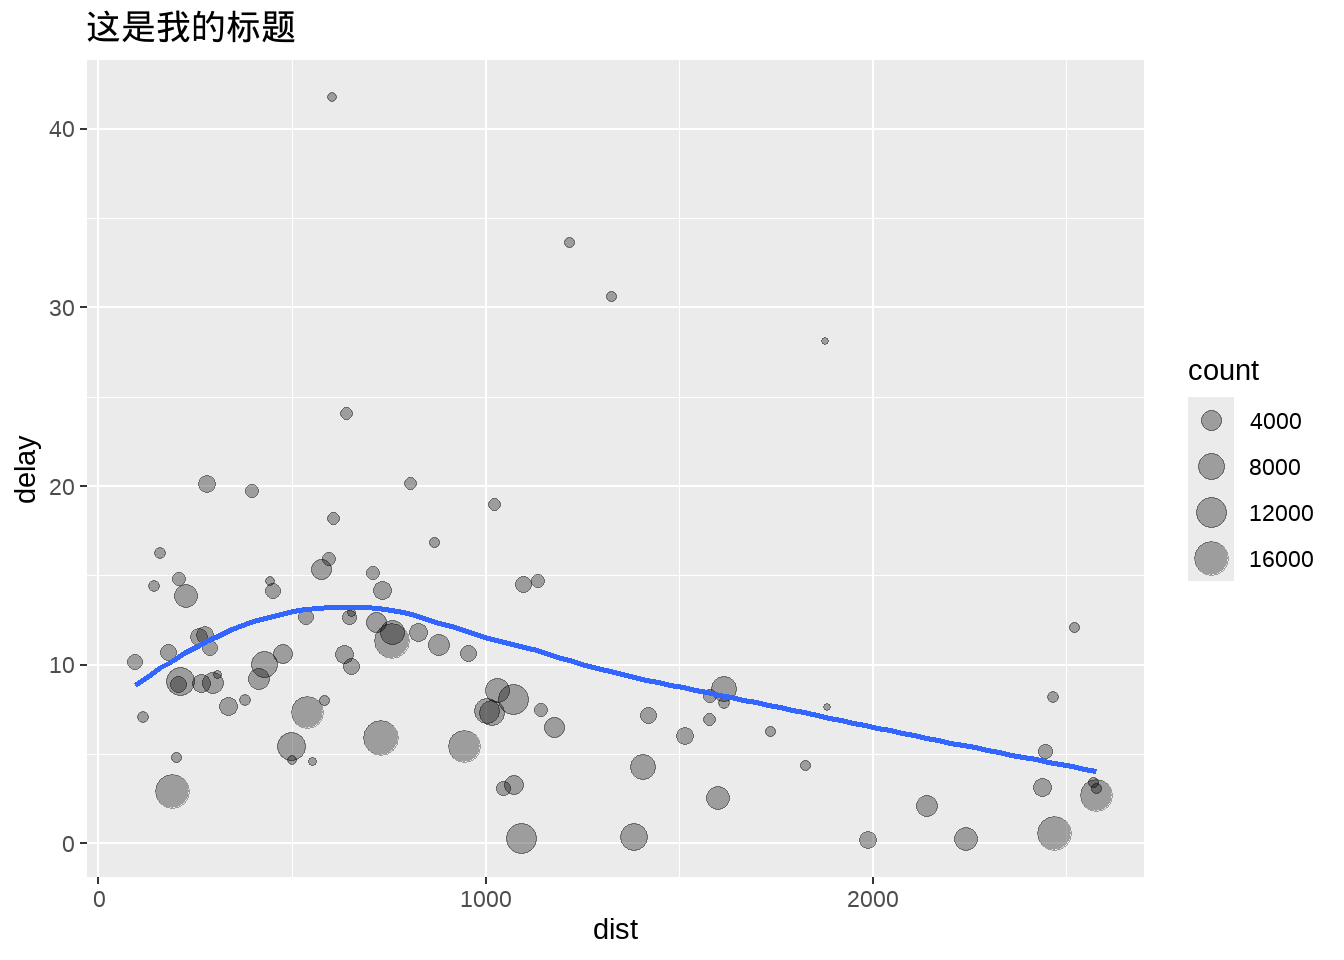
```{r, out.width = '85%', fig.showtext = TRUE}
library(tidyverse)
library(nycflights13)
library(showtext)
showtext_auto()

flights %>%
  group_by(dest) %>%
  summarize(
    count = n(),
    dist = mean(distance, na.rm = TRUE),
    delay = mean(arr_delay, na.rm = TRUE)
  ) %>%
  dplyr::filter(delay > 0, count > 20, dest != "HNL") %>%
  ggplot(mapping = aes(x = dist, y = delay)) +
  geom_point(aes(size = count), alpha = 1 / 3) +
  geom_smooth(se = FALSE) +
  ggtitle("这是我的标题")
```
10.9 案例代码
Download my_pdf_document.Rmd10.10 延伸阅读
- Markdown tutorial https://www.markdowntutorial.com (10分钟学完)
- Markdown 中文教程 https://www.appinn.com/markdown/
- Markdown 在线编辑器 https://pandao.github.io/editor.md/ http://editor.md.ipandao.com/
- LaTeX tutorial https://www.latex-tutorial.com/quick-start/
- Rmarkdown 介绍 https://bookdown.org/yihui/rmarkdown/
- Rmarkdown 手册 https://bookdown.org/yihui/rmarkdown-cookbook/