第 97 章 一天一练
“表达我自己比被人喜欢更重要。” 加油
尽可能的在tidyverse的框架下完成
97.1 day01
旋转数据框,要求
d <- tibble::tribble(
    ~name, ~chinese, ~math, ~physics, ~english, ~music, ~sport,
  "Alice",      88L,   63L,      98L,      89L,    85L,    72L,
    "Bob",      85L,   75L,      85L,      82L,    73L,    83L,
  "Carlo",      95L,   98L,      75L,      75L,    68L,    84L
  )
d
## # A tibble: 3 × 7
## name chinese math physics english music sport
## <chr> <int> <int> <int> <int> <int> <int>
## 1 Alice 88 63 98 89 85 72
## 2 Bob 85 75 85 82 73 83
## 3 Carlo 95 98 75 75 68 84变成
## # A tibble: 6 × 4
##   discipline Alice   Bob Carlo
##   <chr>      <int> <int> <int>
## 1 chinese       88    85    95
## 2 math          63    75    98
## 3 physics       98    85    75
## 4 english       89    82    75
## 5 music         85    73    68
## 6 sport         72    83    84
97.2 day02
排序,要求按照score从大往小排,但希望all是最下面一行。
d <-
  tibble::tribble(
  ~name, ~score,
   "a1",     2,
   "a2",     5,
   "a3",     3,
   "a4",     7,
   "a5",     6,
  "all",    23
  )
变成
## # A tibble: 6 × 2
##   name  score
##   <chr> <dbl>
## 1 a4        7
## 2 a5        6
## 3 a2        5
## 4 a3        3
## 5 a1        2
## 6 all      23
97.3 day03
统计每位同学,成绩高于各科均值的个数,
d <- tibble::tribble(
  ~name, ~chinese, ~engish, ~physics, ~sport, ~music,
  "Aice", 85, 56, 56, 54, 78,
  "Bob", 75, 78, 77, 56, 69,
  "Cake", 69, 41, 88, 89, 59,
  "Dave", 90, 66, 74, 82, 60,
  "Eve", 68, 85, 75, 69, 21,
  "Fod", 77, 74, 62, 74, 88,
  "Gimme", 56, 88, 75, 69, 34
)
d
## # A tibble: 7 × 6
## name chinese engish physics sport music
## <chr> <dbl> <dbl> <dbl> <dbl> <dbl>
## 1 Aice 85 56 56 54 78
## 2 Bob 75 78 77 56 69
## 3 Cake 69 41 88 89 59
## 4 Dave 90 66 74 82 60
## 5 Eve 68 85 75 69 21
## 6 Fod 77 74 62 74 88
## 7 Gimme 56 88 75 69 34变成
## # A tibble: 7 × 7
##   name  chinese engish physics sport music num_above_mean
##   <chr>   <dbl>  <dbl>   <dbl> <dbl> <dbl>          <int>
## 1 Aice       85     56      56    54    78              2
## 2 Bob        75     78      77    56    69              4
## 3 Cake       69     41      88    89    59              3
## 4 Dave       90     66      74    82    60              4
## 5 Eve        68     85      75    69    21              2
## 6 Fod        77     74      62    74    88              4
## 7 Gimme      56     88      75    69    34              2
97.4 day04
data <- tribble(
  ~id, ~corr, ~period,
  1, 0, "a",
  1, 0, "b",
  2, 0, "a",
  2, 1, "b",
  3, 1, "a",
  3, 0, "b",
  4, 1, "a",
  4, 1, "b"
)
data
## # A tibble: 8 × 3
## id corr period
## <dbl> <dbl> <chr>
## 1 1 0 a
## 2 1 0 b
## 3 2 0 a
## 4 2 1 b
## 5 3 1 a
## 6 3 0 b
## 7 4 1 a
## 8 4 1 b先按id分组,
- 如果corr中都是0 就”none”
- 如果corr中都是1 就”both”
- 如果corr中只有一个1,就输出1对应period
## # A tibble: 4 × 2
##      id resp_period
##   <dbl> <chr>
## 1     1 none
## 2     2 b
## 3     3 a
## 4     4 both
97.5 day05
图中柱子上的字体没有显示完整,请改进。
d <- tibble::tribble(
     ~name, ~value,
   "Alice",    2.12,
     "Bob",   68.45,
  "Carlie",   15.84,
    "Dave",    7.38,
     "Eve",    0.56
  )


d %>%
  ggplot(aes(x = value, y = fct_reorder(name, value)) ) +
  geom_col(width = 0.6, fill = "gray60") +
  geom_text(aes(label = value, hjust =1))  +
  theme_classic() +
  scale_x_continuous(expand = c(0, 0)) +
  labs(x = NULL, y = NULL)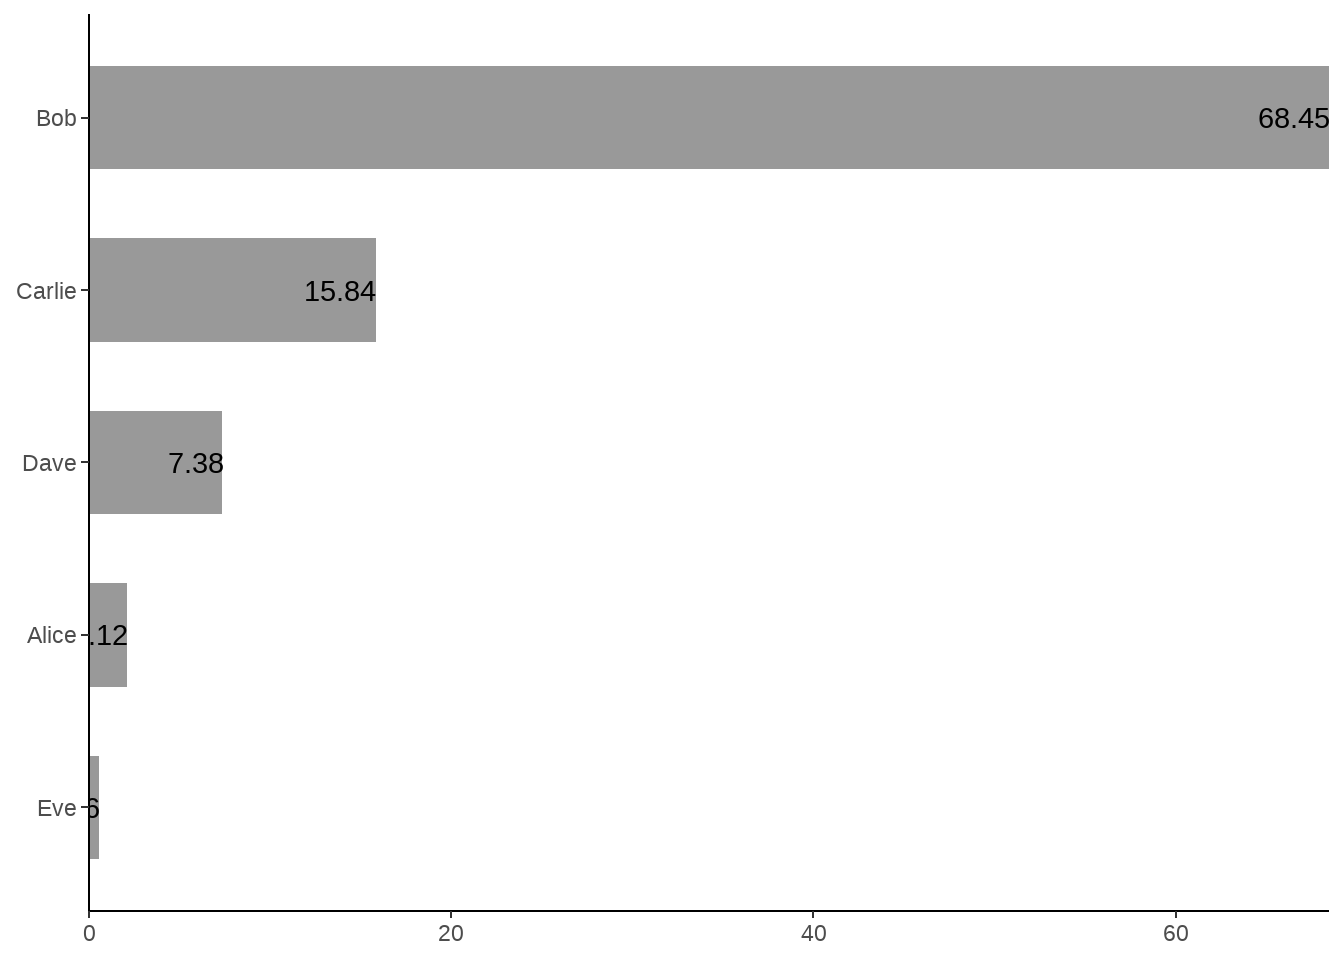
97.6 day06
我看到新闻有一张图很漂亮,您能重复出来?
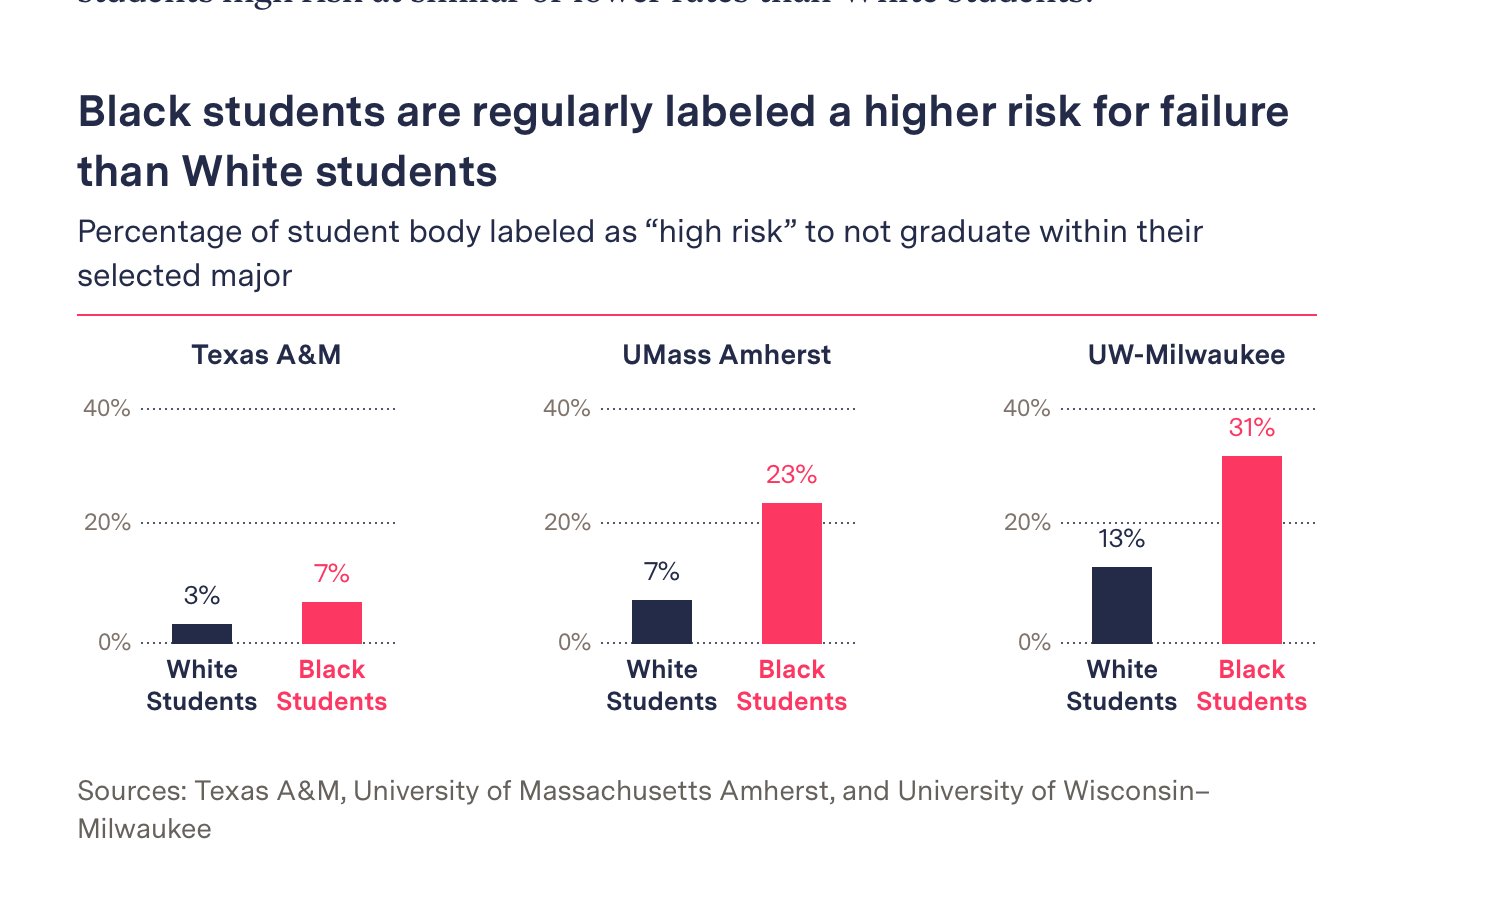
数据在下面
d <- tibble::tribble(
            ~area,           ~group, ~value,
      "Texas A&M", "white Students",   0.03,
      "Texas A&M", "Black Students",   0.07,
  "Umass Amherst", "white Students",   0.07,
  "Umass Amherst", "Black Students",   0.23,
   "UW-Milwaukee", "white Students",   0.13,
   "UW-Milwaukee", "Black Students",   0.31
  )
d
## # A tibble: 6 × 3
## area group value
## <chr> <chr> <dbl>
## 1 Texas A&M white Students 0.03
## 2 Texas A&M Black Students 0.07
## 3 Umass Amherst white Students 0.07
## 4 Umass Amherst Black Students 0.23
## 5 UW-Milwaukee white Students 0.13
## 6 UW-Milwaukee Black Students 0.31提示,可以把图片拉到https://color.adobe.com/zh/create/image-gradient 获取颜色值,比如
colorspace::swatchplot(c("#F42F5D","#252A4A"))
97.7 day07
告诉你一个你可能不知道的事情,summarise()一定要输出数据框吗?
97.10 day10
六年级的年级主任让学生提交自己所在的班级号,看到结果后,他很苦恼,你能帮忙他规整下?
d <- tibble::tribble(
               ~id,
               "2",
              "03",
       "小学2015级2班",
       "小学2015级3班",
            "0601",
            "0602",
          "201502",
          "201604",
            "6.10",
            "6.11",
             "6.5",
             "6.8",
              "06"
       )
d
## # A tibble: 13 × 1
## id
## <chr>
## 1 2
## 2 03
## 3 小学2015级2班
## 4 小学2015级3班
## 5 0601
## 6 0602
## 7 201502
## 8 201604
## 9 6.10
## 10 6.11
## 11 6.5
## 12 6.8
## 13 0697.11 day11
每行以x为均值生成一个随机数, 以下哪个是正确的?
# A
tibble(x = 1:5) %>%
  mutate(normal_mean = rnorm(1, mean = x))

# B
tibble(x = 1:5) %>%
  mutate(normal_mean = rnorm(n(), mean = x))

# C
tibble(x = 1:5) %>%
  mutate(normal_mean = map_dbl(x, ~rnorm(1, mean = .)))

# D
tibble(x = 1:5) %>%
  mutate(normal_mean = map_dbl(x, ~rnorm(1), mean = .))

# E
tibble(x = 1:5) %>%
  rowwise() %>%
  mutate(normal_mean = rnorm(1, mean = x))
97.12 day12
purrr::map()的辅助参数放里面和放外面,有什么区别?
97.13 day13
计算每天水分和食物的所占比例, 比如第一天water和food都是10.0,那么各自比例都是50%.
d <- tibble::tribble(
  ~water, ~food,
  10.0,   10.0,
  12.1,   10.3,
  13.5,   19.1,
  17.4,   16.0,
  25.8,   15.6,
  27.4,   19.8
)
d
## # A tibble: 6 × 2
## water food
## <dbl> <dbl>
## 1 10 10
## 2 12.1 10.3
## 3 13.5 19.1
## 4 17.4 16
## 5 25.8 15.6
## 6 27.4 19.897.14 day14
以下代码哪些会给出相同的图形?
ggplot(tb, aes(x,y)) + geom_line()ggplot(tb, aes(x,y,group=group)) + geom_line()ggplot(tb, aes(x,y,fill=group)) + geom_line()ggplot(tb, aes(x,y,color=group)) + geom_line()
97.15 day15
重复这张图
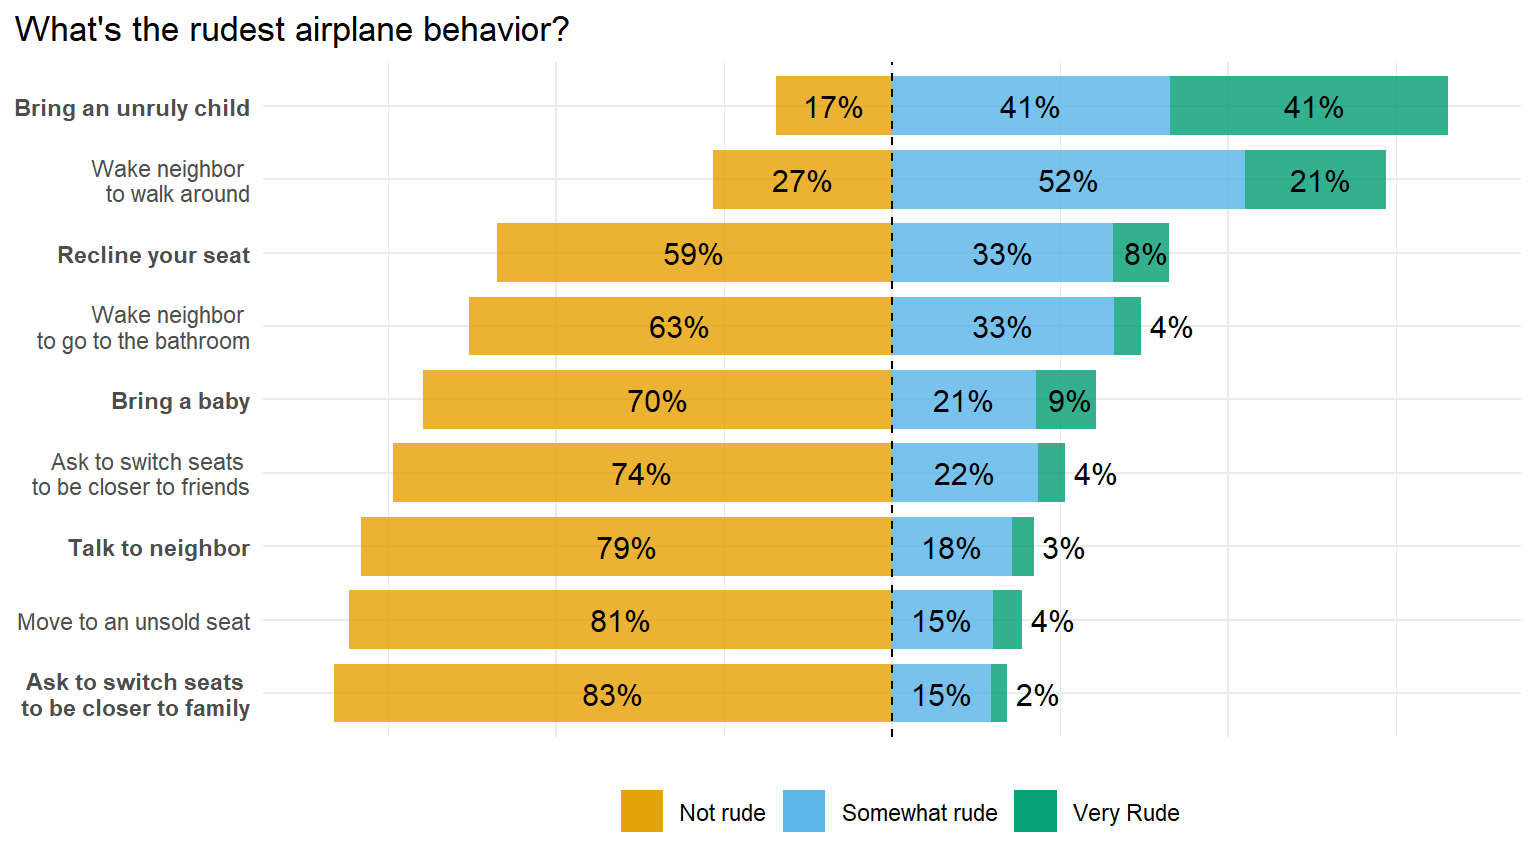
数据在下面
library(tidyverse)
raw_df <- read_rds(here::here("demo_data", "rude_behavior_in_airplane.rds"))
raw_df
## # A tibble: 27 × 3
## type judgment n
## <chr> <chr> <dbl>
## 1 "Bring a baby" Not rude 592
## 2 "Bring a baby" Very Rude 75
## 3 "Bring a baby" Somewhat rude 182
## 4 "Bring an unruly child" Not rude 147
## 5 "Bring an unruly child" Very Rude 351
## 6 "Bring an unruly child" Somewhat rude 351
## 7 "Recline your seat" Not rude 502
## 8 "Recline your seat" Very Rude 71
## 9 "Recline your seat" Somewhat rude 281
## 10 "Ask to switch seats \nto be closer to family" Not rude 705
## # ℹ 17 more rows97.16 day16
##   gene1   gene2   gene3   gene4   gene5
## "gene1" "gene2" "gene3" "gene4" "gene5"这里有一个列表,其元素list1, list2, list3是3个长度不等的向量
big_list <- list(
  list1 = paste0("gene", c(1:2, 6:7)),
  list2 = paste0("gene", c(6:7)),
  list3 = paste0("gene", c(1, 4:7))
  )
big_list
## $list1
## [1] "gene1" "gene2" "gene6" "gene7"
##
## $list2
## [1] "gene6" "gene7"
##
## $list3
## [1] "gene1" "gene4" "gene5" "gene6" "gene7"需求:想看下 gene1, gene2, gene3, gene4, gene5 是否出现在 list1, list2, list3中,并统计成下表
## # A tibble: 5 × 4
##   name  list1 list2 list3
##   <chr> <int> <int> <int>
## 1 gene1     1     0     1
## 2 gene2     1     0     0
## 3 gene3     0     0     0
## 4 gene4     0     0     1
## 5 gene5     0     0     1
97.17 day17
统计每支球队,比赛次数以及赢得比赛的分数之和
games <- tibble::tribble(
  ~team, ~outcome, ~points,
    "A",    "Win",      3,
    "A",   "Lose",      1,
    "A",    "Win",      1,
    "A",    "Win",      2,
    "B",    "Win",      1,
    "B",    "Win",      1,
    "B",   "Lose",      3,
    "B",   "Lose",      1
  )
games
## # A tibble: 8 × 3
## team outcome points
## <chr> <chr> <dbl>
## 1 A Win 3
## 2 A Lose 1
## 3 A Win 1
## 4 A Win 2
## 5 B Win 1
## 6 B Win 1
## 7 B Lose 3
## 8 B Lose 197.18 day18
只让gentoo这个分面,背景色高亮
library(tidyverse)
library(palmerpenguins)

penguins %>%
  ggplot(aes(x = bill_length_mm, y = bill_depth_mm)) +
  geom_point() +
  facet_wrap(vars(species), ncol = 3)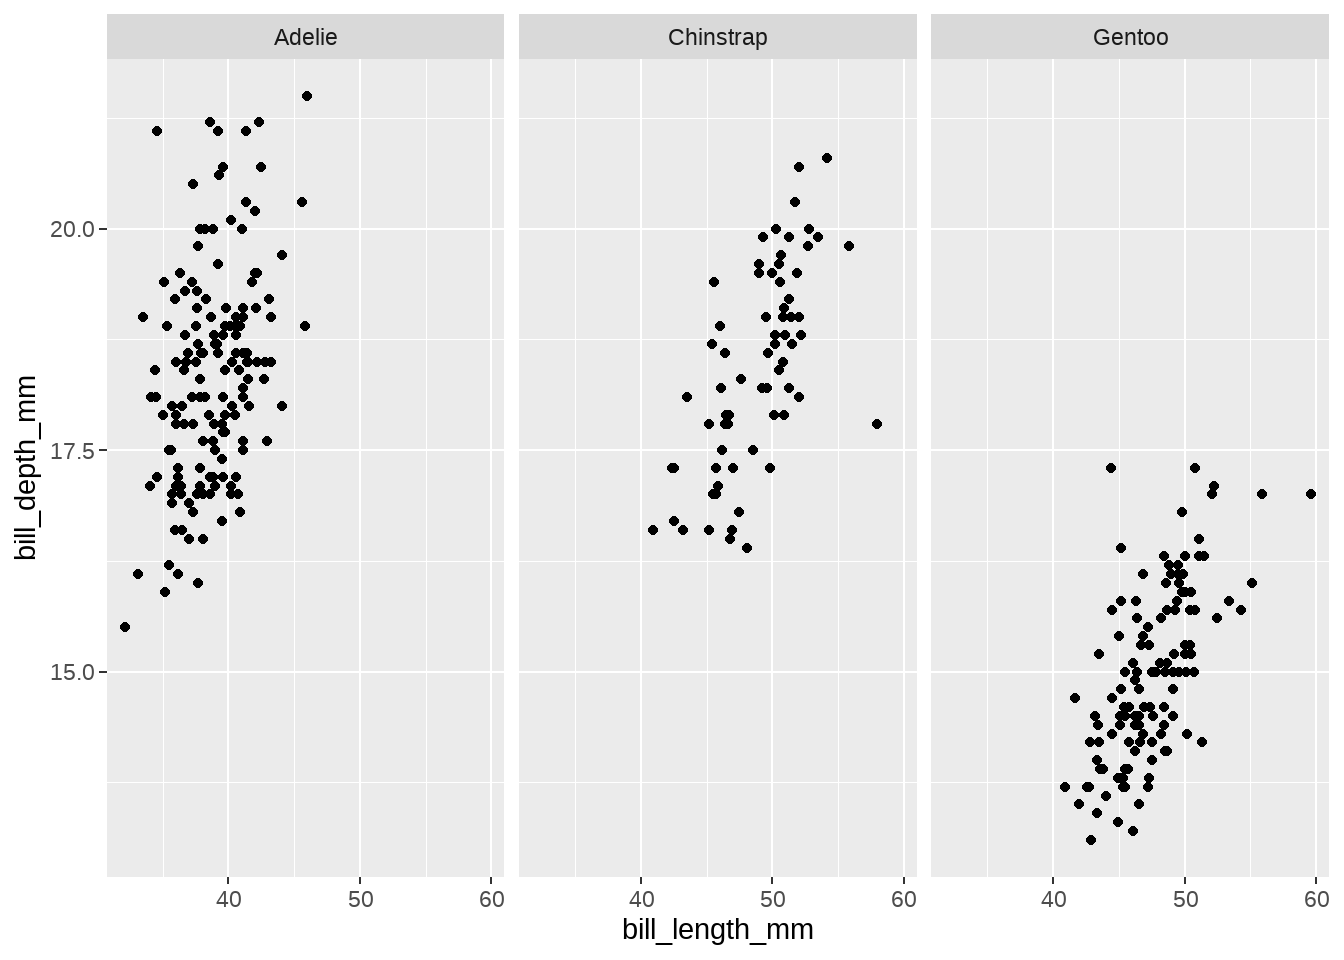
97.19 day19
用下面的数据,画出柱中柱效果
tb <- tibble::tribble(
      ~group,   ~product, ~sale,
    "Target", "Balender",   80,
    "Target",      "Fan",   90,
    "Target",   "Cooler",   70,
    "Target",       "AC",   95,
  "Achieved", "Balender",   50,
  "Achieved",      "Fan",   55,
  "Achieved",   "Cooler",   60,
  "Achieved",       "AC",   45
  )

tb
## # A tibble: 8 × 3
## group product sale
## <chr> <chr> <dbl>
## 1 Target Balender 80
## 2 Target Fan 90
## 3 Target Cooler 70
## 4 Target AC 95
## 5 Achieved Balender 50
## 6 Achieved Fan 55
## 7 Achieved Cooler 60
## 8 Achieved AC 45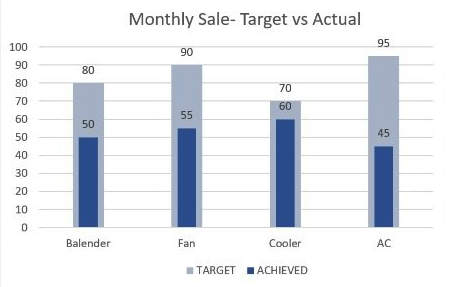
97.20 day20
修改列名,在m或者f的后面加下划线
tb <- tibble::tribble(
  ~id, ~new_ep_m014, ~newrel_f1524, ~new_sp_f65, ~new_ep_m3544,
   1L,           3L,            2L,          4L,            1L,
   2L,           4L,            4L,          5L,            2L,
   3L,           5L,            5L,          6L,            6L,
   4L,           6L,            6L,          7L,            8L
  )
tb
## # A tibble: 4 × 5
## id new_ep_m014 newrel_f1524 new_sp_f65 new_ep_m3544
## <int> <int> <int> <int> <int>
## 1 1 3 2 4 1
## 2 2 4 4 5 2
## 3 3 5 5 6 6
## 4 4 6 6 7 897.21 day21
## # A tibble: 10 × 2
##        x y
##    <int> <chr>
##  1     1 a
##  2     2 a
##  3     3 a
##  4     4 b
##  5     5 b
##  6     6 a
##  7     7 a
##  8     8 a
##  9     9 a
## 10    10 b
说出这里三行代码分别的含义
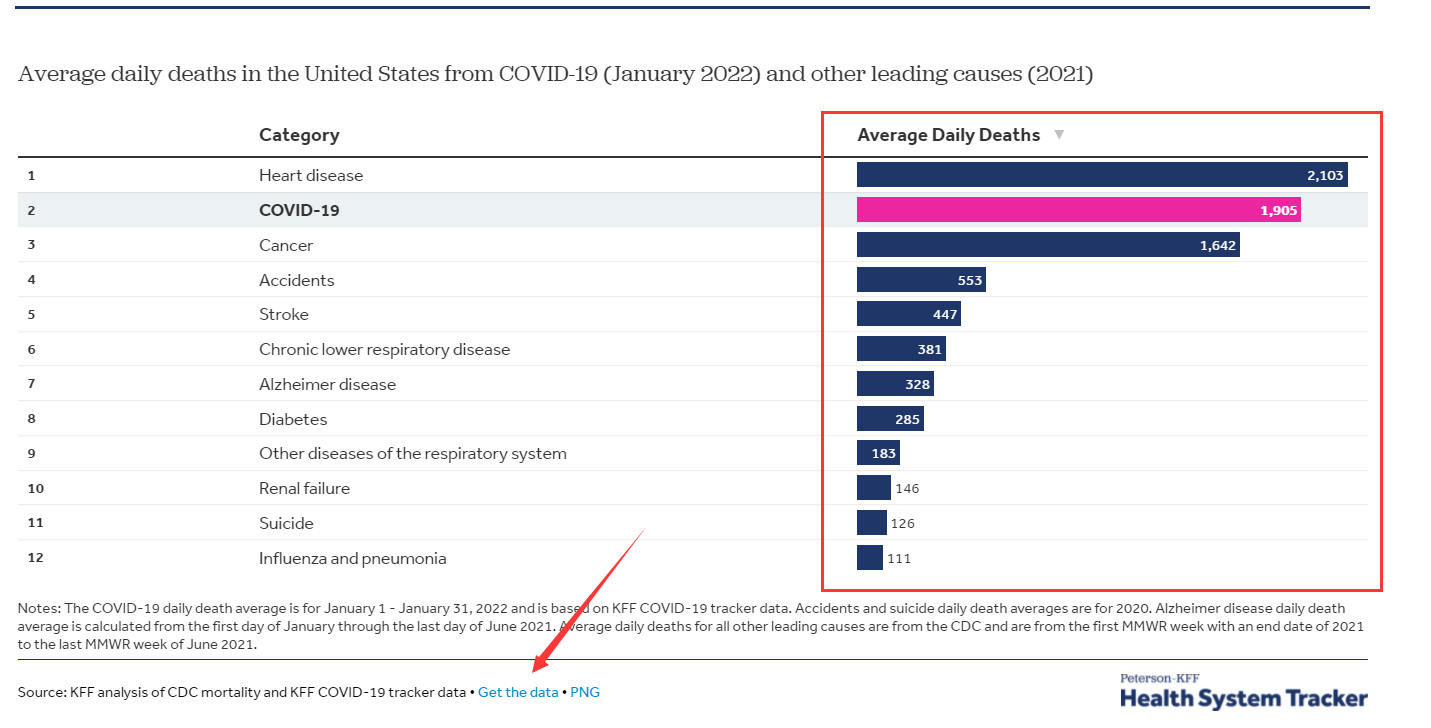
97.22 day22
看中这个张图https://www.healthsystemtracker.org/brief/covid-19-leading-cause-of-death-ranking/,数据也是可以下载的
97.25 day25
如何让连续在一起的类别,分为一组。比如这里的x变量,分为4组
df <- tibble::tribble(
  ~x,   ~y,
  "a",   2,
  "a",   3,
  "b",   4,
  "b",   5,
  "a",   1,
  "a",   3,
  "a",   2,
  "b",   3
  )

df
## # A tibble: 8 × 2
## x y
## <chr> <dbl>
## 1 a 2
## 2 a 3
## 3 b 4
## 4 b 5
## 5 a 1
## 6 a 3
## 7 a 2
## 8 b 3
97.27 day27
ww <- c("ab1", "vf2", "aaba2", "ddb76", "d8p")
ww
## [1] "ab1" "vf2" "aaba2" "ddb76" "d8p"- 找出数值
- 找出b后紧跟的数值
- 找出b后面出现的数值