第 40 章 tidyverse中的across()之美1
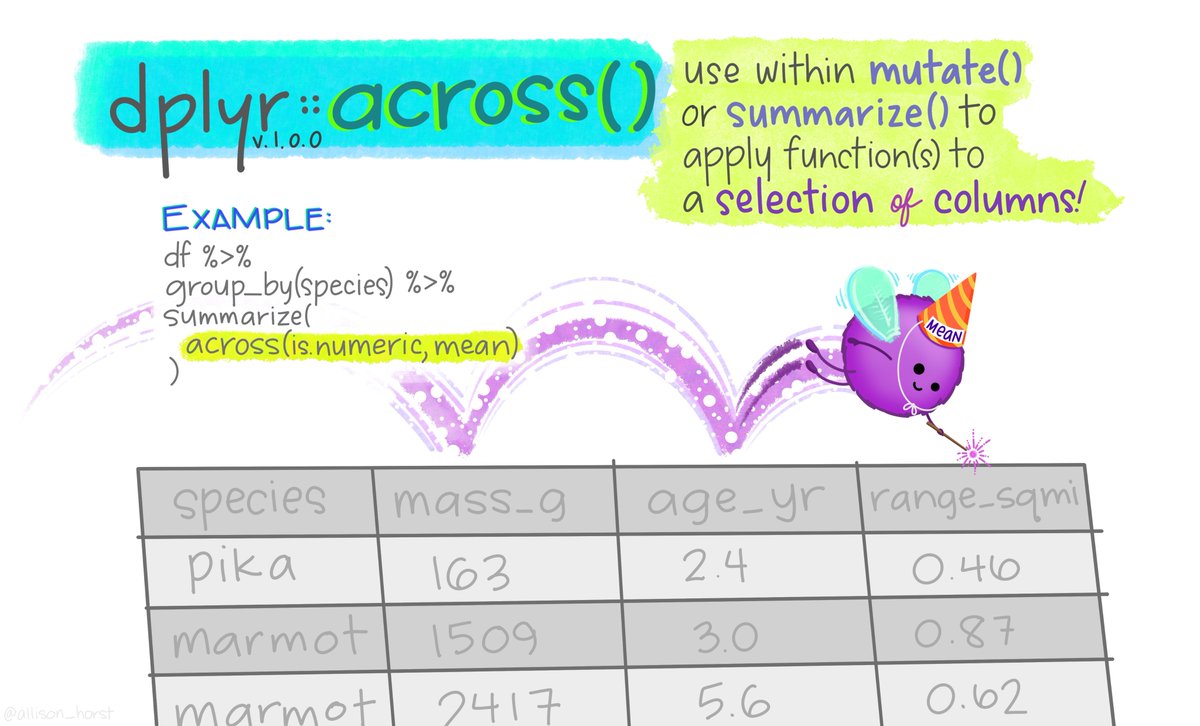
dplyr 1.0版本增加了across()函数,这个函数集中体现了dplyr宏包的强大和简约,今天我用企鹅数据,来领略它的美。
library(tidyverse)
library(palmerpenguins)
penguins
## # A tibble: 344 × 8
## species island bill_length_mm bill_depth_mm flipper_length_mm body_mass_g
## <fct> <fct> <dbl> <dbl> <int> <int>
## 1 Adelie Torgersen 39.1 18.7 181 3750
## 2 Adelie Torgersen 39.5 17.4 186 3800
## 3 Adelie Torgersen 40.3 18 195 3250
## 4 Adelie Torgersen NA NA NA NA
## 5 Adelie Torgersen 36.7 19.3 193 3450
## 6 Adelie Torgersen 39.3 20.6 190 3650
## 7 Adelie Torgersen 38.9 17.8 181 3625
## 8 Adelie Torgersen 39.2 19.6 195 4675
## 9 Adelie Torgersen 34.1 18.1 193 3475
## 10 Adelie Torgersen 42 20.2 190 4250
## # ℹ 334 more rows
## # ℹ 2 more variables: sex <fct>, year <int>看到数据框里有很多缺失值,需要统计每一列缺失值的数量,按照常规的写法
penguins %>%
  summarise(
    na_in_species = sum(is.na(species)),
    na_in_island  = sum(is.na(island)),
    na_in_length  = sum(is.na(bill_length_mm)),
    na_in_depth   = sum(is.na(bill_depth_mm)),
    na_in_flipper = sum(is.na(flipper_length_mm)),
    na_in_body    = sum(is.na(body_mass_g)),
    na_in_sex     = sum(is.na(sex)),
    na_in_year    = sum(is.na(year))
  )
## # A tibble: 1 × 8
## na_in_species na_in_island na_in_length na_in_depth na_in_flipper na_in_body
## <int> <int> <int> <int> <int> <int>
## 1 0 0 2 2 2 2
## # ℹ 2 more variables: na_in_sex <int>, na_in_year <int>幸亏数据框的列数不够多,只有8列,如果数据框有几百列,那就成体力活了,同时代码复制粘贴也容易出错。想偷懒,我们自然想到用summarise_all(),
penguins %>%
  summarise_all(
    ~ sum(is.na(.))
  )
## # A tibble: 1 × 8
## species island bill_length_mm bill_depth_mm flipper_length_mm body_mass_g
## <int> <int> <int> <int> <int> <int>
## 1 0 0 2 2 2 2
## # ℹ 2 more variables: sex <int>, year <int>挺好。接着探索,我们想先按企鹅类型分组,然后统计出各体征数据的均值,这个好说,直接写代码
penguins %>%
  group_by(species) %>%
  summarise(
    mean_length   = mean(bill_length_mm, na.rm = TRUE),
    mean_depth    = mean(bill_depth_mm, na.rm = TRUE),
    mean_flipper  = mean(flipper_length_mm, na.rm = TRUE),
    mean_body     = mean(body_mass_g, na.rm = TRUE)
  )
## # A tibble: 3 × 5
## species mean_length mean_depth mean_flipper mean_body
## <fct> <dbl> <dbl> <dbl> <dbl>
## 1 Adelie 38.8 18.3 190. 3701.
## 2 Chinstrap 48.8 18.4 196. 3733.
## 3 Gentoo 47.5 15.0 217. 5076.或者用summarise_if()偷懒
d1 <- penguins %>%
  group_by(species) %>%
  summarise_if(is.numeric, mean, na.rm = TRUE)
d1
## # A tibble: 3 × 6
## species bill_length_mm bill_depth_mm flipper_length_mm body_mass_g year
## <fct> <dbl> <dbl> <dbl> <dbl> <dbl>
## 1 Adelie 38.8 18.3 190. 3701. 2008.
## 2 Chinstrap 48.8 18.4 196. 3733. 2008.
## 3 Gentoo 47.5 15.0 217. 5076. 2008.方法不错,从语义上还算很好理解。但多了一列year, 我想在summarise_if()中用 is.numeric & !year去掉year,却没成功。人类的欲望是无穷的,我们还需要统计每组下企鹅的个数,然后合并到一起。因此,我们再接再厉
## # A tibble: 3 × 2
##   species       n
##   <fct>     <int>
## 1 Adelie      152
## 2 Chinstrap    68
## 3 Gentoo      124
最后合并
## # A tibble: 3 × 7
##   species bill_length_mm bill_depth_mm flipper_length_mm body_mass_g  year     n
##   <fct>            <dbl>         <dbl>             <dbl>       <dbl> <dbl> <int>
## 1 Adelie            38.8          18.3              190.       3701. 2008.   152
## 2 Chinst…           48.8          18.4              196.       3733. 2008.    68
## 3 Gentoo            47.5          15.0              217.       5076. 2008.   124
结果应该没问题,然鹅,总让人感觉怪怪的,过程有点折腾,希望不这么麻烦。
40.1 across()横空出世
across()的出现,让这一切变得简单和清晰,上面三步完成的动作,一步搞定
penguins %>%
  group_by(species) %>%
  summarise(
    across(where(is.numeric) & !year, mean, na.rm = TRUE),
    n = n()
  )
## # A tibble: 3 × 6
## species bill_length_mm bill_depth_mm flipper_length_mm body_mass_g n
## <fct> <dbl> <dbl> <dbl> <dbl> <int>
## 1 Adelie 38.8 18.3 190. 3701. 152
## 2 Chinstrap 48.8 18.4 196. 3733. 68
## 3 Gentoo 47.5 15.0 217. 5076. 124是不是很强大。大爱Hadley Wickham !!!
40.2 across()函数形式
across()函数,它有三个主要的参数:
across(.cols = , .fns = , .names = )-
第一个参数.cols = ,选取我们要需要的若干列,选取多列的语法与
select()的语法一致,选择方法非常丰富和人性化- 基本语法
-
:,变量在位置上是连续的,可以使用类似1:3或者species:island -
!,变量名前加!,意思是求这个变量的补集,等价于去掉这个变量,比如!species -
&与|,两组变量集的交集和并集,比如is.numeric & !year, 就是选取数值类型变量,但不包括year; 再比如is.numeric | is.factor就是选取数值型变量和因子型变量 -
c(),选取变量的组合,比如c(a, b, x)
-
- 通过人性化的语句
-
everything(): 选取所有的变量 -
last_col(): 选取最后一列,也就说倒数第一列,也可以last_col(offset = 1L)就是倒数第二列
-
- 通过变量名的特征
-
starts_with(): 指定一组变量名的前缀,也就把选取具有这一前缀的变量,starts_with("bill_") -
ends_with(): 指定一组变量名的后缀,也就选取具有这一后缀的变量,ends_with("_mm") -
contains(): 指定变量名含有特定的字符串,也就是选取含有指定字符串的变量,ends_with("length") -
matches(): 同上,字符串可以是正则表达式
-
- 通过字符串向量
- 通过函数
- 常见的有数据类型函数
where(is.numeric), where(is.factor), where(is.character), where(is.date)
- 常见的有数据类型函数
- 基本语法
-
第二个参数
.fns =,我们要执行的函数(或者多个函数),函数的语法有三种形式可选:- A function, e.g.
mean. - A purrr-style lambda, e.g.
~ mean(.x, na.rm = TRUE) - A list of functions/lambdas, e.g.
list(mean = mean, n_miss = ~ sum(is.na(.x))
- A function, e.g.
第三个参数
.names =, 如果.fns是单个函数就默认保留原来数据列的名称,即"{.col}";如果.fns是多个函数,就在数据列的列名后面跟上函数名,比如"{.col}_{.fn}";当然,我们也可以简单调整列名和函数之间的顺序或者增加一个标识的字符串,比如弄成"{.fn}_{.col}","{.col}_{.fn}_aa"
40.3 across()应用举例
下面通过一些小案例,继续呈现across()函数的功能
40.3.1 求每一列的缺失值数量
就是本章开始的需求
penguins %>%
  summarise(
    na_in_species = sum(is.na(species)),
    na_in_island  = sum(is.na(island)),
    na_in_length  = sum(is.na(bill_length_mm)),
    na_in_depth   = sum(is.na(bill_depth_mm)),
    na_in_flipper = sum(is.na(flipper_length_mm)),
    na_in_body    = sum(is.na(body_mass_g)),
    na_in_sex     = sum(is.na(sex)),
    na_in_year    = sum(is.na(year))
)## # A tibble: 1 × 8
## species island bill_length_mm bill_depth_mm flipper_length_mm body_mass_g
## <int> <int> <int> <int> <int> <int>
## 1 0 0 2 2 2 2
## # ℹ 2 more variables: sex <int>, year <int>
# or
penguins %>%
  summarise(
    across(everything(), ~ sum(is.na(.)))
  ) %>%
  pivot_longer( cols = everything() )
## # A tibble: 8 × 2
## name value
## <chr> <int>
## 1 species 0
## 2 island 0
## 3 bill_length_mm 2
## 4 bill_depth_mm 2
## 5 flipper_length_mm 2
## 6 body_mass_g 2
## 7 sex 11
## 8 year 040.3.2 每个类型变量下有多少组?
penguins %>%
  summarise(
    distinct_species = n_distinct(species),
    distinct_island  = n_distinct(island),
    distinct_sex     = n_distinct(sex)
  )
## # A tibble: 1 × 3
## distinct_species distinct_island distinct_sex
## <int> <int> <int>
## 1 3 3 3## # A tibble: 1 × 3
## species island sex
## <int> <int> <int>
## 1 3 3 340.3.3 多列多个统计函数
penguins %>%
  group_by(species) %>%
  summarise(
    length_mean  = mean(bill_length_mm, na.rm = TRUE),
    length_sd    = sd(bill_length_mm, na.rm = TRUE),
    depth_mean   = mean(bill_depth_mm, na.rm = TRUE),
    depth_sd     = sd(bill_depth_mm, na.rm = TRUE),
    flipper_mean = mean(flipper_length_mm, na.rm = TRUE),
    flipper_sd   = sd(flipper_length_mm, na.rm = TRUE),
    n            = n()
  )
## # A tibble: 3 × 8
## species length_mean length_sd depth_mean depth_sd flipper_mean flipper_sd
## <fct> <dbl> <dbl> <dbl> <dbl> <dbl> <dbl>
## 1 Adelie 38.8 2.66 18.3 1.22 190. 6.54
## 2 Chinstrap 48.8 3.34 18.4 1.14 196. 7.13
## 3 Gentoo 47.5 3.08 15.0 0.981 217. 6.48
## # ℹ 1 more variable: n <int>
# using across()
penguins %>%
  group_by(species) %>%
  summarise(
    across(ends_with("_mm"), list(mean = mean, sd = sd), na.rm = TRUE),
    n = n()
  )
## # A tibble: 3 × 8
## species bill_length_mm_mean bill_length_mm_sd bill_depth_mm_mean
## <fct> <dbl> <dbl> <dbl>
## 1 Adelie 38.8 2.66 18.3
## 2 Chinstrap 48.8 3.34 18.4
## 3 Gentoo 47.5 3.08 15.0
## # ℹ 4 more variables: bill_depth_mm_sd <dbl>, flipper_length_mm_mean <dbl>,
## # flipper_length_mm_sd <dbl>, n <int>40.3.4 不同分组下数据变量的多个分位数
事实上,这里是across()与summarise()的强大结合起来
penguins %>%
  group_by(species, island) %>%
  summarise(
    prob    = c(.25, .75),
    length  = quantile(bill_length_mm, prob, na.rm = TRUE),
    depth   = quantile(bill_depth_mm, prob, na.rm = TRUE),
    flipper = quantile(flipper_length_mm, prob, na.rm = TRUE)
  )
## # A tibble: 10 × 6
## # Groups: species, island [5]
## species island prob length depth flipper
## <fct> <fct> <dbl> <dbl> <dbl> <dbl>
## 1 Adelie Biscoe 0.25 37.7 17.6 185.
## 2 Adelie Biscoe 0.75 40.7 19.0 193
## 3 Adelie Dream 0.25 36.8 17.5 185
## 4 Adelie Dream 0.75 40.4 18.8 193
## 5 Adelie Torgersen 0.25 36.7 17.4 187
## 6 Adelie Torgersen 0.75 41.1 19.2 195
## 7 Chinstrap Dream 0.25 46.3 17.5 191
## 8 Chinstrap Dream 0.75 51.1 19.4 201
## 9 Gentoo Biscoe 0.25 45.3 14.2 212
## 10 Gentoo Biscoe 0.75 49.6 15.7 221
# using across()
penguins %>%
  group_by(species, island) %>%
  summarise(
    prob = c(.25, .75),
    across(
      c(bill_length_mm, bill_depth_mm, flipper_length_mm),
      ~ quantile(., prob, na.rm = TRUE)
    )
  )
## # A tibble: 10 × 6
## # Groups: species, island [5]
## species island prob bill_length_mm bill_depth_mm flipper_length_mm
## <fct> <fct> <dbl> <dbl> <dbl> <dbl>
## 1 Adelie Biscoe 0.25 37.7 17.6 185.
## 2 Adelie Biscoe 0.75 40.7 19.0 193
## 3 Adelie Dream 0.25 36.8 17.5 185
## 4 Adelie Dream 0.75 40.4 18.8 193
## 5 Adelie Torgersen 0.25 36.7 17.4 187
## 6 Adelie Torgersen 0.75 41.1 19.2 195
## 7 Chinstrap Dream 0.25 46.3 17.5 191
## 8 Chinstrap Dream 0.75 51.1 19.4 201
## 9 Gentoo Biscoe 0.25 45.3 14.2 212
## 10 Gentoo Biscoe 0.75 49.6 15.7 221
# or
penguins %>%
  group_by(species, island) %>%
  summarise(
    prob = c(.25, .75),
    across(where(is.numeric) & !year, ~ quantile(., prob, na.rm = TRUE))
  )
## # A tibble: 10 × 7
## # Groups: species, island [5]
## species island prob bill_length_mm bill_depth_mm flipper_length_mm
## <fct> <fct> <dbl> <dbl> <dbl> <dbl>
## 1 Adelie Biscoe 0.375 37.7 17.6 185.
## 2 Adelie Biscoe 0.625 40.7 19.0 193
## 3 Adelie Dream 0.375 36.8 17.5 185
## 4 Adelie Dream 0.625 40.4 18.8 193
## 5 Adelie Torgersen 0.375 36.7 17.4 187
## 6 Adelie Torgersen 0.625 41.1 19.2 195
## 7 Chinstrap Dream 0.375 46.3 17.5 191
## 8 Chinstrap Dream 0.625 51.1 19.4 201
## 9 Gentoo Biscoe 0.375 45.3 14.2 212
## 10 Gentoo Biscoe 0.625 49.6 15.7 221
## # ℹ 1 more variable: body_mass_g <dbl>40.3.5 不同分组下更复杂的统计
# using across()
penguins %>%
  group_by(species) %>%
  summarise(
    n = n(),
    across(starts_with("bill_"), mean, na.rm = TRUE),
    Area = mean(bill_length_mm * bill_depth_mm, na.rm = TRUE),
    across(ends_with("_g"), mean, na.rm = TRUE),
  )
## # A tibble: 3 × 6
## species n bill_length_mm bill_depth_mm Area body_mass_g
## <fct> <int> <dbl> <dbl> <dbl> <dbl>
## 1 Adelie 152 38.8 18.3 712. 3701.
## 2 Chinstrap 68 48.8 18.4 900. 3733.
## 3 Gentoo 124 47.5 15.0 712. 5076.40.3.6 数据标准化处理
std <- function(x) {
  (x - mean(x, na.rm = TRUE)) / sd(x, na.rm = TRUE)
}

# using across()
penguins %>%
  summarise(
    across(where(is.numeric), std),
    across(where(is.character), as.factor)
  )
## # A tibble: 344 × 5
## bill_length_mm bill_depth_mm flipper_length_mm body_mass_g year
## <dbl> <dbl> <dbl> <dbl> <dbl>
## 1 -0.883 0.784 -1.42 -0.563 -1.26
## 2 -0.810 0.126 -1.06 -0.501 -1.26
## 3 -0.663 0.430 -0.421 -1.19 -1.26
## 4 NA NA NA NA -1.26
## 5 -1.32 1.09 -0.563 -0.937 -1.26
## 6 -0.847 1.75 -0.776 -0.688 -1.26
## 7 -0.920 0.329 -1.42 -0.719 -1.26
## 8 -0.865 1.24 -0.421 0.590 -1.26
## 9 -1.80 0.480 -0.563 -0.906 -1.26
## 10 -0.352 1.54 -0.776 0.0602 -1.26
## # ℹ 334 more rows
# using across() and purrr style
penguins %>%
  drop_na() %>%
  summarise(
    across(starts_with("bill_"), ~ (.x - mean(.x)) / sd(.x))
  )
## # A tibble: 333 × 2
## bill_length_mm bill_depth_mm
## <dbl> <dbl>
## 1 -0.895 0.780
## 2 -0.822 0.119
## 3 -0.675 0.424
## 4 -1.33 1.08
## 5 -0.858 1.74
## 6 -0.931 0.323
## 7 -0.876 1.24
## 8 -0.529 0.221
## 9 -0.986 2.05
## 10 -1.72 2.00
## # ℹ 323 more rows40.3.7 数据对数化处理
# using across()
penguins %>%
  drop_na() %>%
  mutate(
    across(where(is.numeric), log),
    across(where(is.character), as.factor)
  )
## # A tibble: 333 × 8
## species island bill_length_mm bill_depth_mm flipper_length_mm body_mass_g
## <fct> <fct> <dbl> <dbl> <dbl> <dbl>
## 1 Adelie Torgersen 3.67 2.93 5.20 8.23
## 2 Adelie Torgersen 3.68 2.86 5.23 8.24
## 3 Adelie Torgersen 3.70 2.89 5.27 8.09
## 4 Adelie Torgersen 3.60 2.96 5.26 8.15
## 5 Adelie Torgersen 3.67 3.03 5.25 8.20
## 6 Adelie Torgersen 3.66 2.88 5.20 8.20
## 7 Adelie Torgersen 3.67 2.98 5.27 8.45
## 8 Adelie Torgersen 3.72 2.87 5.20 8.07
## 9 Adelie Torgersen 3.65 3.05 5.25 8.24
## 10 Adelie Torgersen 3.54 3.05 5.29 8.39
## # ℹ 323 more rows
## # ℹ 2 more variables: sex <fct>, year <dbl>
# using across()
penguins %>%
  drop_na() %>%
  mutate(
    across(where(is.numeric), .fns = list(log = log), .names = "{.fn}_{.col}"),
    across(where(is.character), as.factor)
  )
## # A tibble: 333 × 13
## species island bill_length_mm bill_depth_mm flipper_length_mm body_mass_g
## <fct> <fct> <dbl> <dbl> <int> <int>
## 1 Adelie Torgersen 39.1 18.7 181 3750
## 2 Adelie Torgersen 39.5 17.4 186 3800
## 3 Adelie Torgersen 40.3 18 195 3250
## 4 Adelie Torgersen 36.7 19.3 193 3450
## 5 Adelie Torgersen 39.3 20.6 190 3650
## 6 Adelie Torgersen 38.9 17.8 181 3625
## 7 Adelie Torgersen 39.2 19.6 195 4675
## 8 Adelie Torgersen 41.1 17.6 182 3200
## 9 Adelie Torgersen 38.6 21.2 191 3800
## 10 Adelie Torgersen 34.6 21.1 198 4400
## # ℹ 323 more rows
## # ℹ 7 more variables: sex <fct>, year <int>, log_bill_length_mm <dbl>,
## # log_bill_depth_mm <dbl>, log_flipper_length_mm <dbl>,
## # log_body_mass_g <dbl>, log_year <dbl>40.3.8 案例:小于0的值,替换成NA
test %>%
  mutate(
    across(contains("Confirmed"), ~if_else(.x < 0, NA_real_, .x), .names = "res_{.col}")
  )
## # A tibble: 3 × 4
## Staff.Confirmed Residents.Confirmed res_Staff.Confirmed res_Residents.Confir…¹
## <dbl> <dbl> <dbl> <dbl>
## 1 0 12 0 12
## 2 1 -192 1 NA
## 3 -999 0 NA 0
## # ℹ abbreviated name: ¹res_Residents.Confirmed或者
na_if_negative <- function(x) {
  x[x < 0] <- NA
  x
}

test %>%
  mutate(
    across(contains("Confirmed"), na_if_negative, .names = "res_{.col}")
  )
## # A tibble: 3 × 4
## Staff.Confirmed Residents.Confirmed res_Staff.Confirmed res_Residents.Confir…¹
## <dbl> <dbl> <dbl> <dbl>
## 1 0 12 0 12
## 2 1 -192 1 NA
## 3 -999 0 NA 0
## # ℹ abbreviated name: ¹res_Residents.Confirmed
40.3.9 在分组建模中与cur_data()配合使用
penguins %>%
  group_by(species) %>%
  summarise(
    broom::tidy(lm(bill_length_mm ~ bill_depth_mm, data = cur_data()))
  )
## # A tibble: 6 × 6
## # Groups: species [3]
## species term estimate std.error statistic p.value
## <fct> <chr> <dbl> <dbl> <dbl> <dbl>
## 1 Adelie (Intercept) 23.1 3.03 7.60 3.01e-12
## 2 Adelie bill_depth_mm 0.857 0.165 5.19 6.67e- 7
## 3 Chinstrap (Intercept) 13.4 5.06 2.66 9.92e- 3
## 4 Chinstrap bill_depth_mm 1.92 0.274 7.01 1.53e- 9
## 5 Gentoo (Intercept) 17.2 3.28 5.25 6.60e- 7
## 6 Gentoo bill_depth_mm 2.02 0.219 9.24 1.02e-15
penguins %>%
  group_by(species) %>%
  summarise(
    broom::tidy(lm(bill_length_mm ~ ., data = cur_data() %>% select(is.numeric)))
  )
## # A tibble: 15 × 6
## # Groups: species [3]
## species term estimate std.error statistic p.value
## <fct> <chr> <dbl> <dbl> <dbl> <dbl>
## 1 Adelie (Intercept) -275. 509. -0.539 0.590
## 2 Adelie bill_depth_mm 0.270 0.192 1.40 0.163
## 3 Adelie flipper_length_mm 0.0251 0.0350 0.717 0.474
## 4 Adelie body_mass_g 0.00262 0.000525 4.98 0.00000174
## 5 Adelie year 0.147 0.255 0.576 0.566
## 6 Chinstrap (Intercept) -420. 824. -0.509 0.612
## 7 Chinstrap bill_depth_mm 1.58 0.376 4.20 0.0000862
## 8 Chinstrap flipper_length_mm 0.0167 0.0682 0.244 0.808
## 9 Chinstrap body_mass_g 0.00143 0.00115 1.24 0.219
## 10 Chinstrap year 0.215 0.412 0.520 0.605
## 11 Gentoo (Intercept) -625. 510. -1.23 0.223
## 12 Gentoo bill_depth_mm 0.589 0.315 1.87 0.0640
## 13 Gentoo flipper_length_mm 0.132 0.0458 2.89 0.00459
## 14 Gentoo body_mass_g 0.00204 0.000607 3.36 0.00105
## 15 Gentoo year 0.311 0.255 1.22 0.224
penguins %>%
  group_by(species) %>%
  summarise(
    broom::tidy(lm(bill_length_mm ~ .,
                data = cur_data() %>% transmute(across(is.numeric))
    ))
  )
## # A tibble: 15 × 6
## # Groups: species [3]
## species term estimate std.error statistic p.value
## <fct> <chr> <dbl> <dbl> <dbl> <dbl>
## 1 Adelie (Intercept) -275. 509. -0.539 0.590
## 2 Adelie bill_depth_mm 0.270 0.192 1.40 0.163
## 3 Adelie flipper_length_mm 0.0251 0.0350 0.717 0.474
## 4 Adelie body_mass_g 0.00262 0.000525 4.98 0.00000174
## 5 Adelie year 0.147 0.255 0.576 0.566
## 6 Chinstrap (Intercept) -420. 824. -0.509 0.612
## 7 Chinstrap bill_depth_mm 1.58 0.376 4.20 0.0000862
## 8 Chinstrap flipper_length_mm 0.0167 0.0682 0.244 0.808
## 9 Chinstrap body_mass_g 0.00143 0.00115 1.24 0.219
## 10 Chinstrap year 0.215 0.412 0.520 0.605
## 11 Gentoo (Intercept) -625. 510. -1.23 0.223
## 12 Gentoo bill_depth_mm 0.589 0.315 1.87 0.0640
## 13 Gentoo flipper_length_mm 0.132 0.0458 2.89 0.00459
## 14 Gentoo body_mass_g 0.00204 0.000607 3.36 0.00105
## 15 Gentoo year 0.311 0.255 1.22 0.224
penguins %>%
  group_by(species) %>%
  summarise(
    broom::tidy(lm(bill_length_mm ~ ., data = across(is.numeric)))
  )
## # A tibble: 15 × 6
## # Groups: species [3]
## species term estimate std.error statistic p.value
## <fct> <chr> <dbl> <dbl> <dbl> <dbl>
## 1 Adelie (Intercept) -275. 509. -0.539 0.590
## 2 Adelie bill_depth_mm 0.270 0.192 1.40 0.163
## 3 Adelie flipper_length_mm 0.0251 0.0350 0.717 0.474
## 4 Adelie body_mass_g 0.00262 0.000525 4.98 0.00000174
## 5 Adelie year 0.147 0.255 0.576 0.566
## 6 Chinstrap (Intercept) -420. 824. -0.509 0.612
## 7 Chinstrap bill_depth_mm 1.58 0.376 4.20 0.0000862
## 8 Chinstrap flipper_length_mm 0.0167 0.0682 0.244 0.808
## 9 Chinstrap body_mass_g 0.00143 0.00115 1.24 0.219
## 10 Chinstrap year 0.215 0.412 0.520 0.605
## 11 Gentoo (Intercept) -625. 510. -1.23 0.223
## 12 Gentoo bill_depth_mm 0.589 0.315 1.87 0.0640
## 13 Gentoo flipper_length_mm 0.132 0.0458 2.89 0.00459
## 14 Gentoo body_mass_g 0.00204 0.000607 3.36 0.00105
## 15 Gentoo year 0.311 0.255 1.22 0.224
40.3.10 与cur_column()配合使用
每一列乘以各自的系数
df   <- tibble(x = 1:3, y = 3:5, z = 5:7)
mult <- list(x = 1, y = 10, z = 100)

df %>%
  mutate(across(all_of(names(mult)), ~ .x * mult[[cur_column()]]))
## # A tibble: 3 × 3
## x y z
## <dbl> <dbl> <dbl>
## 1 1 30 500
## 2 2 40 600
## 3 3 50 700每一列乘以各自的权重
df      <- tibble(x = 1:3, y = 3:5, z = 5:7)
weights <- list(x = 0.2, y = 0.3, z = 0.5)

df %>%
  mutate(
    across(all_of(names(weights)),
           list(wt = ~ .x * weights[[cur_column()]]),
          .names = "{col}.{fn}"
    )
  )
## # A tibble: 3 × 6
## x y z x.wt y.wt z.wt
## <int> <int> <int> <dbl> <dbl> <dbl>
## 1 1 3 5 0.2 0.9 2.5
## 2 2 4 6 0.4 1.2 3
## 3 3 5 7 0.6 1.5 3.5每一列有各自的阈值,如果在阈值之上为1,否则为 0
df      <- tibble(x = 1:3, y = 3:5, z = 5:7)
cutoffs <- list(x = 2, y = 3, z = 7)

df %>% mutate(
  across(all_of(names(cutoffs)), ~ if_else(.x > cutoffs[[cur_column()]], 1, 0))
)
## # A tibble: 3 × 3
## x y z
## <dbl> <dbl> <dbl>
## 1 0 0 0
## 2 0 1 0
## 3 1 1 0- 来一个案例
# 要求 x1_intercept + x1_value * x1_slope  --> x1_yhat
# 要求 x2_intercept + x2_value * x2_slope  --> x2_yhat

library(stringr)

df <- tibble(
  x1_intercept = c(0.1850, 0.1518), x2_intercept = c(0.2109, 0.3370),
  x1_value = c(0.0098, 0.0062), x2_value = c(0.0095, 0.0060),
  x1_slope = c(0.1234, 0.1241), x2_slope = c(0.1002, 0.3012),
)
df
## # A tibble: 2 × 6
## x1_intercept x2_intercept x1_value x2_value x1_slope x2_slope
## <dbl> <dbl> <dbl> <dbl> <dbl> <dbl>
## 1 0.185 0.211 0.0098 0.0095 0.123 0.100
## 2 0.152 0.337 0.0062 0.006 0.124 0.301
df %>%
  mutate(
    across(
      .cols = ends_with("_intercept"),
      .fns = ~ . + get(str_replace(cur_column(), "intercept", "value")) *
        get(str_replace(cur_column(), "intercept", "slope")),
      .names = "{.col}_yhat"
    )
  ) %>%
  rename_with( ~ str_remove(., "_intercept"), ends_with("_yhat"))
## # A tibble: 2 × 8
## x1_intercept x2_intercept x1_value x2_value x1_slope x2_slope x1_yhat x2_yhat
## <dbl> <dbl> <dbl> <dbl> <dbl> <dbl> <dbl> <dbl>
## 1 0.185 0.211 0.0098 0.0095 0.123 0.100 0.186 0.212
## 2 0.152 0.337 0.0062 0.006 0.124 0.301 0.153 0.339- 再来一个案例
df <- tibble(
  var_A_baseline = c(1, 2, 3, 4, 5),
  var_B_baseline = c(4, 1, 2, 3, 5),
  var_A_followup = c(3, 5, 4, 1, 2),
  var_B_followup = c(2, 5, 1, 3, 4)
)

# 需求 var_*_followup -  var_*_baseline

df %>%
  mutate(
    across(
      ends_with("_followup"),
      ~ . - get(sub("_followup", "_baseline", cur_column()))
    )
  )
## # A tibble: 5 × 4
## var_A_baseline var_B_baseline var_A_followup var_B_followup
## <dbl> <dbl> <dbl> <dbl>
## 1 1 4 2 -2
## 2 2 1 3 4
## 3 3 2 1 -1
## 4 4 3 -3 0
## 5 5 5 -3 -140.3.11 .names参数也可用函数
penguins %>%
  summarise(
    across(starts_with("bill"),
           .fns = list(mean = ~ mean(.x, na.rm = TRUE)),
           .names = "{.col}_{.fn}"
           )
  )
## # A tibble: 1 × 2
## bill_length_mm_mean bill_depth_mm_mean
## <dbl> <dbl>
## 1 43.9 17.2
penguins %>%
  summarise(
    across(starts_with("bill"),
           .fns = list(mean = ~ mean(.x, na.rm = TRUE)),
           .names = "{stringr::str_remove(.col, '_mm')}_{.fn}"
    )
  )
## # A tibble: 1 × 2
## bill_length_mean bill_depth_mean
## <dbl> <dbl>
## 1 43.9 17.2
40.3.12 与c_across()配合也挺默契
在一行中的占比
df <- tibble(x = 1:3, y = 3:5, z = 5:7)

df %>%
  rowwise() %>%
  mutate(total = sum(c_across(x:z))) %>%
  ungroup() %>%
  mutate(across(x:z, ~ . / total))
## # A tibble: 3 × 4
## x y z total
## <dbl> <dbl> <dbl> <int>
## 1 0.111 0.333 0.556 9
## 2 0.167 0.333 0.5 12
## 3 0.2 0.333 0.467 15更神奇的方法,请看第 43 章。
40.3.13 案例:替换一行中最大的值
看一行中哪个最大,最大的变为1,其余的变为0
df## # A tibble: 3 × 3
## x y z
## <int> <int> <int>
## 1 1 3 5
## 2 2 4 6
## 3 3 5 7
replace_rowwise_max <- function(vec) {
  if (!is.vector(vec)) {
    stop("input of replace_col_max must be vector.")
  }

  if_else(vec == max(vec), 1L, 0L)
}


df %>%
  rowwise() %>%
  mutate(
    new = list(replace_rowwise_max(c_across(everything())))
  ) %>%
  unnest_wider(new, names_sep = "_")
## # A tibble: 3 × 6
## x y z new_1 new_2 new_3
## <int> <int> <int> <int> <int> <int>
## 1 1 3 5 0 0 1
## 2 2 4 6 0 0 1
## 3 3 5 7 0 0 1
df %>%
  purrr::pmap_dfr(
    ~`[<-`( c(...), seq_along(c(...)), if_else( c(...) == max(c(...)), 1, 0 ))
  )
## # A tibble: 3 × 3
## x y z
## <dbl> <dbl> <dbl>
## 1 0 0 1
## 2 0 0 1
## 3 0 0 1最风骚的是
## # A tibble: 3 × 3
## # Rowwise:
##       x     y     z
##   <dbl> <dbl> <dbl>
## 1     0     0     1
## 2     0     0     1
## 3     0     0     1
40.4 across()总结
我们看到了,across()函数在summarise()/mutate()/transmute()/condense()中使用,它能实现以下几个功能:
- 数据框中的多列执行相同操作
- 不同性质的操作,有时可以一起写出,不用再
left_join()
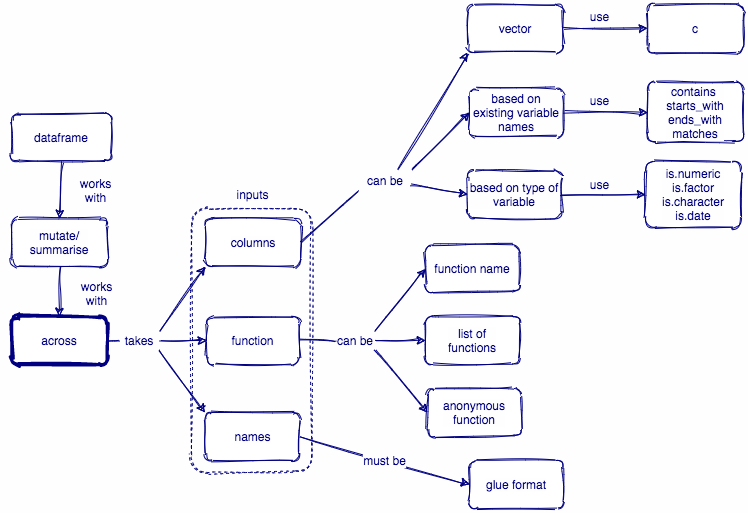
图 40.1: across()函数总结图