9.3 The Thermal Environment: Basis for the Climate Space
To describe the physical heat energy limits that an organism can tolerate, Porter and Gates (1969) began by examining the abiotic components of the environment. Four climatic factors – radiation, air temperature, wind speed and humidity – were recognized as affecting an animal’s thermal balance. The authors decided that evaporative losses would be small for many organisms and could be included as maximum and minimum rates without making the losses a function of the humidity.
Tracy (1976) has, however, shown that when investigating the thermal and mass balance of wet-skinned animals such as slugs, frogs and salamanders, the water vapor concentration of the soil and the air must be known to accurately quantify these exchanges. The climate space concept has generally not been extended to include the environmental variable of water vapor concentration. Likewise, the formulation of Porter and Gates (1969) does not consider the effects of wind direction. Nor is surface temperature of the ground explicitly indicated (but see Equation (9.3) and Appendix I for calculation of \(Q_a\)). Radiation, air temperature and wind speed, though, which are the physical factors included in the climate space concept, are the most important abiotic variables for the thermal heat balance of most terrestrial animals.
9.3.1 Absorbed radiation
The most complex of the factors Porter and Gates (1969) considered is the absorbed radiation because it is composed of several shortwave and longwave components. In general, \(Q_a\) is the product of surface absorptivity, the surface area exposed to a particular source of radiation, and the intensity of that source. This can be written: \[\begin{equation} Q_a = \bar{a}_1 A_1 S + \bar{a}_2 A_2 s + \bar{a}_3 A_3 r (S + s) + \bar{a}_4 A_4 R_g + \bar{a}_5 A_5 R_a \tag{9.2} \end{equation}\]
where- \(S\) is the radiation from direct sunlight (\(W m^{-2}\)),
- \(s\) is the radiation from scattered sunlight (\(W m^{-2}\)),
- \(R_g\) is infrared thermal radiation from the ground (\(W m^{-2}\)),
- \(R_a\) is infrared thermal radiation from the atmosphere (\(W m^{-2}\)),
- \(r\) is the reflectivity of the ground.
Since we wish to consider the average flux per unit surface area, the \(A_i\)’s are the proportions of the total surface area exposed to each kind of radiation. The \(a_i\)s are the mean absorptivities to each kind of radiation. Roseman (197, module 8) discusses absorption, reflection and transmission. In their original paper, Porter and Gates assumed that their animal was a cylinder. Equation (9.2) can then be rewritten as: \[\begin{equation} Q_a = \frac{1}{\pi} \bar{a} S + 0.5 [\bar{a}s + \bar{a}r(s+S) + R_g + R_a] \tag{9.3} \end{equation}\]
Here it is assumed that: 1) \(A_1 = 1/\pi\); 2) scattered sunlight, reflected sunlight, reflected scattered sunlight, ground radiation, and atmospheric radiation strike half the animal (see Siegel and Howell 1972 for calculation of shape factors); 3) the mean absorptivities of the sunlight, scattered sunlight and reflected light are equal to \(\bar{a}\); and 4) that the mean absorptivities of the infrared sources are 1.0.
9.3.2 Environmental Constraints
The climate space concept derives from the fact that there is a relation between the average incident radiation and the air temperature independent of the organism. It is generally true that warmer air temperatures occur with high radiation levels, i.e., summer or tropical conditions. Likewise colder air temperatures are usually correlated with lower radiation loadings. (Exceptions to this generalization are the high radiation levels in the mountainous regions of lower and middle latitudes during the summer when air temperatures can be low (Porter and Gates 1969).) Thus, we expect a positive correlation between the air temperature \(T_a\) and the absorbed radiation \(Q_a\) that the organism is exposed to in any given habitat. Initially, Porter and Gates considered a blackbody environment such as a cave or sheltered spot in thick vegetation. The relation between absorbed radiation and air temperature is given by the Stefan-Boltzmann Law and is plotted as the centerline in Figure 9.1. Next they asked what is the relationship between these two variables when an animal is exposed to a clear sky at night. Under these conditions an object will be receiving energy from the atmosphere which is at a lower temperature than the surrounding air.
Gates (1978), using an empirical relationship from Swinbank (1963) for sky radiation, shows that the total radiation absorbed by the organism is \[\begin{equation} Q_a = \frac{\bar{a}_L (R_g + R_a)}{2} = \frac{\bar{a}_L \sigma [T_g + 273]^4 + 1.22 \bar{a}_L \sigma [T_a + 273]^4 - 171 }{2} \tag{9.4} \end{equation}\]
where- \(\bar{a}_L\) = mean absorptivity to longwave radiation,
- \(\sigma\) = Stefan-Boltzmann’s constant 5.67x10⁻⁸ (\(W m^{-2} K^{-4}\)),
- \(T_g\) = ground temperature (\(^{\circ}C\)),
- \(T_a\) = air temperature (\(^{\circ}C\)),
and the other symbols are as in Equation (9.2). Gates has assumed that the \(A_i\)s are one-half in each case (Siegel and Howell 1972 show how this can be derived). As before, we will let \(\bar{a}_L = 1.0\). It is also convenient to approximate the ground temperature with the air temperature. In the early evening \(T_g > T_a\), but several hours before sunrise the reverse is true. Equation (9.4) with the aforementioned assumptions is the leftmost line plotted in Figure 9.1. This means that if an animal were out foraging under a clear sky at night at an air temperature of \(20^{\circ}C\), it would receive \(50 W m^{-2}\) less than if it were resting in a burrow.
Finally, we consider the condition when an organism is exposed to full sunlight with an absorptivity to shortwave radiation of 0.8. In this case, the radiation as a function of air temperature is given by the line to the right of the blackbody line. This line is “fuzzy” to remind us that this relationship is less well-defined than the other curves. The assumptions and calculations necessary to plot this line are discussed in Appendix I. If we now consider the difference between a blackbody and a full sunlight habitat, both at \(20^{\circ}C\) air temperature, we see that the latter would receive \(300 W m^{-2}\) more radiation.
The importance of Figure 9.1 is that we have established a region bounded by the clear sky, plus ground radiation line and the 0.8 absorptivity line that limits the combinations of \(Q_a\) and \(T_a\) found in the natural environment. This region can be divided into areas: one between the clear sky at night and blackbody line which governs the range of all nighttime conditions (\(S\) and \(s\) of Equation (9.2) are zero), and a second area enclosed by the blackbody and the 0.8 absorptivity lines which gives the range of most daytime conditions. The average radiation intensity can be less than blackbody levels during the day when clouds prevent the surface from receiving shortwave radiation. To see this we need to compute the absorbed radiation in the open, \(Q_{a0}\), and compare it to that absorbed in a blackbody cavity, \(Q_{ac}\). If solar radiation is zero (\(S = s = 0\)) then Equation (9.3) reduces to \(Q_{a0} = \frac{(R_a + R_g)}{2}\). We assume that the surface temperature is equal to the air temperature and the temperature at the base of the clouds is less than air temperature so \(R_a < R_g\) and \(Q_{a0} < Q_{ac}\). In this case, the higher the clouds the cooler the radiating surface of their bases. This radiation, however, will always be greater than the radiation from a clear sky at night.
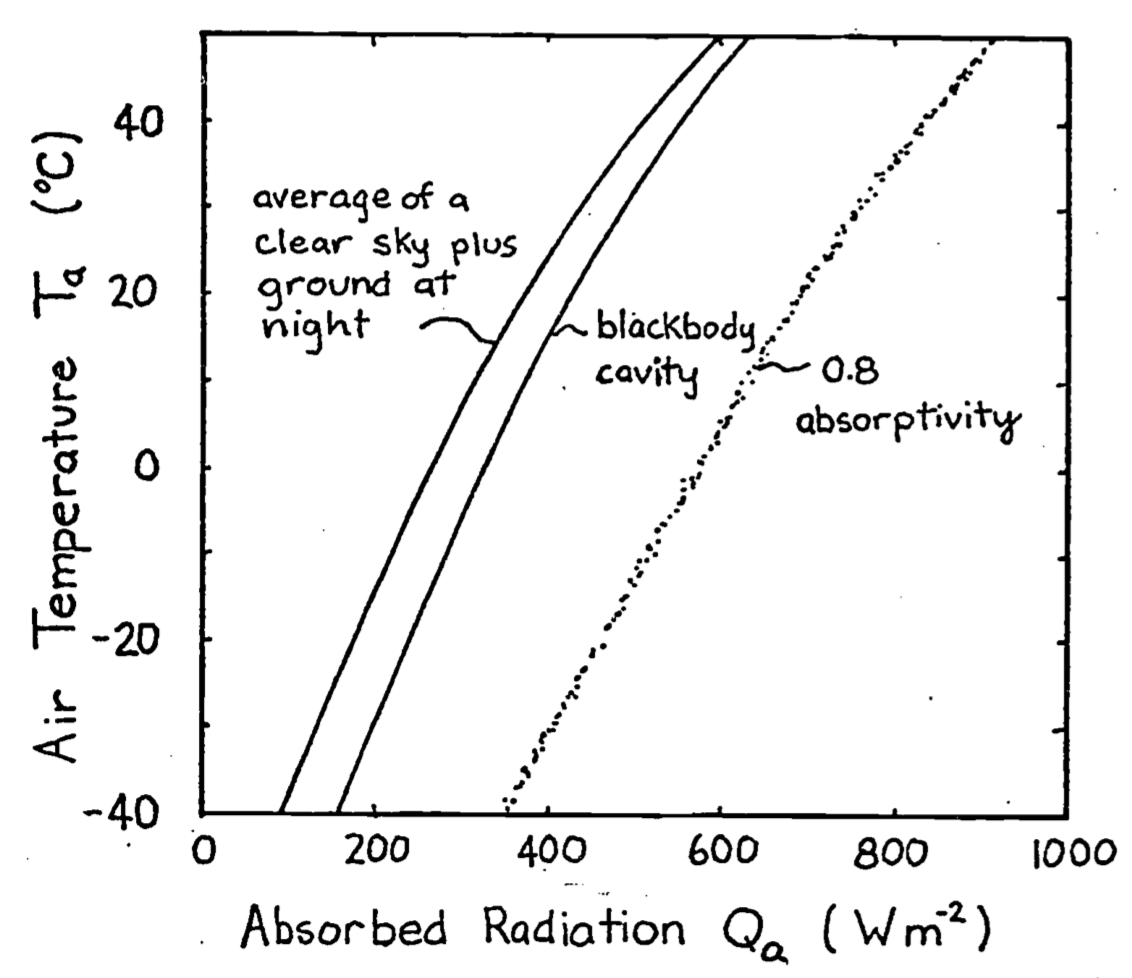
Figure 9.1: Relationship between the total amount of radiation flux incident on an object as a function of the air temperature. At night the object receives thermal radiation from the ground and atmosphere. In the daytime the object receives direct, reflected and scattered sunlight, in addition to the thermal radiation from the ground and atmosphere. The absorptivity to sunlight is 0.8. The right-hand boundary line is fuzzy to remind us that it is an average value. From Porter, W. P. and D. M. Gates. 1969. p. 234.
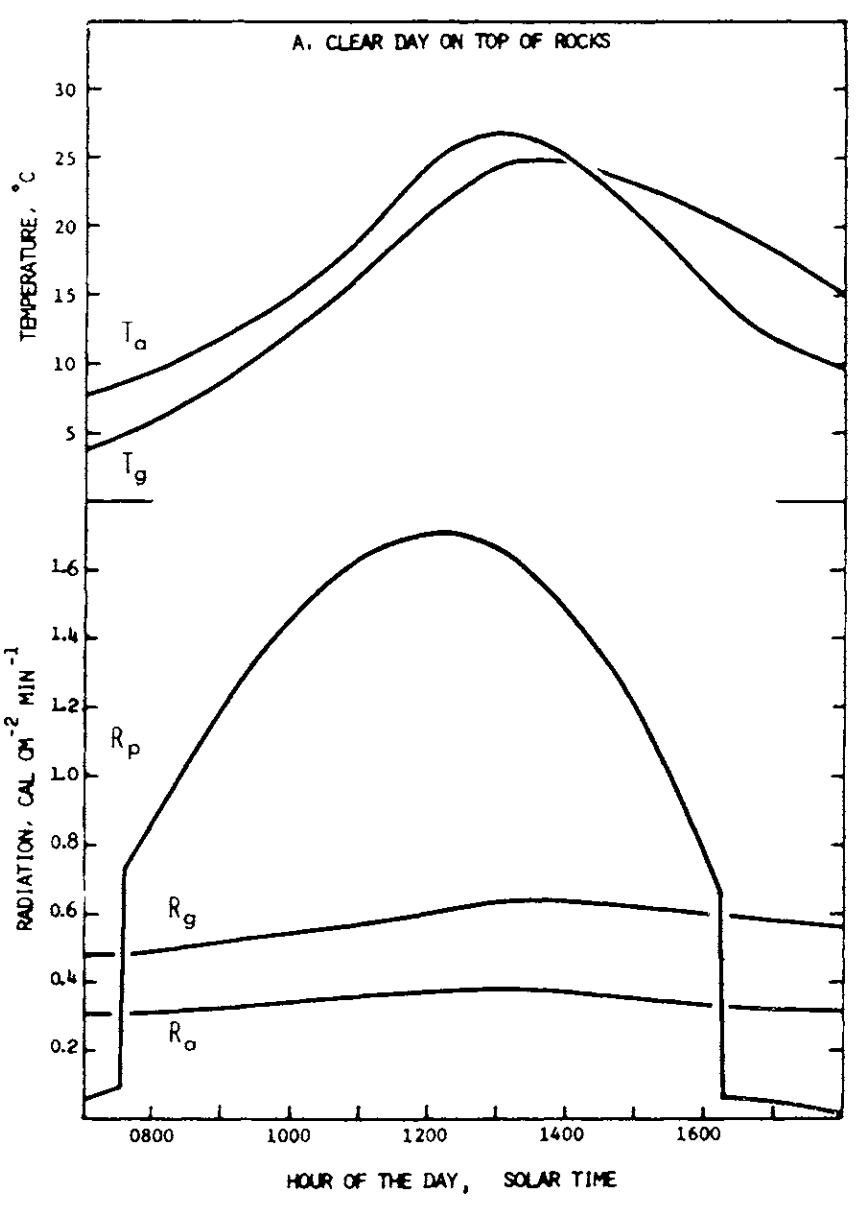
Figure 9.2: Daily variation in the radiant environment in different microhabitats under different general weather conditions. The upper portion of the figure describes daily fluctuations of air temperature (\(T_a\)) and temperature of the surface of the substrate (\(T_g\)). From Morhardt, S. S. and D. M. Gates. 1974. P. 20.
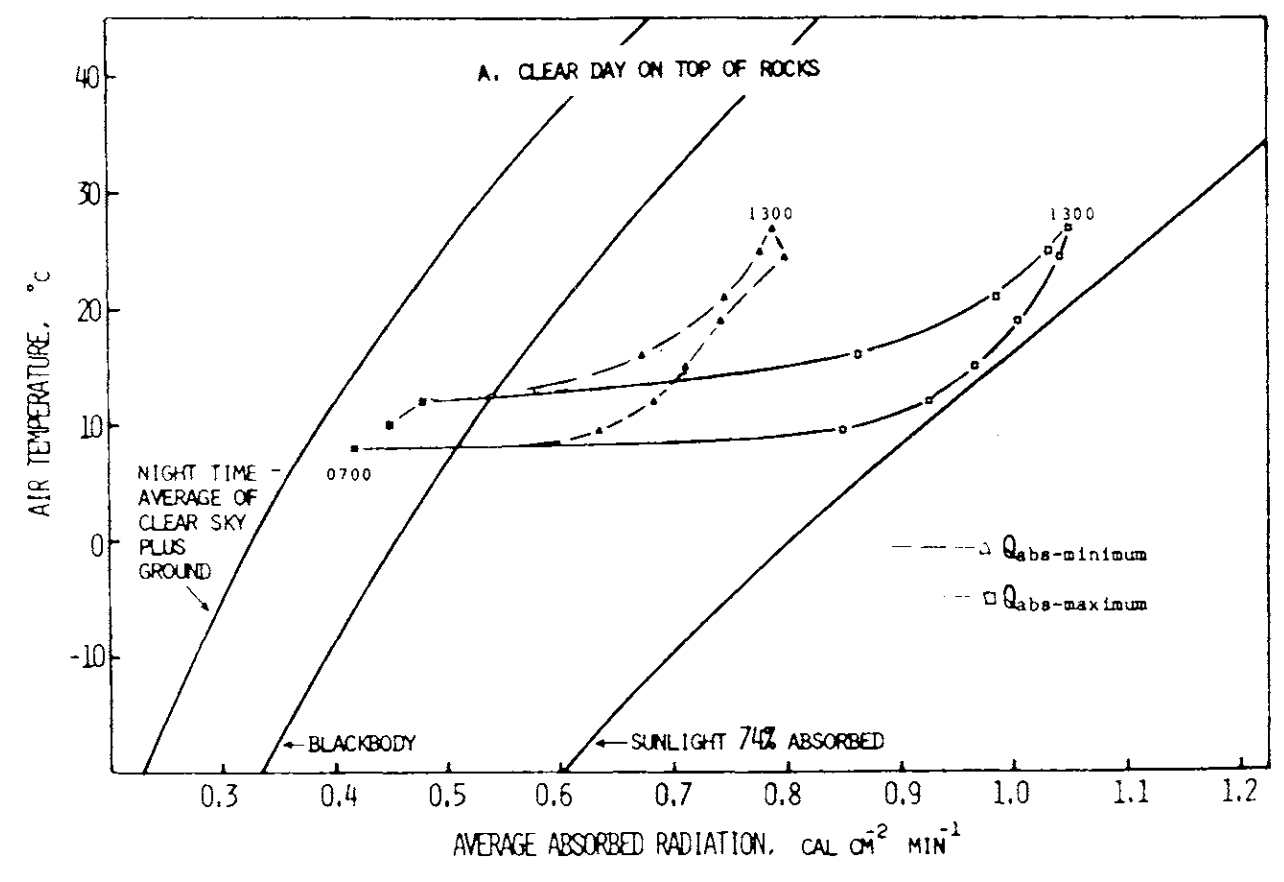
Figure 9.3: Climate diagram for the habitat. Data on these diagrams indicate the total amount of radiation that is absorbed by a geometrical model of a ground squirrel under conditons of air temperature and radiation shown in Figure 9.2. The model is oriented in two ways with respect to direct solar radiation to show how absorbed radiation differs at the same air temperature and thesame time of day with differences in orientation toward the sun. The amount of radiation absorbed is greatest (\(Q_{abs-maximum}\)) when the long axis of the model is normal to the direction of the sun and least (\(Q_{abs-minimum}\)) when the hemispherical end of the model is toward the sun. All other orientations would be intermediate between these extremes. Data points are taken directly from Figure 9.2 at hourly or half-hourly intervals and are identified at selected points by showing the hour of the day in solar time adjacent to the points. The line for sunlight 74 percent absorbed represents the maximum amount of radiation that could be absorbed by the model in direct sunlight at any air temperature. The blackbody curve-indicates the intensity of radiation from a blackbody at any air temperature, and the curve labeled “night time average of clear sky plus ground” indicates the minimum energy likely to be absorbed by the model when exposed to a night. sky radiating at a temperature which is cooler than the air. From Morhardt, S. S. and D. M. Gates. 1974. P. 25.
Morhardt and Gates (1974) have considered the temporal variation of \(Q_a\) and \(T_a\) more carefully. They measured \(T_g\), \(T_a\), \(R_p\) (\(= S + s\) on a horizontal surface), \(R_g\) and \(R_a\) hourly for a summer’s day in the Colorado mountains shown as in Figure 9.2. These values were used to calculate \(Q_a\) for the Belding ground squirrel (Citellus beldingi beldingi) from an equation similar to Equation (9.3). In Figure 9.3, pairs of \(Q_a\) and \(T_a\) are plotted as a function of time. Morhardt and Gates made similar calculations for several different microhabitats. Although there were no startling conclusions about how the animal was being influenced by thermal environment, we will consider their study further in the exercises. The next step in constructing the climate space diagram is to see how the animal is influenced by radiation, air temperature, and wind speed.