15.9 Relative Humidity
Relative humidity, similar to air temperature, is measured at 120cm and has been estimated by the microclimate model at 1cm. In the estimation, the absolute amount of water in the air has been assumed constant, and the relative humidity has been adjusted for the 1cm air temperature (remember, relative humidity is the amount of water the air is holding relative to what it could if it were saturated at that temperature, and as temperature goes up it can hold more water at saturation). Thus, we have estimates specific to soil type and shade level, as for air temperature.
Here is what the data look like at midday for each month at 120cm. You can see the strong seasonal effect in northern and southern Australia, with the humid/wet season occurring at different times of year.
month<-1 # choose which month you want, 1 or 7 (i.e. Jan or Jun)
# read the file into memory
RH120cm_jan<-brick(paste0(path,"relative_humidity_pct_120cm/RH120cm_",month,".nc"))

month<-7 # choose which month you want, 1 or 7 (i.e. Jan or Jun)
# read the file into memory
RH120cm_jul<-brick(paste0(path,"relative_humidity_pct_120cm/RH120cm_",month,".nc"))

par(mfrow = c(1,2)) # set to plot 1 row of 2 panels
plot(RH120cm_jan[[13]],main = "RH 120cm, 12:00 January, %", zlim = c(0,70))
plot(RH120cm_jul[[13]],main = "RH 120cm, 12:00 July, %", zlim = c(0,70))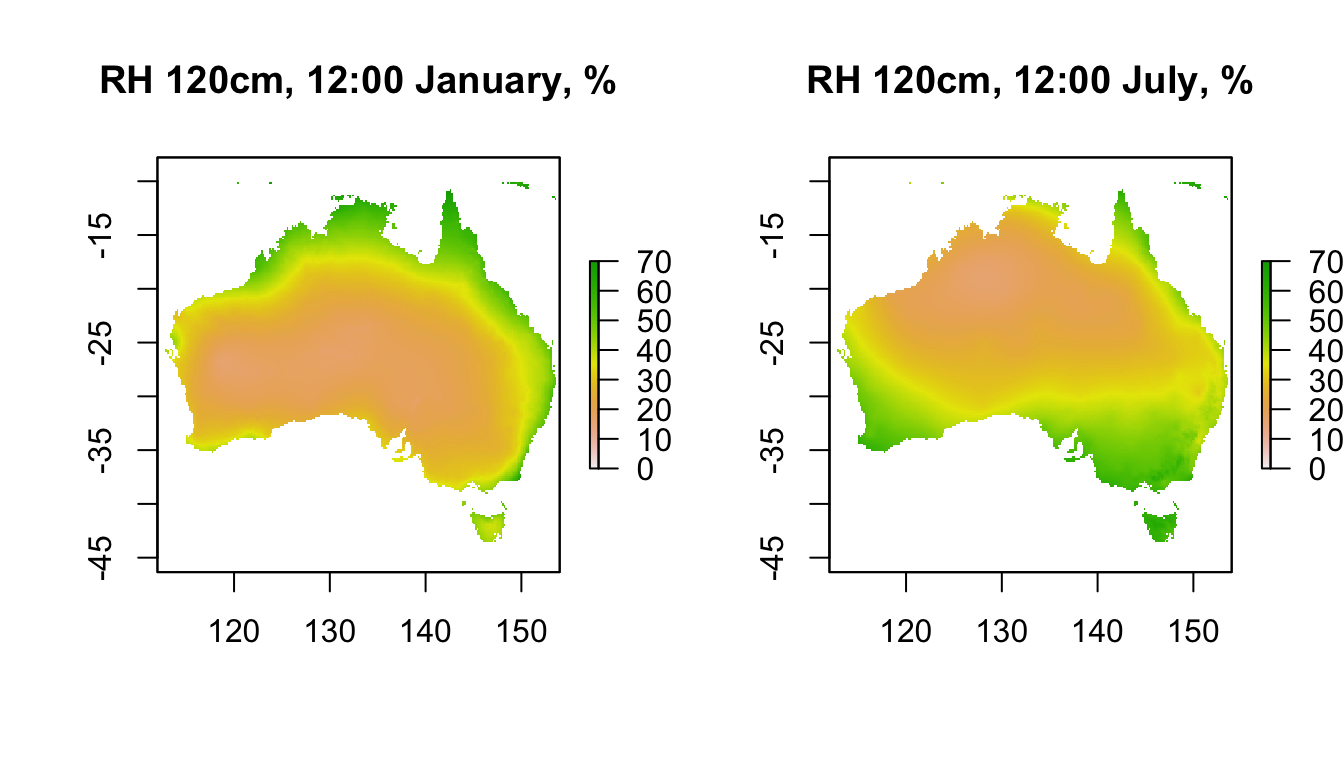
In comparison, here is the data for 1cm in 0% shade (100% shade at 1cm will be similar to 120cm, as we saw above for air temperature). Note how much lower the relative humidity is near the ground at this time of day.
month<-1 # choose which month you want, 1 or 7 (i.e. Jan or Jun)
shade <- 0 # choose which month you want, 0 or 100%
# read the file into memory
RH1cm_0shade_jan<-brick(paste0(path,"relative_humidity_pct_1cm/soil/",
                               shade,"_shade/RH1cm_soil_",shade,"_",month,".nc"))

month<-7 # choose which month you want, 1 or 7 (i.e. Jan or Jun)
# read the file into memory
RH1cm_0shade_jul<-brick(paste0(path,"relative_humidity_pct_1cm/soil/",
                               shade,"_shade/RH1cm_soil_",shade,"_",month,".nc"))

shade <- 100 # choose which month you want, 0 or 100%
# read the file into memory
RH1cm_100shade_jan<-brick(paste0(path,"relative_humidity_pct_1cm/soil/",
                                 shade,"_shade/RH1cm_soil_",shade,"_",month,".nc"))

month<-7 # choose which month you want, 1 or 7 (i.e. Jan or Jun)
# read the file into memory
RH1cm_100shade_jul<-brick(paste0(path,"relative_humidity_pct_1cm/soil/",
                                 shade,"_shade/RH1cm_soil_",shade,"_",month,".nc"))

par(mfrow = c(1,2)) # set to plot 2 rows of 2 panels
plot(RH1cm_0shade_jan[[13]],main = "RH 1cm 0% shade, 12:00 Jan, %", zlim = c(0,70))
plot(RH1cm_0shade_jul[[13]],main = "RH 1cm 0% shade, 12:00 Jul, %", zlim = c(0,70))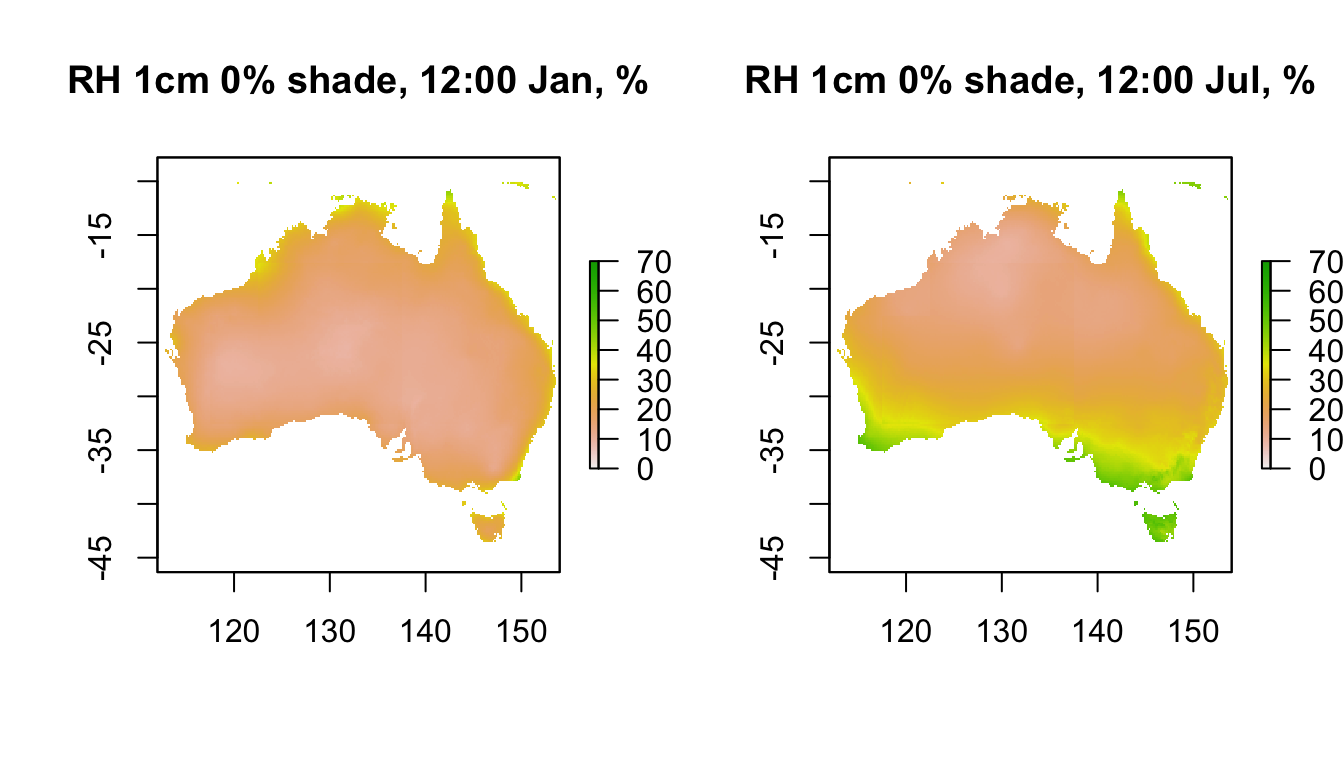
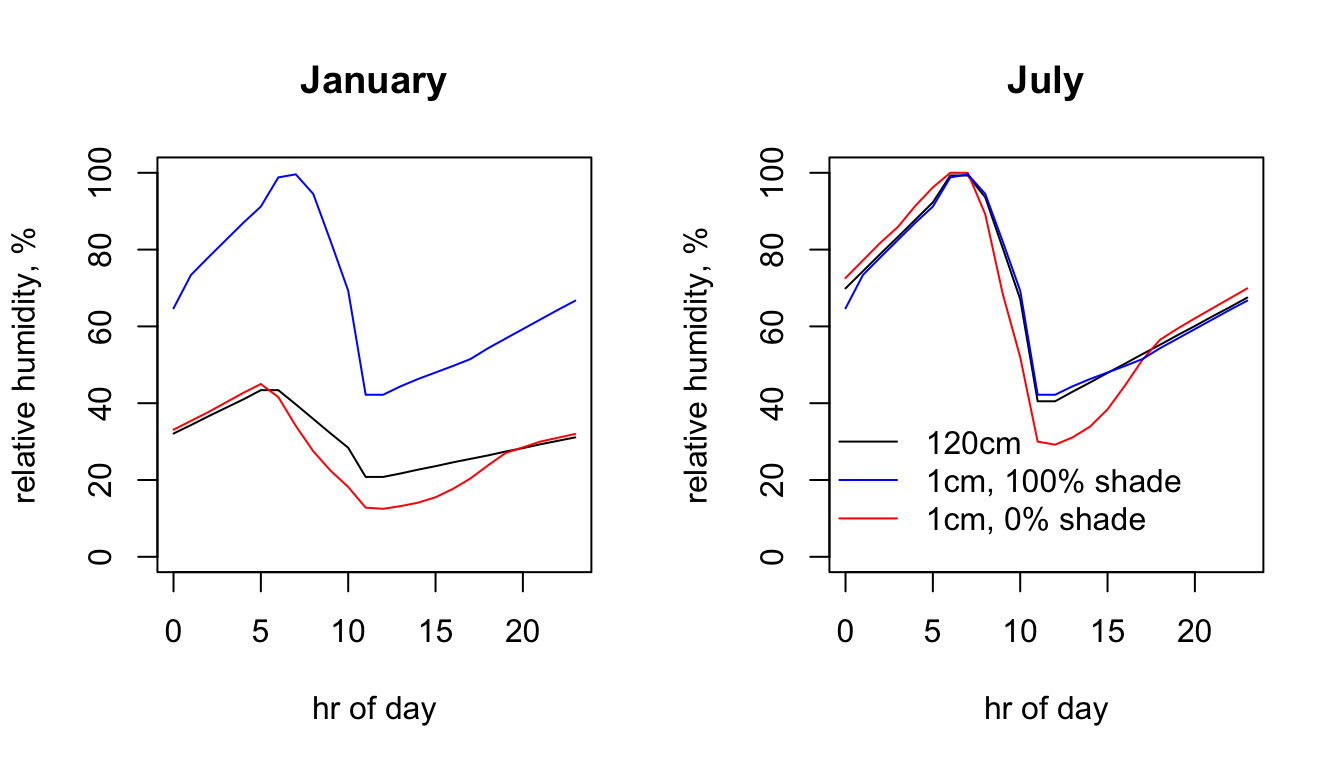
Here is the 24hr profile for relative humidity at the Flinders Ranges site.
# extract data for all layers in 'RH120cm_jan' at location 'lon.lat'
RH120cm_jan.hr = t(extract(RH120cm_jan, lon.lat))

# extract data for all layers in 'RH120cm_jul' at location 'lon.lat'
RH120cm_jul.hr = t(extract(RH120cm_jul, lon.lat))

# extract data for all layers in 'RH1cm_0shade_jan' at location 'lon.lat'
RH1cm_0shade_jan.hr = t(extract(RH1cm_0shade_jan, lon.lat))

# extract data for all layers in 'RH1cm_0shade_jul' at location 'lon.lat'
RH1cm_0shade_jul.hr = t(extract(RH1cm_0shade_jul, lon.lat))

# extract data for all layers in 'RH1cm_100shade_jan' at location 'lon.lat'
RH1cm_100shade_jan.hr = t(extract(RH1cm_100shade_jan, lon.lat))

# extract data for all layers in 'RH1cm_100shade_jul' at location 'lon.lat'
RH1cm_100shade_jul.hr = t(extract(RH1cm_100shade_jul, lon.lat))

par(mfrow = c(1,2)) # set to plot 1 row of 2 panels
# plot relative humidity at 120cm in January as a function of hour,
# as a line graph (using type = 'l'), in black
plot(RH120cm_jan.hr ~ hrs, type = 'l', main = "January", ylab = "relative humidity, %",
     xlab = "hr of day", col = 'black', ylim = c(0,100))
# plot relative humidity at 1cm in 0% shade in January as a function of hour,
# as a line graph (using type = 'l'), in red.
points(RH1cm_0shade_jan.hr ~ hrs, type = 'l', col = 'red')
# plot relative humidity at 1cm in 100% shade January as a function of hour,
# as a line graph (using type = 'l'), in blue.
points(RH1cm_100shade_jan.hr ~ hrs, type = 'l', col = 'blue')

# plot relative humidity at 120cm in July as a function of hour,
# as a line graph (using type = 'l'), in black
plot(RH120cm_jul.hr ~ hrs, type = 'l', main = "July", ylab = "relative humidity, %",
     xlab = "hr of day", col = 'black', ylim = c(0,100))
# plot relative humidity at 1cm in 0% shade in July as a function of hour,
# as a line graph (using type = 'l'), in red.
points(RH1cm_0shade_jul.hr ~ hrs, type = 'l', col = 'red')
# plot relative humidity at 1cm in 100% shade July as a function of hour,
# as a line graph (using type = 'l'), in blue.
points(RH1cm_100shade_jul.hr ~ hrs, type = 'l', col = 'blue')

legend(-2, 40, c("120cm", "1cm, 100% shade", "1cm, 0% shade"), col = c("black", "blue", "red"),
       lty=c(1, 1, 1), bty = "n")