7.2 Introduction
The purpose of this module is to further elucidate the physics of the heat transfer processes: radiation, evaporation, conduction, and convection. An understanding of these processes and their interactions will provide a clearer ecological interpretation of the thermal energy environment. Two ideas need to be recalled about the First Law of Thermodynamics (Zemansky and Van Ness 1966, Stevenson 1979a): first, that the heat energy budget is based on the conservation principle of the First Law, and second, that this law can be applied to any system of arbitrary boundaries. Although organisms seem a natural choice, Collins et al. (1971) have found the nasal passageway to be a useful system for study of nasal vapor recovery. In a previous module (Stevenson 1979b), we considered a stream, a leaf, and a spider as well defined thermodynamic systems for understanding the biological importance of heat fluxes.
Before we begin to describe the mechanisms of heat transfer, four examples are taken from the ecological literature to emphasize the biological effects of temperature and energy budgets. As the examples are presented, the reader should ask: how does the thermal environment influence the distribution, abundance, and life history strategies of the organism being described?
Boylen and Brock (1973) have studied the benthic algae of the Firehole River in Yellowstone National Park. They were interested in documenting the effects of the heated water entering the river from geysers. The Firehole was coldest during June when the discharge was largest from the snowmelt. Diatoms in the genera Nitzchia, Snydedia, Rhopalodia, Cocconeis, and Comphonema were present at the sampling stations with cooler water temperatures, while green algae, Spirogyra, Oedogonium, Cladophora, and StigeocZonium, were dominant at the warmer stations. Biomass was 15 times larger and growth rates five times greater in the heated than the unheated section of the river. Boylen and Brock feel that the Firehole River represents a unique opportunity to study the biological consequences of elevated water temperature, which are similar to the increases caused by power plants.
The acquisition of nutrients is of fundamental importance to plants. Chapman (1974) studied the absorption of phosphate along thermal gradients, where: 1) the average soil temperature changed and the variability was constant; and 2) where the mean was the same but the fluctuation or variability was changing. The maximum rate of phosphate absorption was found to correlate well with the mean soil temperature for each species. He found that cold-adapted species also increased the root-to-shoot ratio presumably in order to compensate for the slower absorption rates at colder temperatures. Species from fluctuating environments showed a greater rate of acclimation to phosphate absorption than did species from more constant environments. These results suggest that plants from different environments try to maintain similar phosphate uptake rates, which is accomplished with different physiological adaptations, and that plants can partition their energy resources (root and shoot biomass) to achieve this balance.
Our third example concerns temperature adaptations in amphibians. Snyder and Weathers (1975) hypothesized that the variability tolerated in body temperatures of amphibian species would be correlated with the variability in air temperatures. To test this idea, the difference between the maximum and lower lethal body temperature for 11 species was taken from the literature and plotted against the difference in the high and low mean monthly air temperatures for a 10-yr period. Figure 7.1 presents their results and is consistent with their hypothesis.
It is sometimes useful to take a more general outlook. In that spirit, here are six ecological questions which could be more easily interpreted and answered with a sound knowledge of heat transfer physics:
- Does the climate limit the geographical distribution of an organism?
- What selective advantage is there to being a particular color, shape, or size?
- What microhabitats are available throughout the day to maintain a thermal balance?
- Is there a daily activity pattern that limits prey-predator interactions or foraging time?
- What selective advantage is there to be a poikilotherm; or homeotherm?
- How does the thermal balance affect photosynthetic and transpiration rate of a plant?
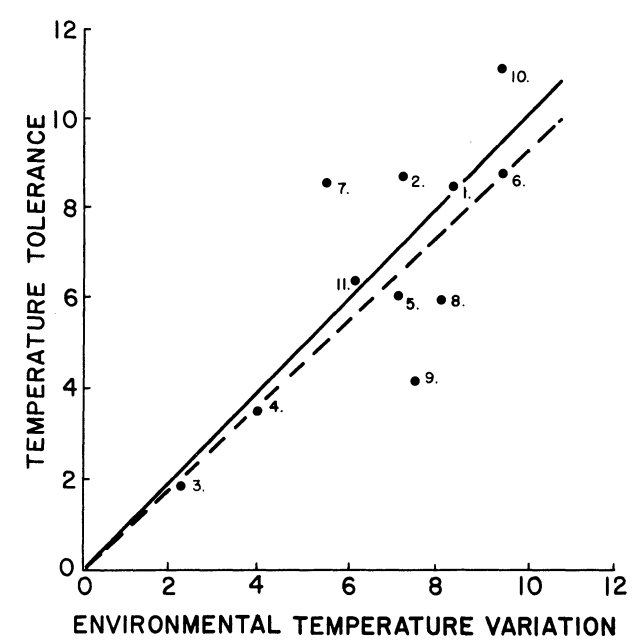
Figure 7.1: The relation of increase in range of temperature tolerance and increase in environmental temperature variation (see text for methods of determining these values). The continuous line is a line of equality relating increase in temperature tolerance and environmental temperature variation. The dashed line has been fitted to the data with the method of least squares. The numbers indicate the species included. These are: 1) Bufo alvarius, 2) B. debilis, 3) B. marinus, 4) B. marmorcus, 5) B. mazatlanensis, 6) Hyla regina, 7) H. smithi, 8) Leptodactylus melanolus, 9)Pternohyla fodiens, 10) Scaphiopus hammondi, 11) Smilisca baudini. (From Snyder, G.K. and W.W. Weathers, 1975, p. 98).
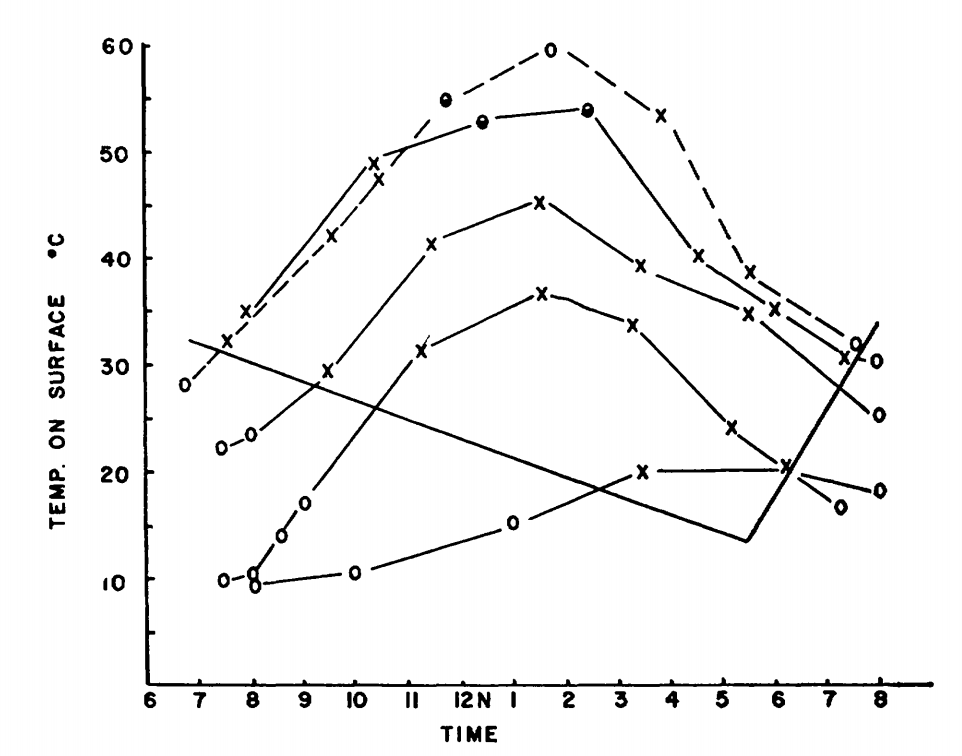
Figure 7.2: Surface activity of Pogonomyrmex badius in relation to temperature of the ground surface and time of day. Active ants on the mound are indicated by crosses; inactive mounds are indicated by open circles; half-closed circles denote very slight activity. The months represented, beginning with the highest curve at 12 noon, are June, July, May, October and February. (From Colley, F.B. and J.B. Gentry, 1964, p. 224.)
The reader should be cautioned that there are other ecological factors such as competition, predation, and coevolution, which may be greater selective influences and which may interact with selective pressures of the physical environment. Predictions from models incorporating physical processes can often be tested quantitatively which allows the investigator to compare the importance of the physical process under consideration with other ecological factors.
R code throughout the tutorial demonstrates the use of the TrenchR package to estimate heat transfer. The package can be installed and loaded as follows: