15.5 Zenith Angle
The solar radiation layers are for flat ground but often we need to compute radiation at different angles relative to the sun’s rays, for which we need to know the zenith angle. This is the angle the sun is in the sky relative to a point directly overhead (so a zenith angle of 0 degrees is when the sun is directly overhead and 90 degrees or greater is below the horizon). This can also tell us about twilight hours, which is when there is still some solar radiation present but the zenith angle is greater than or equal to 90 (the sun has just disappeared).
The code chunk below reads in and plots the zenith angles for midday for summer and winter in Australia.
month<-1 # choose which month you want, 1 or 7 (i.e. Jan or Jun)
# read the file into memory
ZEN_jan<-brick(paste0(path,"zenith_angle/ZEN_",month,".nc"))
month<-7 # choose which month you want, 1 or 7 (i.e. Jan or Jun)
# read the file into memory
ZEN_jul<-brick(paste0(path,"zenith_angle/ZEN_",month,".nc"))
par(mfrow = c(1,2)) # set to plot 1 row of 2 panels
plot(ZEN_jan[[13]],main = "zenith angle, deg, 12:00 January", zlim = c(0,70))
plot(ZEN_jul[[13]],main = "zenith angle, deg, 12:00 July", zlim = c(0,70))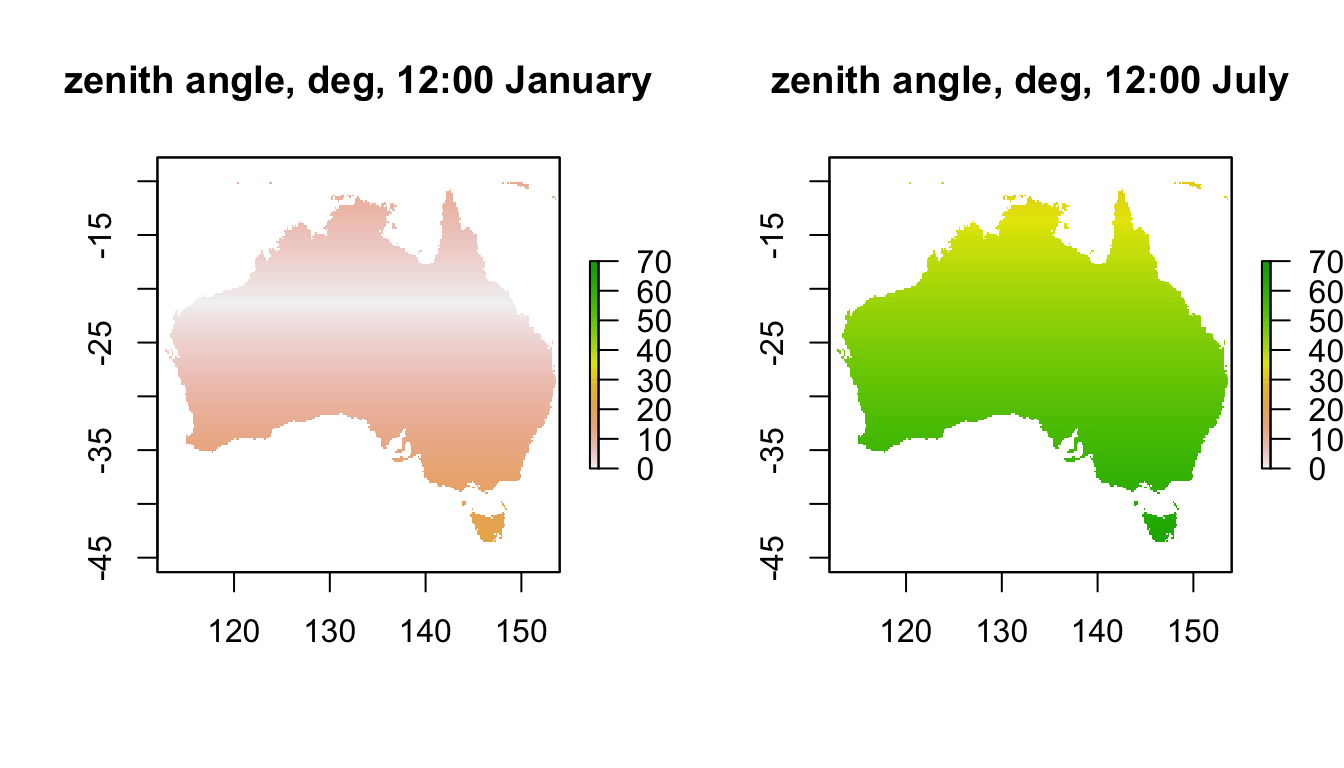
Note how the sun is almost directly overhead at a band at a latitude 23.5 degrees south in January. What is this important latitude called? Note how low the sun is in July, especially in Tasmania where it can be as low as 65 degrees at midday.
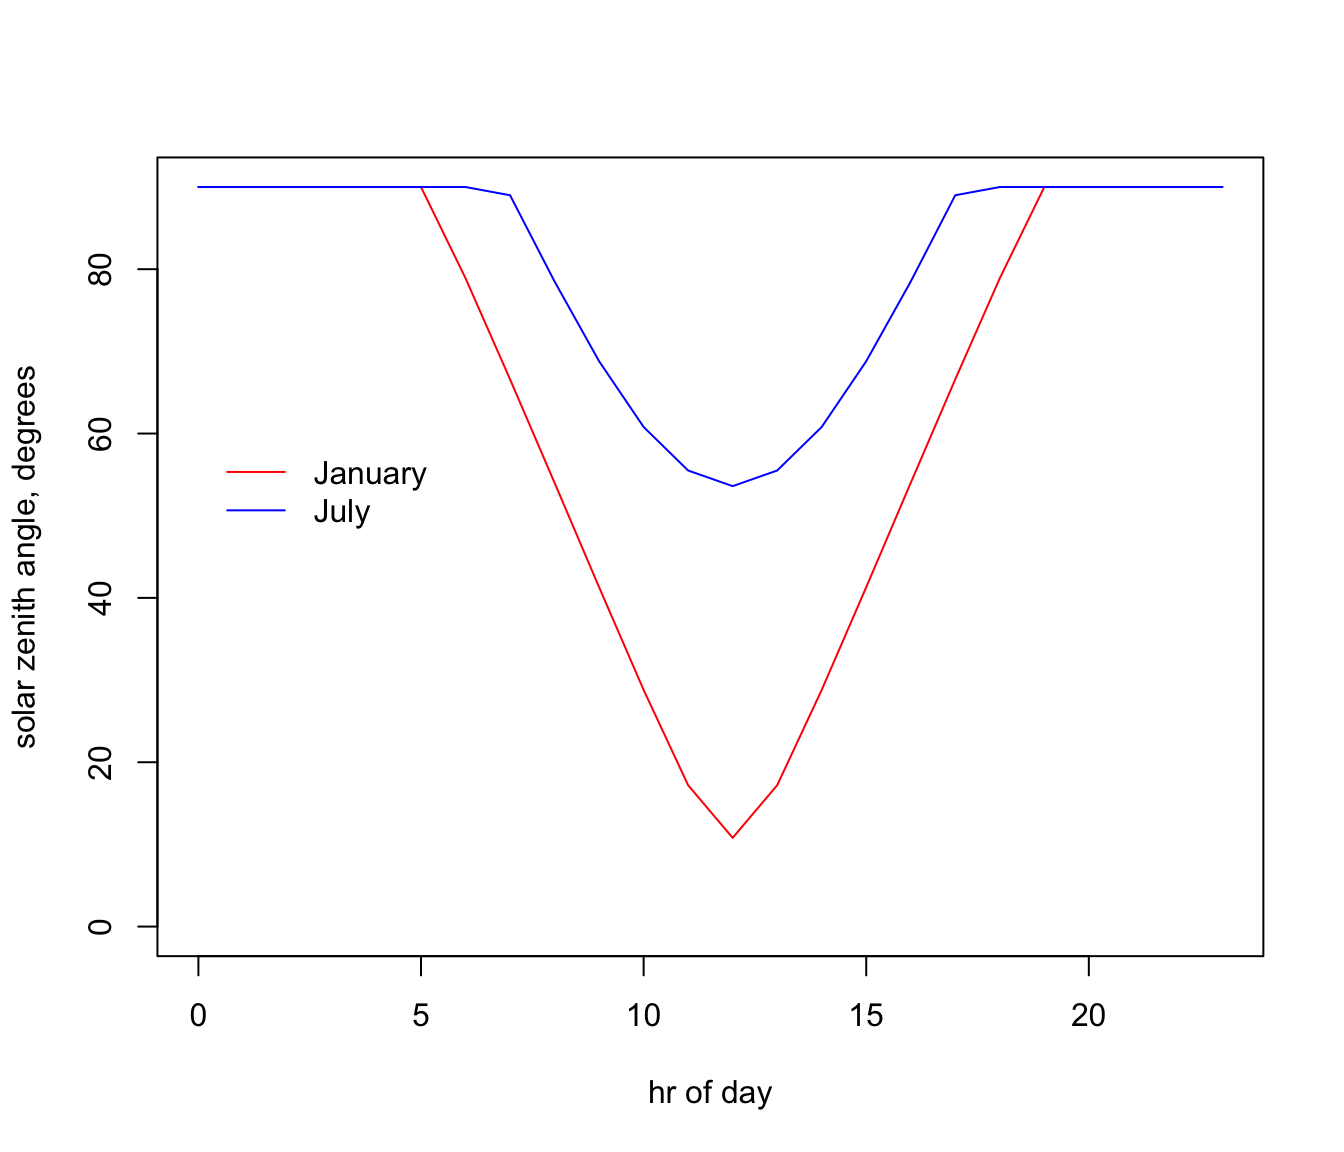
If we look at the zenith angles through the day at our Flinders Ranges site in the two months, we get the following:
# extract data for all layers in 'ZEN_jan' at location 'lon.lat'
ZEN_jan.hr = t(extract(ZEN_jan, lon.lat))
# extract data for all layers in 'ZEN_jul' at location 'lon.lat'
ZEN_jul.hr = t(extract(ZEN_jul, lon.lat))

par(mfrow = c(1,1)) # revert to 1 panel
# plot zenith angle in January as a function of hour, as a line graph (using type = 'l'),
# in red
plot(ZEN_jan.hr ~ hrs, type = 'l', ylim=c(0,90), ylab = "solar zenith angle, degrees",
     xlab = "hr of day", col = 'red')
# plot zenith angle in July as a function of hour, as a line graph (using type = 'l'),
# with January in red and June in blue.
points(ZEN_jul.hr ~ hrs, type = 'l', col = 'blue')
legend(0, 60, c("January", "July"), col = c("red", "blue"), lty=c(1), bty = "n")