2.41 Zambia
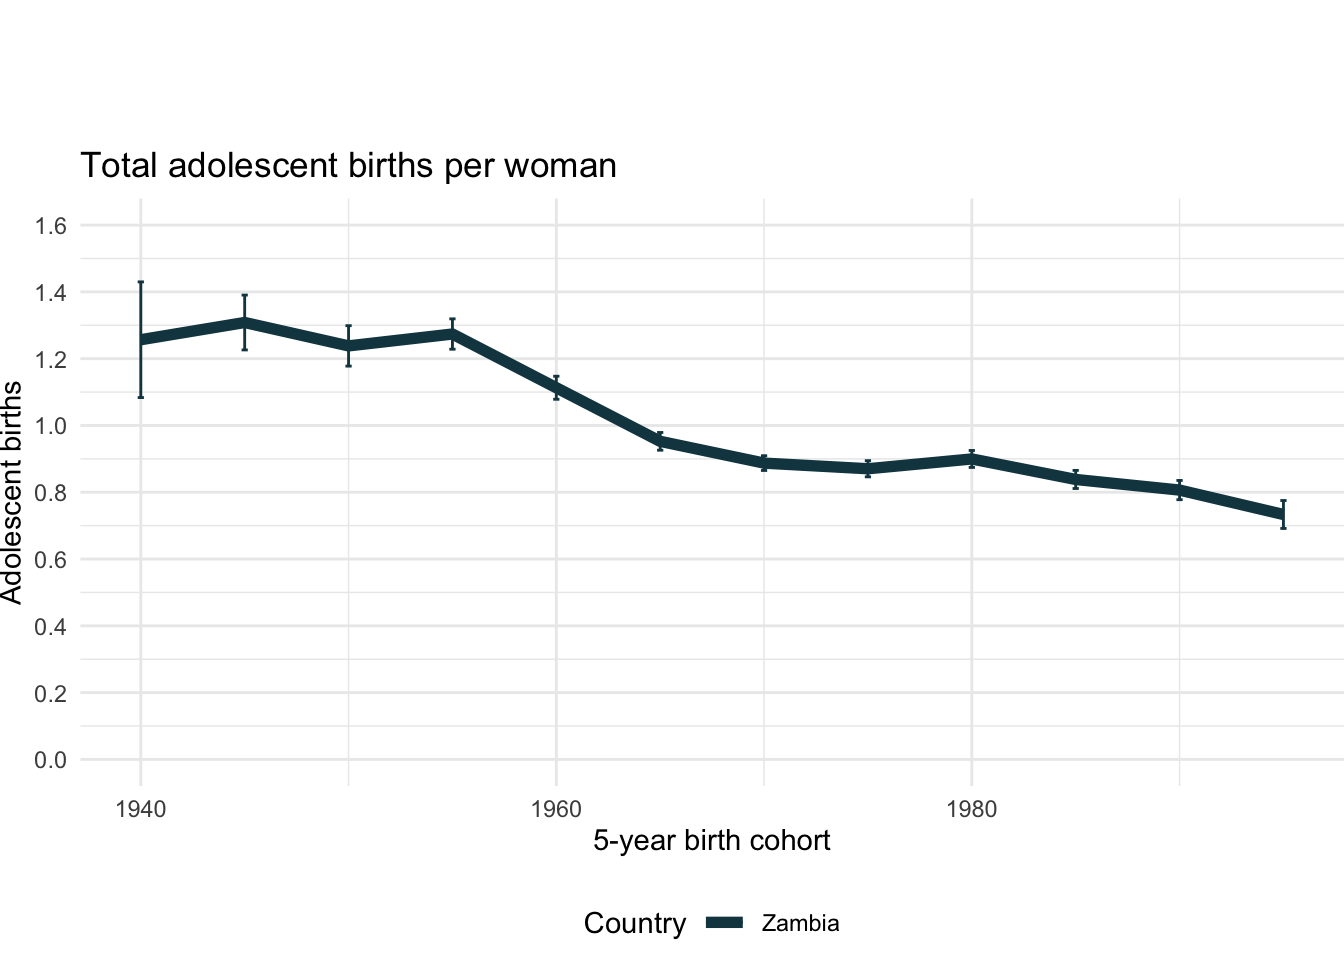
2.41.1 Total adolescent births
Country | 5-year birth cohort | Unweighted cases | Total adolescent births | |
---|---|---|---|---|
|
|
|
| |
1 | Zambia | 1940 | 215 | 1.26 |
2 | Zambia | 1945 | 834 | 1.31 |
3 | Zambia | 1950 | 1,318 | 1.24 |
4 | Zambia | 1955 | 2,310 | 1.27 |
5 | Zambia | 1960 | 3,566 | 1.11 |
6 | Zambia | 1965 | 5,104 | 0.95 |
7 | Zambia | 1970 | 6,912 | 0.89 |
8 | Zambia | 1975 | 6,393 | 0.87 |
9 | Zambia | 1980 | 6,368 | 0.90 |
10 | Zambia | 1985 | 5,168 | 0.84 |
Showing 1 to 10 of 12 entries
2.41.2 Total adolescent births by age at first birth
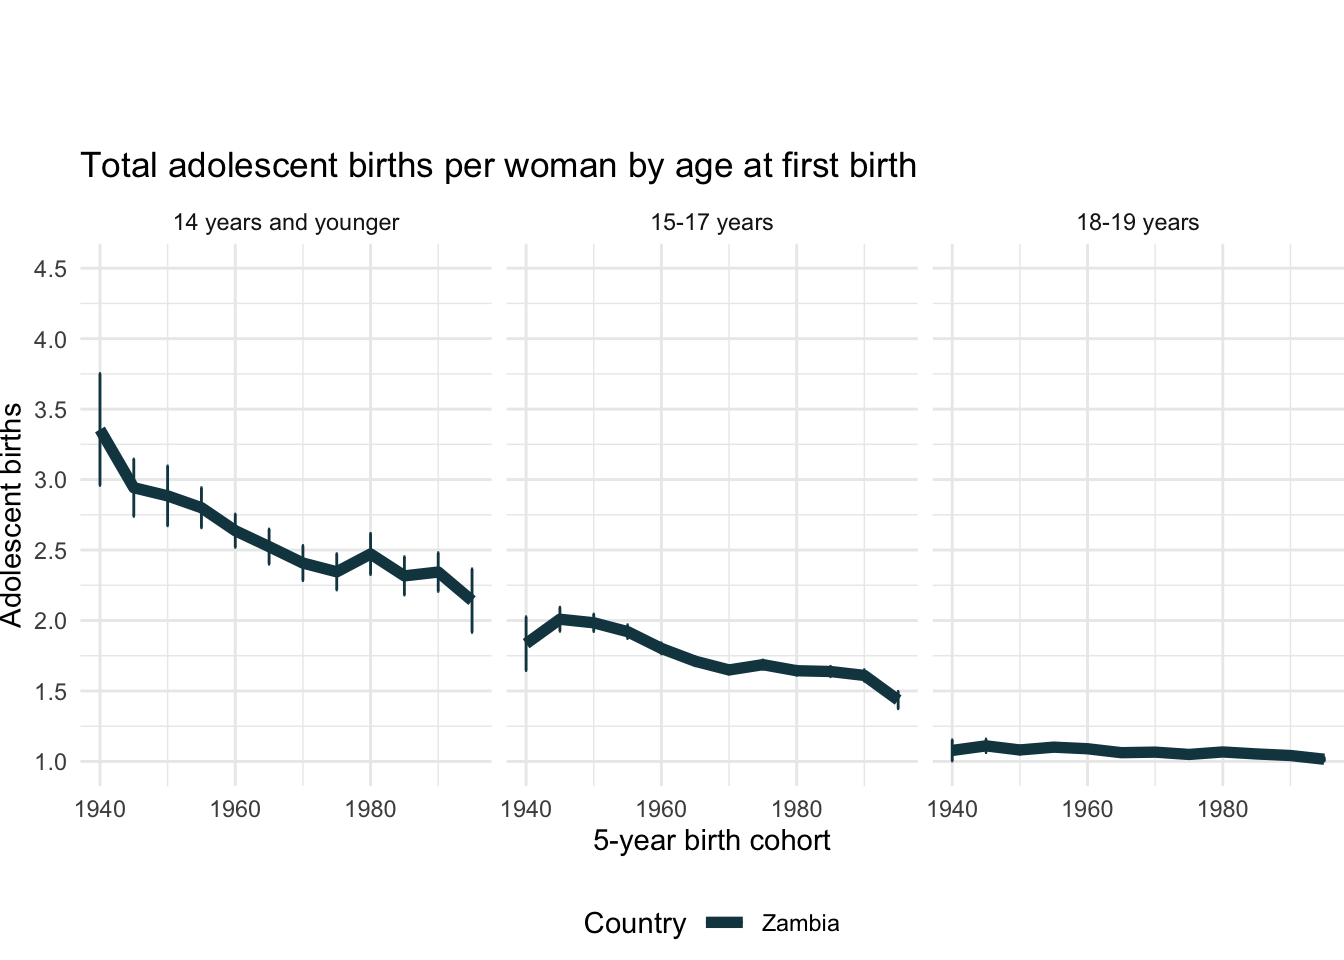
Country | 5-year birth cohort | Age at first birth | Unweighted cases | Total adolescent births | |
---|---|---|---|---|---|
|
|
|
|
| |
1 | Zambia | 1940 | 14 years and younger | 30 | 3.36 |
2 | Zambia | 1940 | 15-17 years | 64 | 1.84 |
3 | Zambia | 1940 | 18-19 years | 51 | 1.08 |
4 | Zambia | 1945 | 14 years and younger | 101 | 2.94 |
5 | Zambia | 1945 | 15-17 years | 297 | 2.01 |
6 | Zambia | 1945 | 18-19 years | 179 | 1.11 |
7 | Zambia | 1950 | 14 years and younger | 107 | 2.88 |
8 | Zambia | 1950 | 15-17 years | 486 | 1.98 |
9 | Zambia | 1950 | 18-19 years | 349 | 1.08 |
10 | Zambia | 1955 | 14 years and younger | 221 | 2.80 |
Showing 1 to 10 of 36 entries
2.41.3 Contribution to total adolescent fertility by cohort and age at first birth
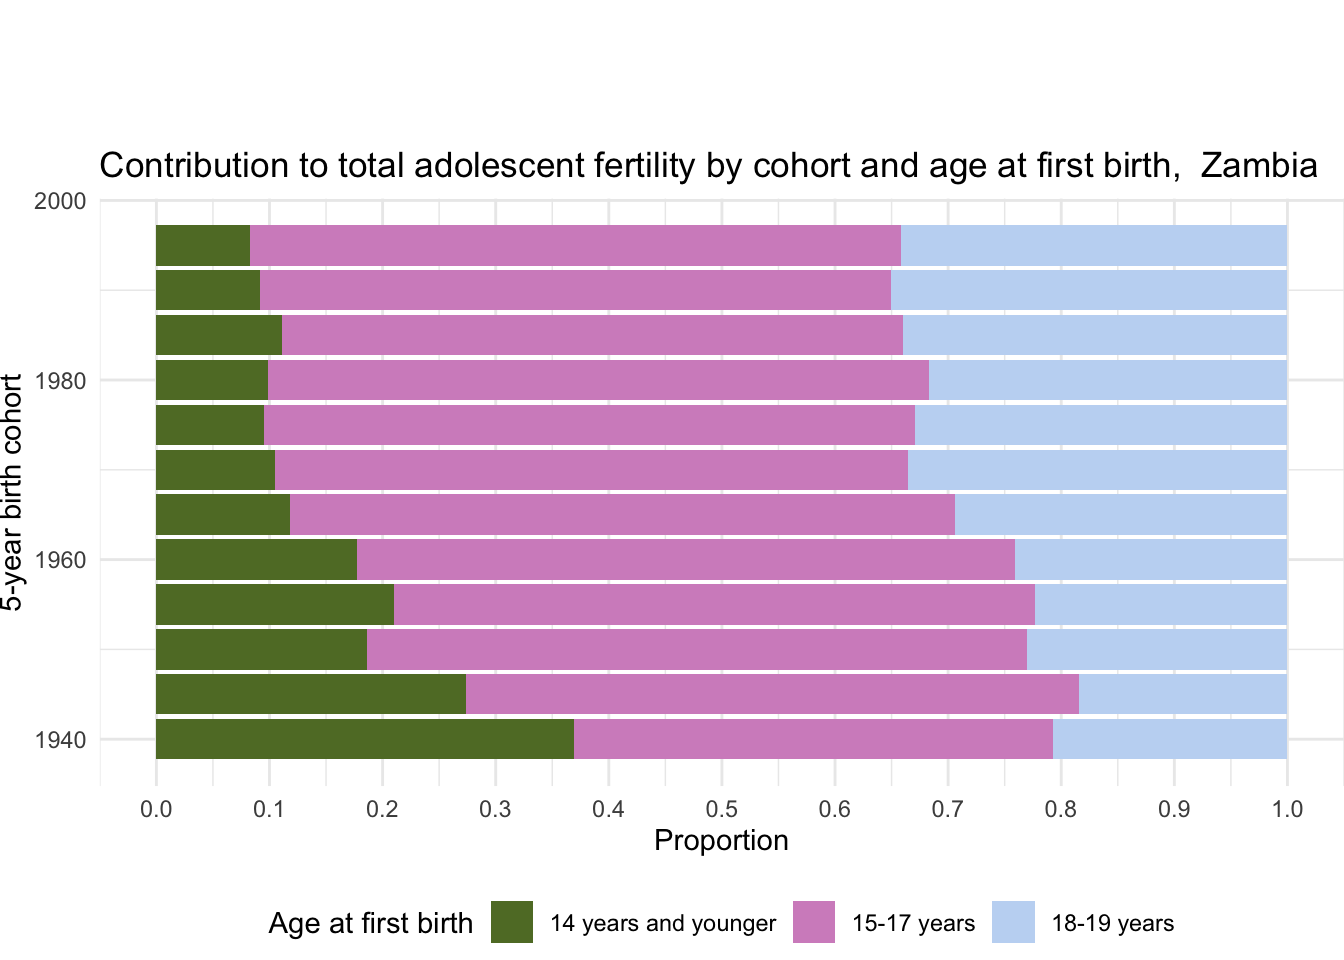
Country | 5-year birth cohort | Age at first birth | Unweighted cases | Proportion | |
---|---|---|---|---|---|
|
|
|
|
| |
1 | Zambia | 1940 | 14 years and younger | 30 | 0.37 |
2 | Zambia | 1940 | 15-17 years | 64 | 0.42 |
3 | Zambia | 1940 | 18-19 years | 51 | 0.21 |
4 | Zambia | 1945 | 14 years and younger | 101 | 0.27 |
5 | Zambia | 1945 | 15-17 years | 297 | 0.54 |
6 | Zambia | 1945 | 18-19 years | 179 | 0.18 |
7 | Zambia | 1950 | 14 years and younger | 107 | 0.19 |
8 | Zambia | 1950 | 15-17 years | 486 | 0.58 |
9 | Zambia | 1950 | 18-19 years | 349 | 0.23 |
10 | Zambia | 1955 | 14 years and younger | 221 | 0.21 |
Showing 1 to 10 of 36 entries
2.41.4 Contribution to total adolescent fertility by age at first birth (all cohorts)
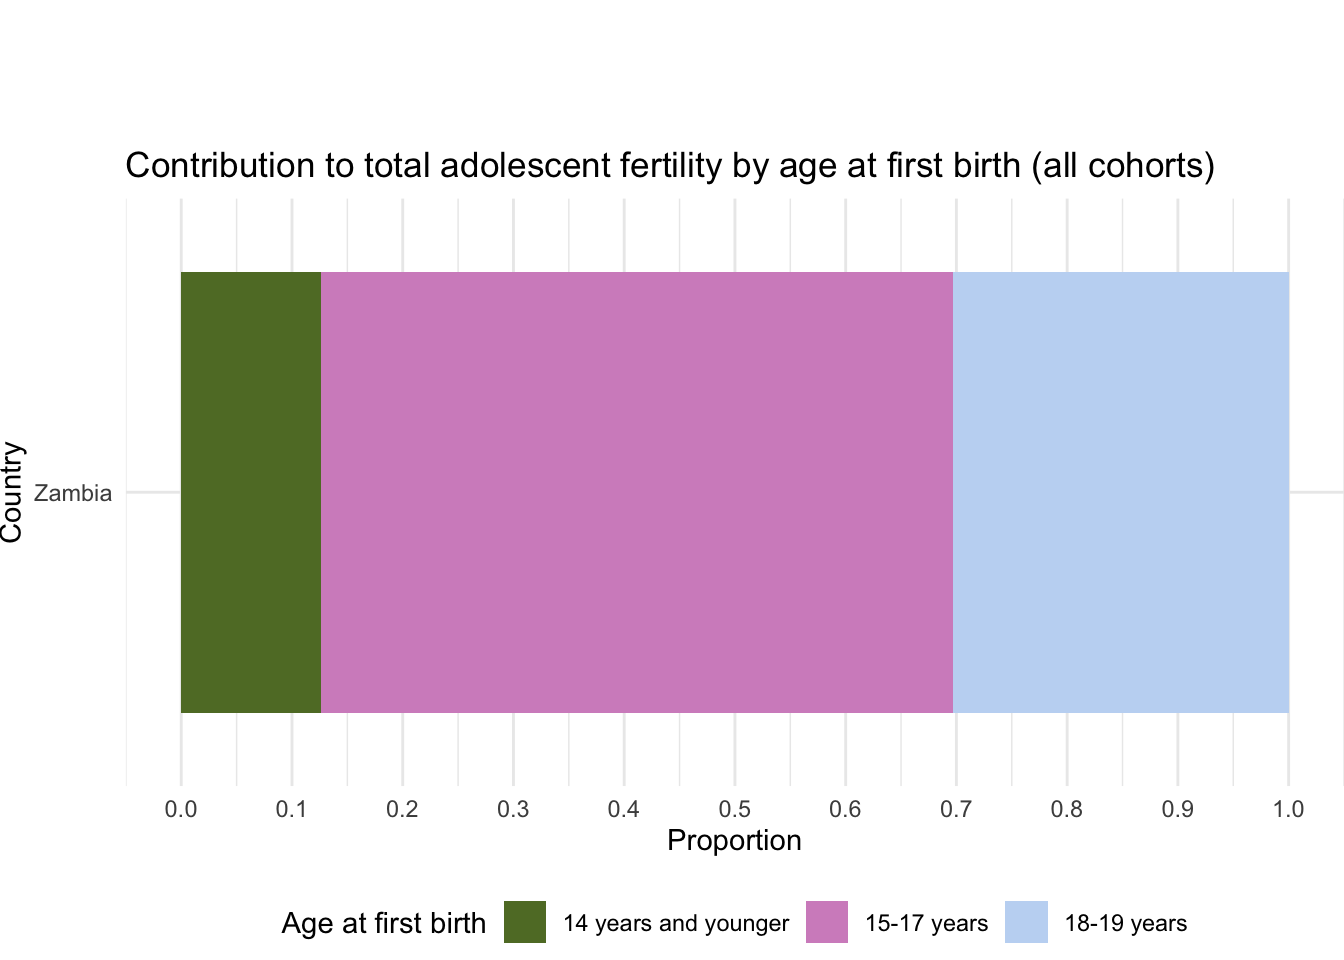
Country | Age at first birth | Unweighted cases | Proportion | |
---|---|---|---|---|
|
|
|
| |
1 | Zambia | 14 years and younger | 2,143 | 0.13 |
2 | Zambia | 15-17 years | 13,951 | 0.57 |
3 | Zambia | 18-19 years | 11,824 | 0.30 |
Showing 1 to 3 of 3 entries
2.41.5 Completed fertility by motherhood entry age
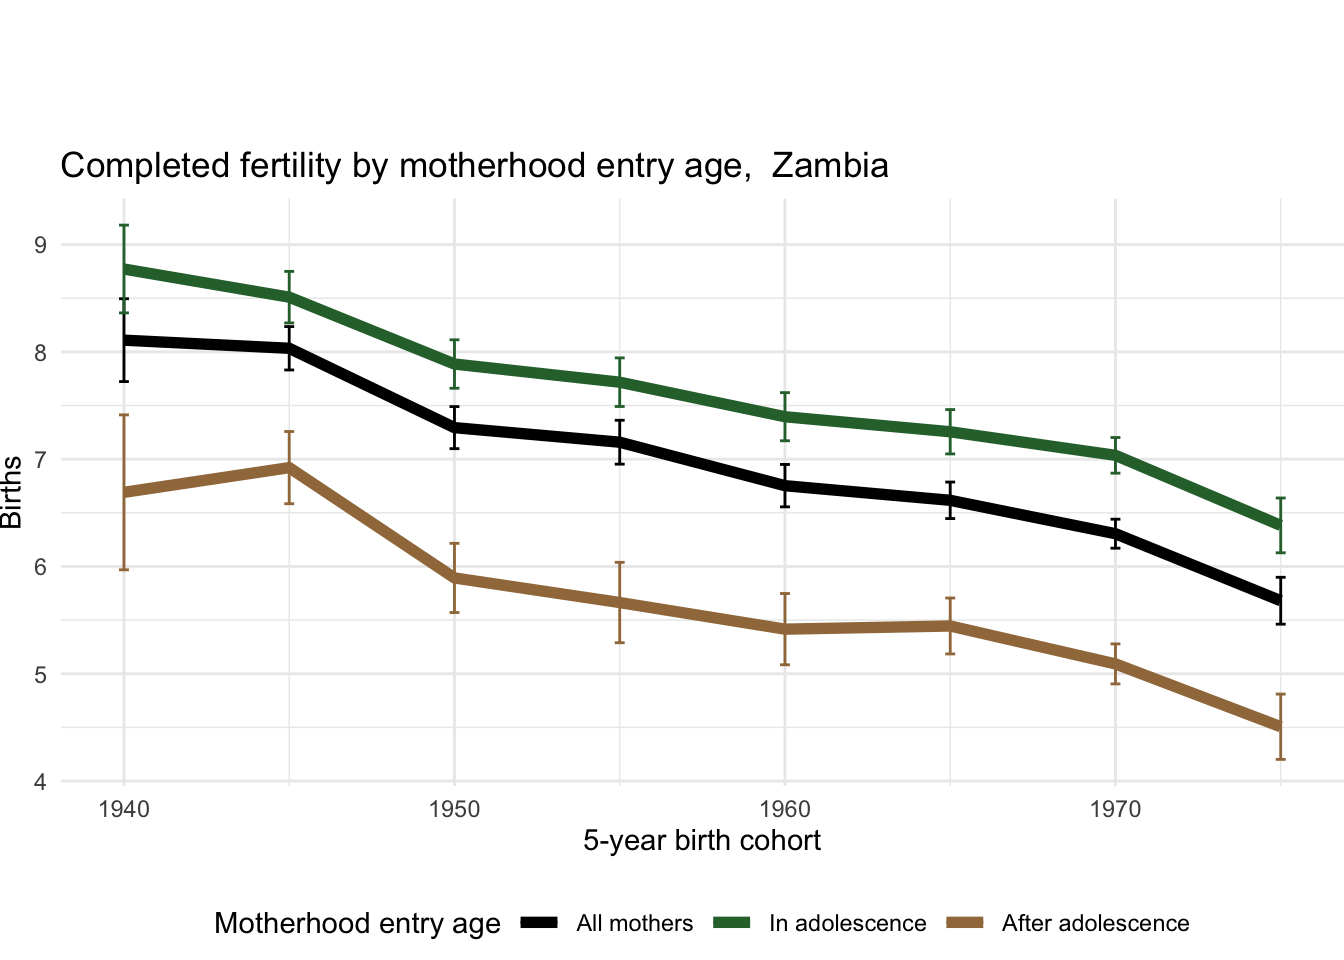
Country | 5-year birth cohort | Age at first birth | Unweighted cases | Number of children | |
---|---|---|---|---|---|
|
|
|
|
| |
1 | Zambia | 1940 | All mothers | 211 | 8.11 |
2 | Zambia | 1940 | In adolescence | 145 | 8.77 |
3 | Zambia | 1940 | After adolescence | 66 | 6.69 |
4 | Zambia | 1945 | All mothers | 823 | 8.03 |
5 | Zambia | 1945 | In adolescence | 577 | 8.51 |
6 | Zambia | 1945 | After adolescence | 246 | 6.92 |
7 | Zambia | 1950 | All mothers | 925 | 7.29 |
8 | Zambia | 1950 | In adolescence | 659 | 7.89 |
9 | Zambia | 1950 | After adolescence | 266 | 5.89 |
10 | Zambia | 1955 | All mothers | 871 | 7.16 |
Showing 1 to 10 of 24 entries
2.41.6 Difference in completed fertility between adolescent and non-adolescent mothers
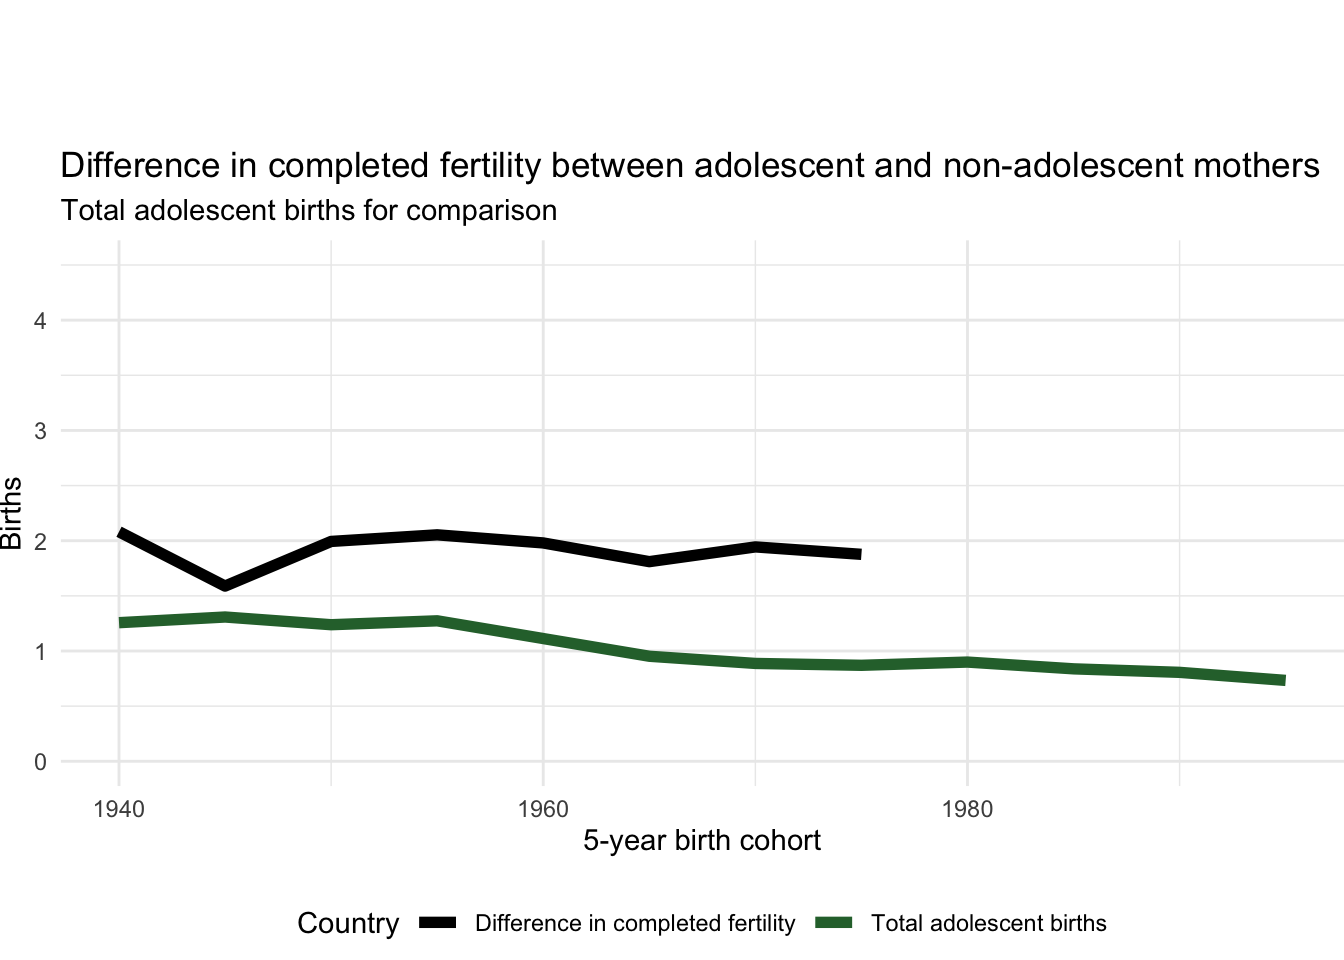
Country | 5-year birth cohort | Difference in number of births | |
---|---|---|---|
|
|
| |
1 | Zambia | 1940 | 2.08 |
2 | Zambia | 1945 | 1.59 |
3 | Zambia | 1950 | 1.99 |
4 | Zambia | 1955 | 2.05 |
5 | Zambia | 1960 | 1.98 |
6 | Zambia | 1965 | 1.81 |
7 | Zambia | 1970 | 1.94 |
8 | Zambia | 1975 | 1.88 |
Showing 1 to 8 of 8 entries
2.41.7 Contribution of adolescent fertility to total fertility by cohort
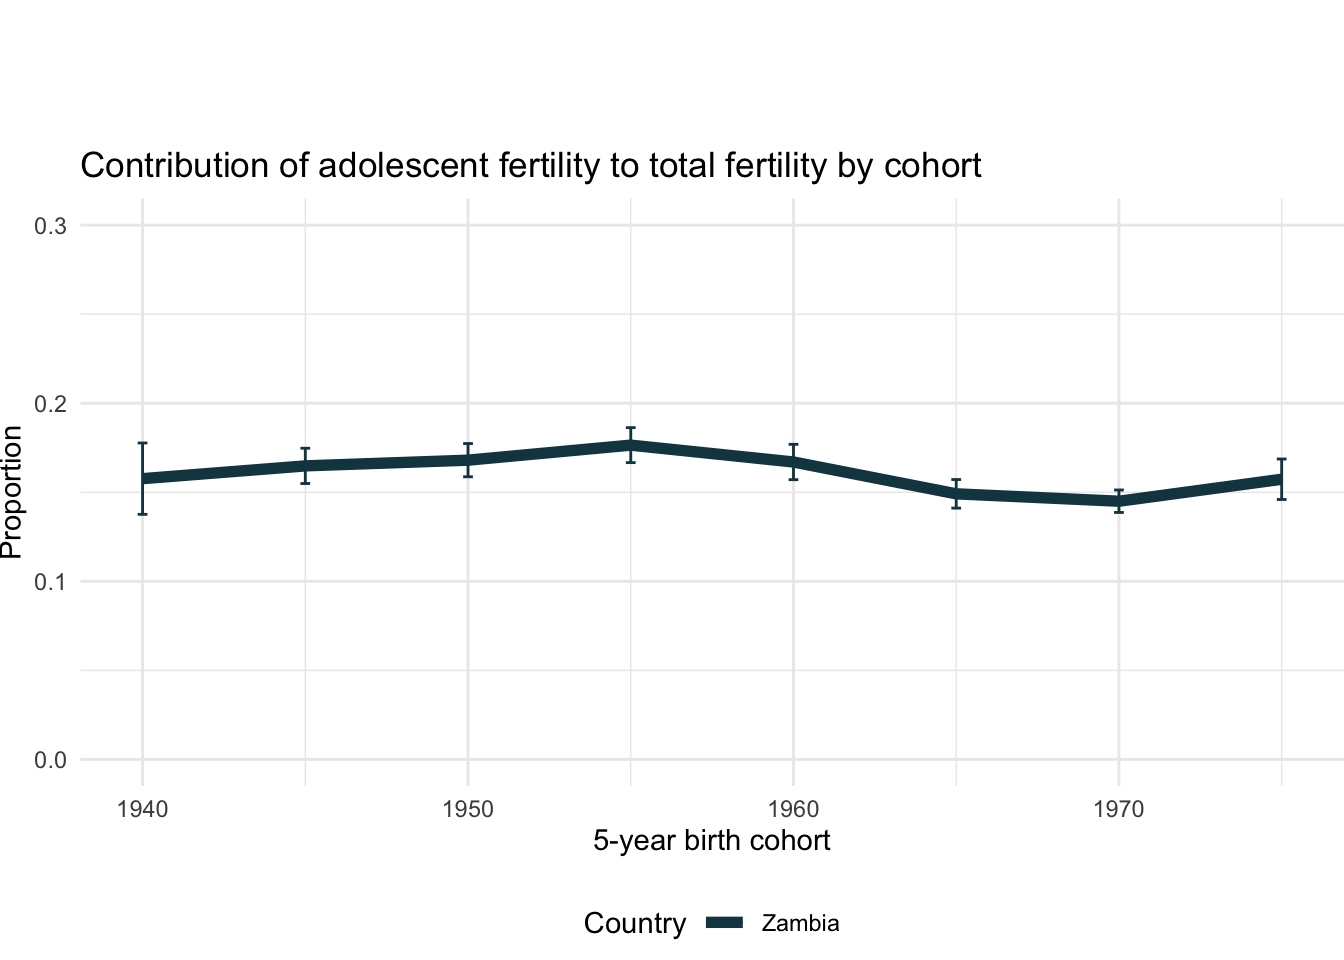
Country | 5-year birth cohort | Unweighted cases | Proportion | |
---|---|---|---|---|
|
|
|
| |
1 | Zambia | 1940 | 211 | 0.16 |
2 | Zambia | 1945 | 823 | 0.16 |
3 | Zambia | 1950 | 925 | 0.17 |
4 | Zambia | 1955 | 871 | 0.18 |
5 | Zambia | 1960 | 955 | 0.17 |
6 | Zambia | 1965 | 1,377 | 0.15 |
7 | Zambia | 1970 | 2,000 | 0.14 |
8 | Zambia | 1975 | 758 | 0.16 |
Showing 1 to 8 of 8 entries
2.41.8 Mean age at first birth
Country | 5-year birth cohort | Unweighted cases | Mean age | |
---|---|---|---|---|
|
|
|
| |
1 | Zambia | 1940 | 211 | 18.93 |
2 | Zambia | 1945 | 823 | 18.62 |
3 | Zambia | 1950 | 1,300 | 18.85 |
4 | Zambia | 1955 | 2,259 | 18.51 |
5 | Zambia | 1960 | 2,750 | 18.92 |
6 | Zambia | 1965 | 2,799 | 19.33 |
7 | Zambia | 1970 | 3,745 | 19.71 |
8 | Zambia | 1975 | 3,713 | 19.68 |
9 | Zambia | 1980 | 3,302 | 19.65 |
10 | Zambia | 1985 | 1,024 | 19.68 |
Showing 1 to 10 of 10 entries
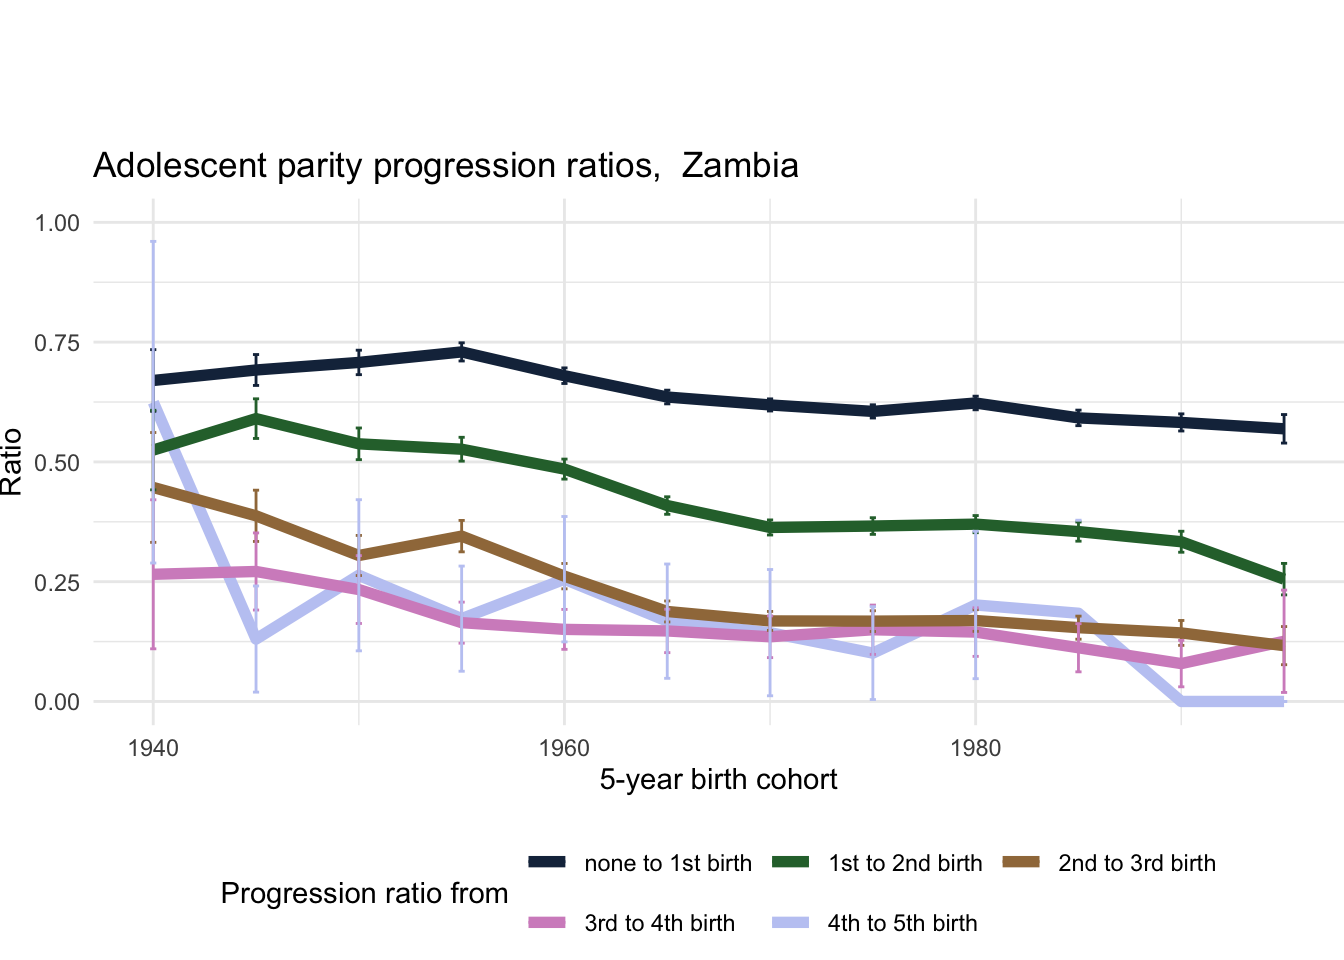
2.41.9 Adolescent parity progression ratios
Country | 5-year birth cohort | Progression ratio from | Unweighted cases | Ratio | |
---|---|---|---|---|---|
|
|
|
|
| |
1 | Zambia | 1940 | none to 1st birth | 145 | 0.67 |
2 | Zambia | 1940 | 1st to 2nd birth | 75 | 0.52 |
3 | Zambia | 1940 | 2nd to 3rd birth | 34 | 0.45 |
4 | Zambia | 1940 | 3rd to 4th birth | 8 | 0.27 |
5 | Zambia | 1940 | 4th to 5th birth | 5 | 0.62 |
6 | Zambia | 1945 | none to 1st birth | 577 | 0.69 |
7 | Zambia | 1945 | 1st to 2nd birth | 340 | 0.59 |
8 | Zambia | 1945 | 2nd to 3rd birth | 133 | 0.39 |
9 | Zambia | 1945 | 3rd to 4th birth | 33 | 0.27 |
10 | Zambia | 1945 | 4th to 5th birth | 5 | 0.13 |
Showing 1 to 10 of 60 entries
2.41.10 Adolescent parity progression ratios by age
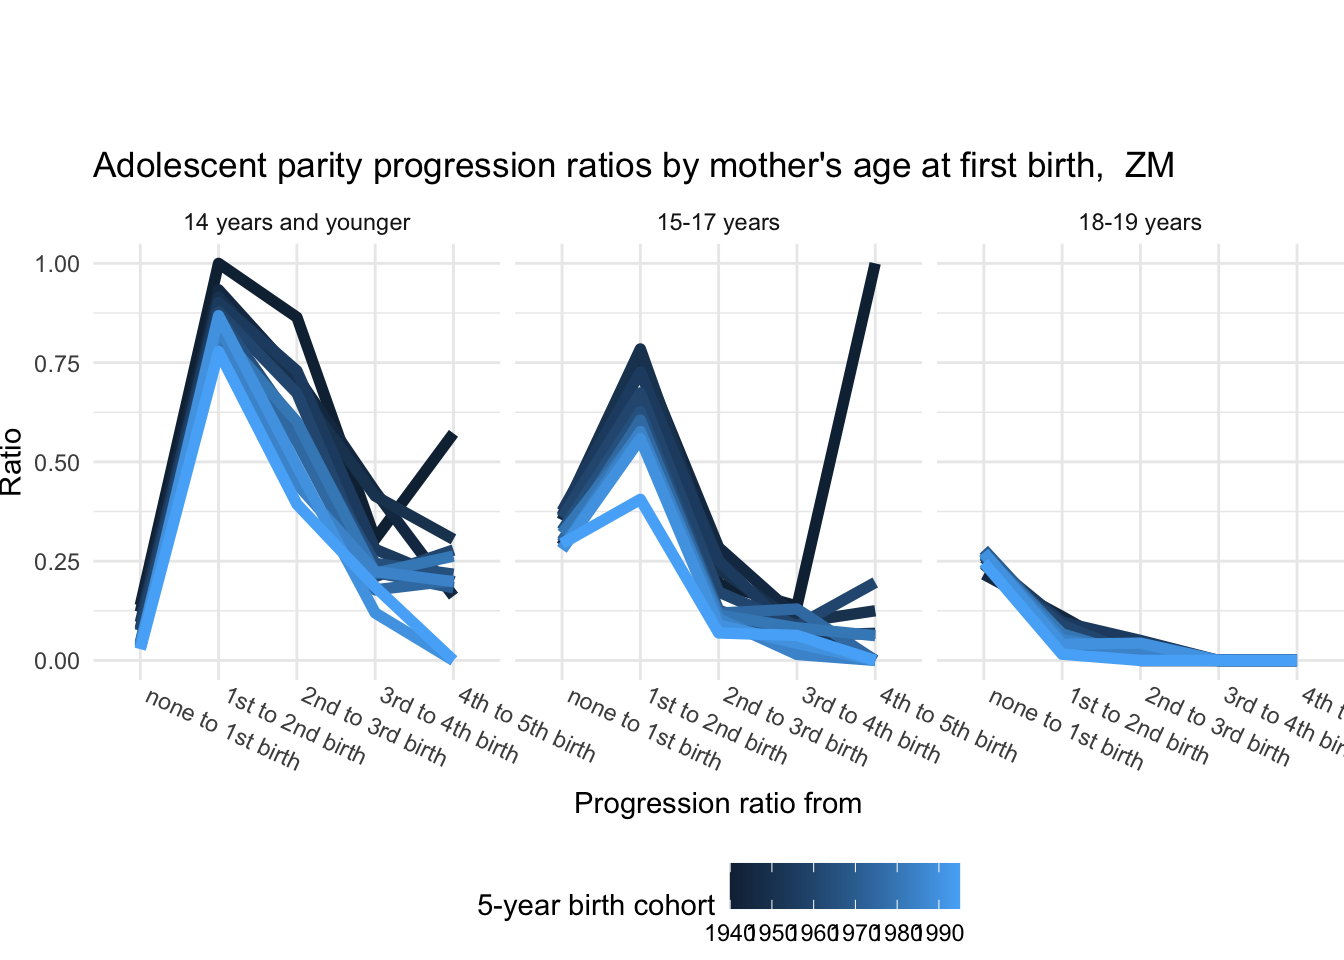
Country | 5-year birth cohort | Age at first birth | Progression ratio from | Unweighted cases | Ratio | |
---|---|---|---|---|---|---|
|
|
|
|
|
| |
1 | Zambia | 1940 | 14 years and younger | none to 1st birth | 30 | 0.14 |
2 | Zambia | 1940 | 15-17 years | none to 1st birth | 64 | 0.29 |
3 | Zambia | 1940 | 18-19 years | none to 1st birth | 51 | 0.24 |
4 | Zambia | 1940 | 14 years and younger | 1st to 2nd birth | 30 | 1.00 |
5 | Zambia | 1940 | 15-17 years | 1st to 2nd birth | 41 | 0.67 |
6 | Zambia | 1940 | 18-19 years | 1st to 2nd birth | 4 | 0.08 |
7 | Zambia | 1940 | 14 years and younger | 2nd to 3rd birth | 26 | 0.86 |
8 | Zambia | 1940 | 15-17 years | 2nd to 3rd birth | 8 | 0.19 |
9 | Zambia | 1940 | 18-19 years | 2nd to 3rd birth | 0 | 0.00 |
10 | Zambia | 1940 | 14 years and younger | 3rd to 4th birth | 7 | 0.31 |
Showing 1 to 10 of 180 entries
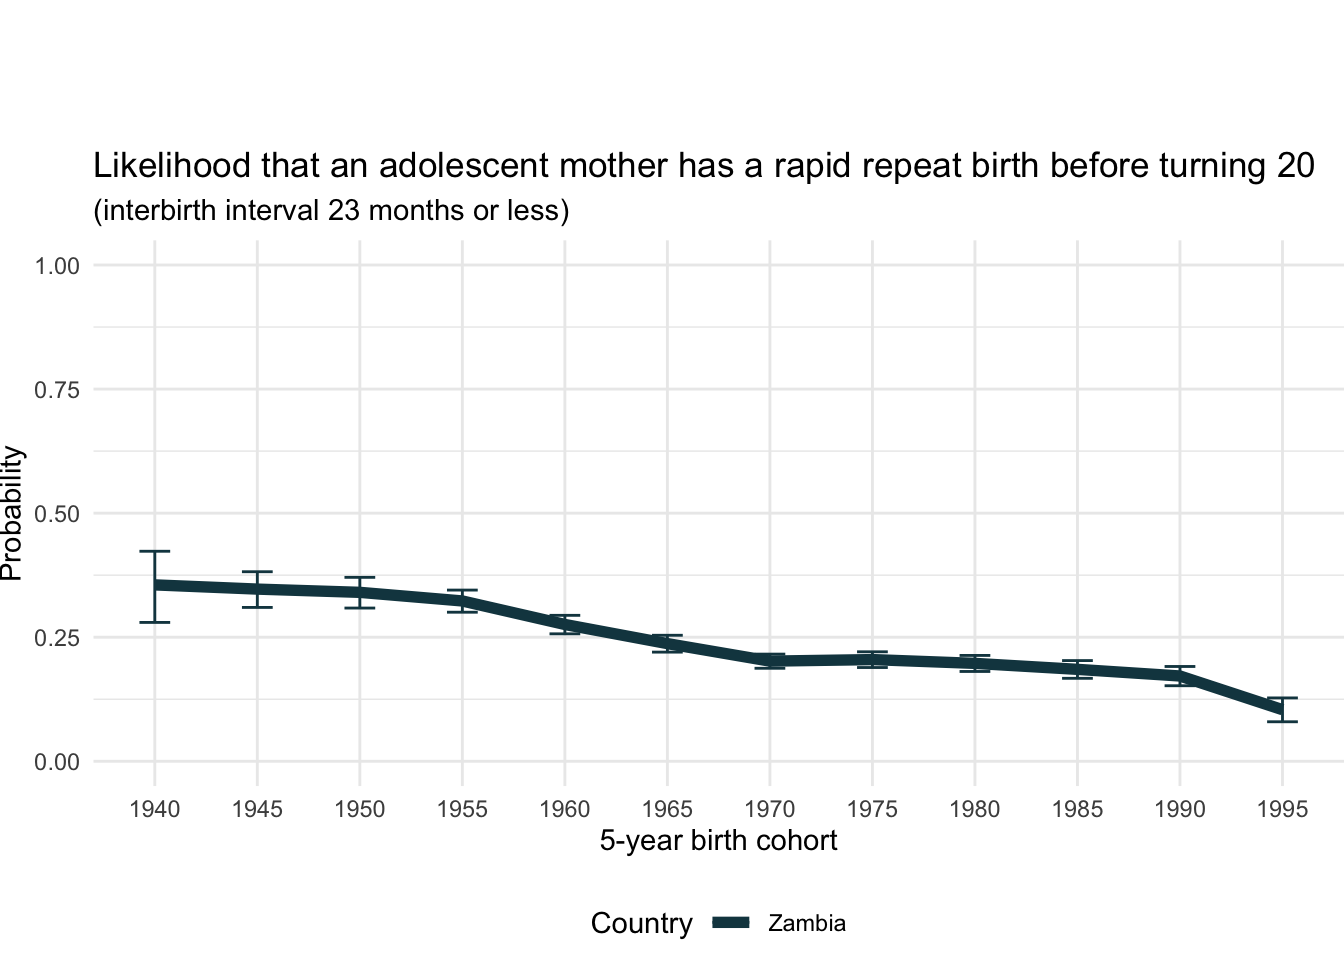
2.41.11 Rapid Repeat Birth probability
Country | 5-year birth cohort | Likelihood | |
---|---|---|---|
|
|
| |
1 | Zambia | 1940 | 0.36 |
2 | Zambia | 1945 | 0.35 |
3 | Zambia | 1950 | 0.34 |
4 | Zambia | 1955 | 0.32 |
5 | Zambia | 1960 | 0.28 |
6 | Zambia | 1965 | 0.24 |
7 | Zambia | 1970 | 0.20 |
8 | Zambia | 1975 | 0.20 |
9 | Zambia | 1980 | 0.20 |
10 | Zambia | 1985 | 0.19 |
Showing 1 to 10 of 12 entries
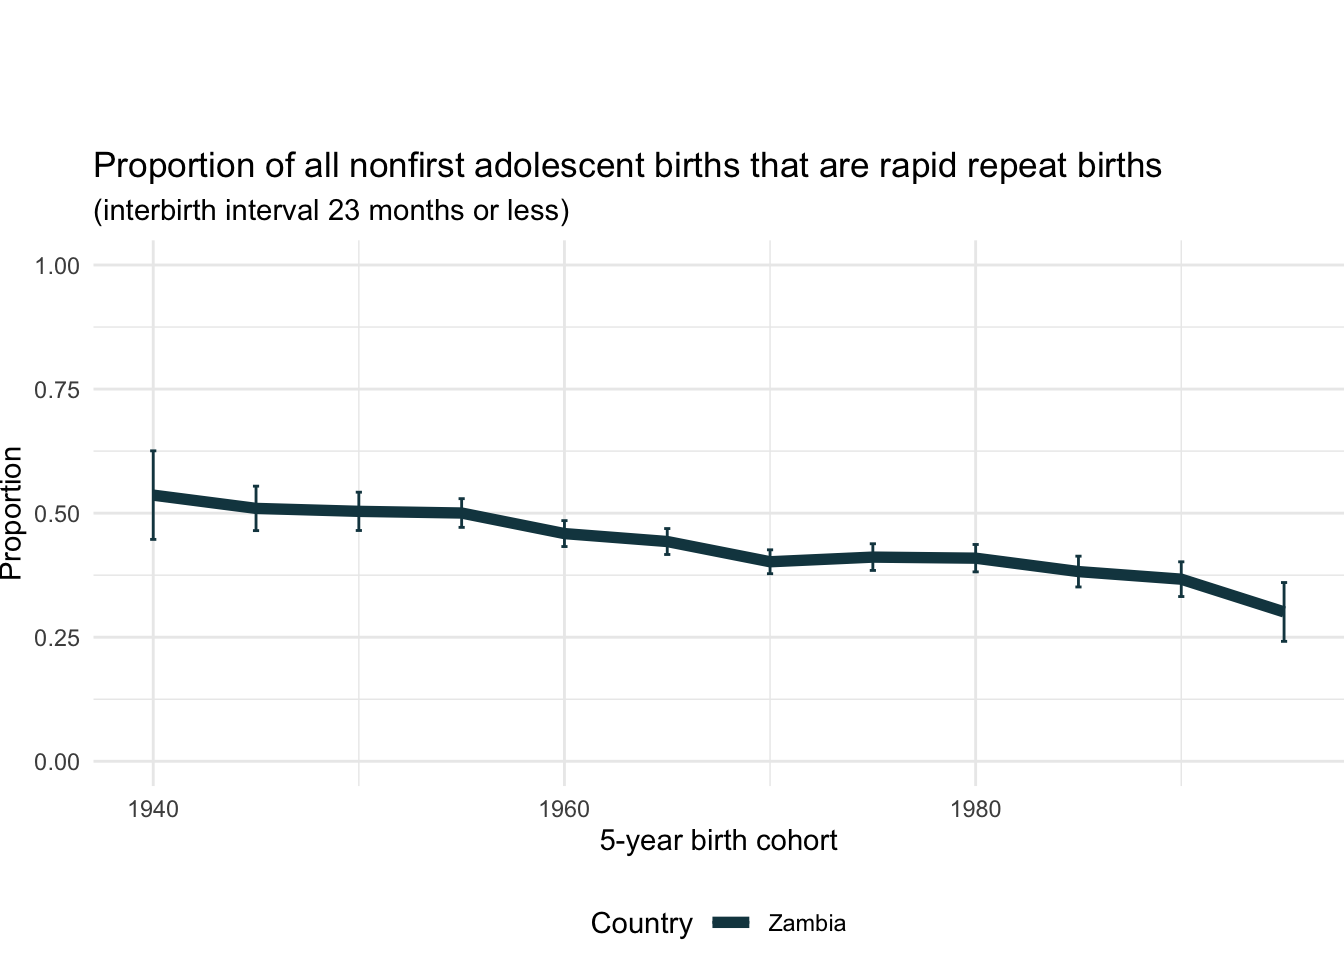
2.41.12 Rapid Repeat Birth proportion
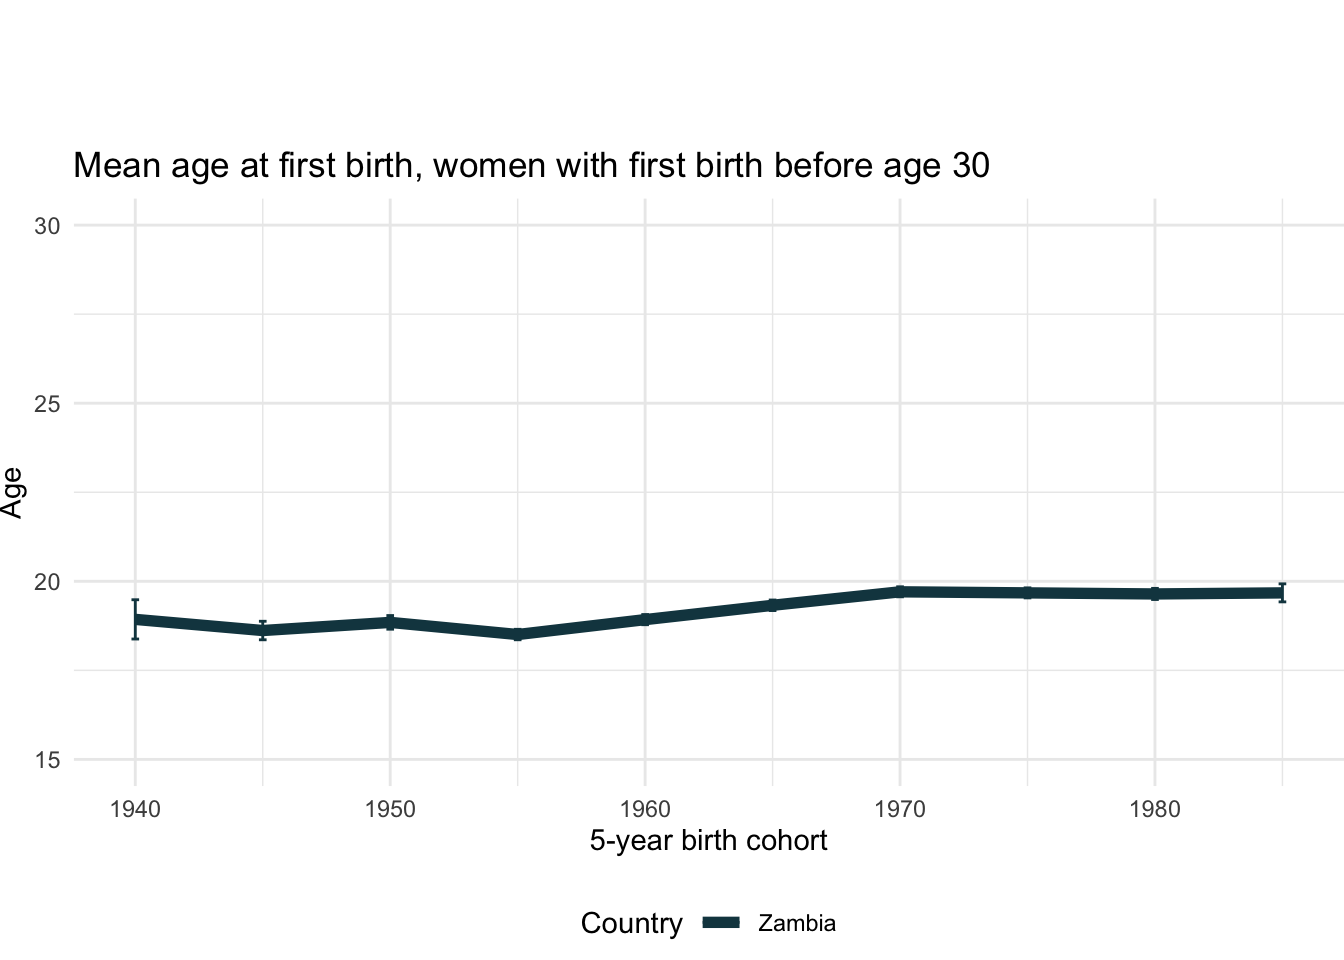
Country | 5-year birth cohort | Unweighted cases (non-first adolescent births) | Proportion | |
---|---|---|---|---|
|
|
|
| |
1 | Zambia | 1940 | 124 | 0.54 |
2 | Zambia | 1945 | 512 | 0.51 |
3 | Zambia | 1950 | 698 | 0.50 |
4 | Zambia | 1955 | 1,263 | 0.50 |
5 | Zambia | 1960 | 1,573 | 0.46 |
6 | Zambia | 1965 | 1,672 | 0.44 |
7 | Zambia | 1970 | 1,885 | 0.40 |
8 | Zambia | 1975 | 1,721 | 0.41 |
9 | Zambia | 1980 | 1,767 | 0.41 |
10 | Zambia | 1985 | 1,307 | 0.38 |
Showing 1 to 10 of 12 entries