6.18 Peru
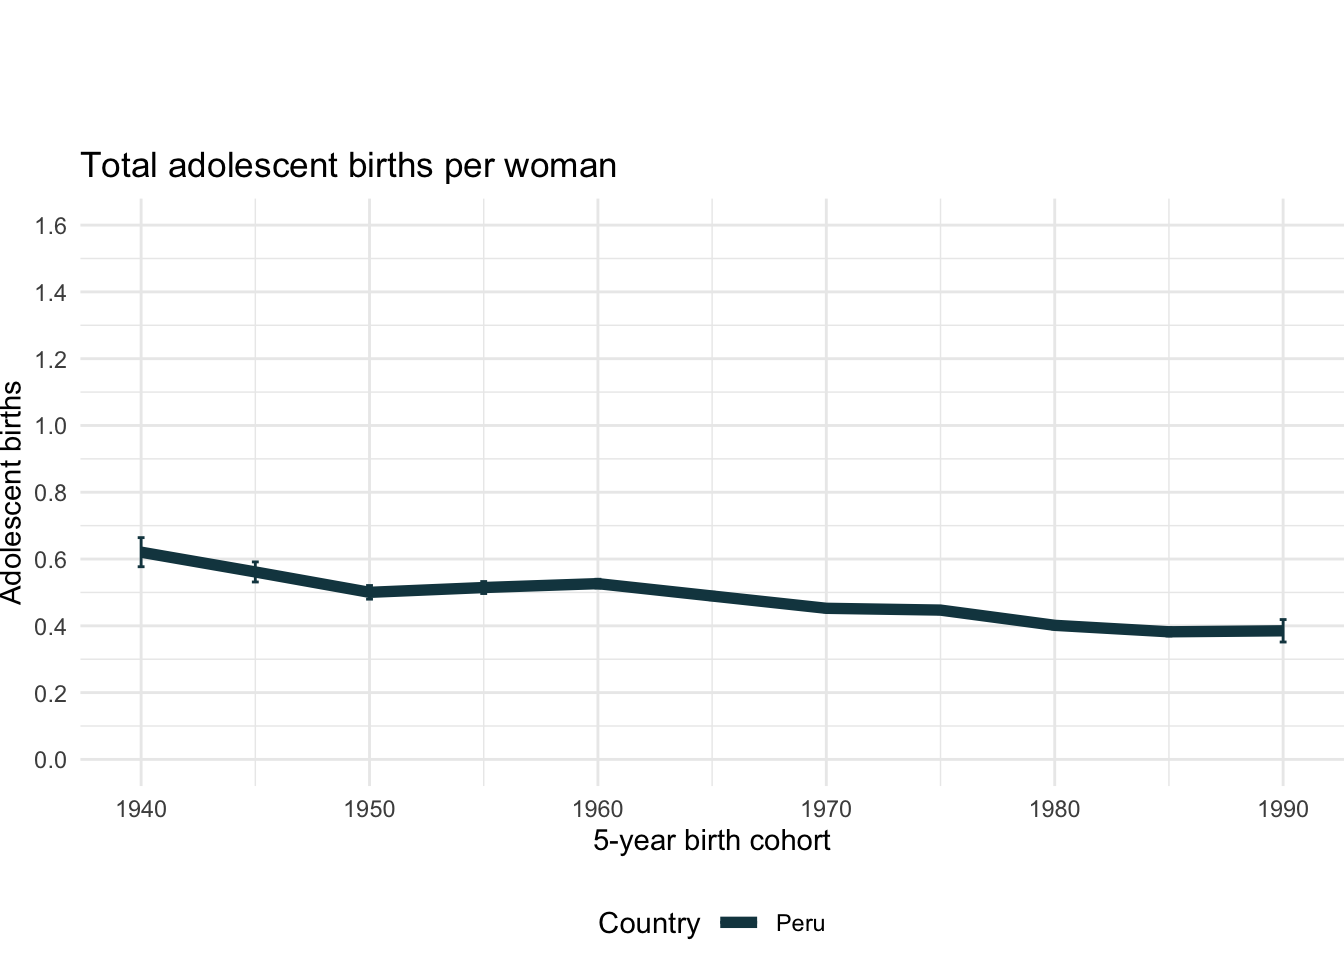
6.18.1 Total adolescent births
Country | 5-year birth cohort | Unweighted cases | Total adolescent births | |
---|---|---|---|---|
|
|
|
| |
1 | Peru | 1940 | 2,054 | 0.62 |
2 | Peru | 1945 | 4,442 | 0.56 |
3 | Peru | 1950 | 8,728 | 0.50 |
4 | Peru | 1955 | 12,527 | 0.51 |
5 | Peru | 1960 | 23,300 | 0.53 |
6 | Peru | 1965 | 28,351 | 0.49 |
7 | Peru | 1970 | 28,964 | 0.45 |
8 | Peru | 1975 | 24,981 | 0.45 |
9 | Peru | 1980 | 19,986 | 0.40 |
10 | Peru | 1985 | 15,321 | 0.38 |
Showing 1 to 10 of 11 entries
6.18.2 Total adolescent births by age at first birth
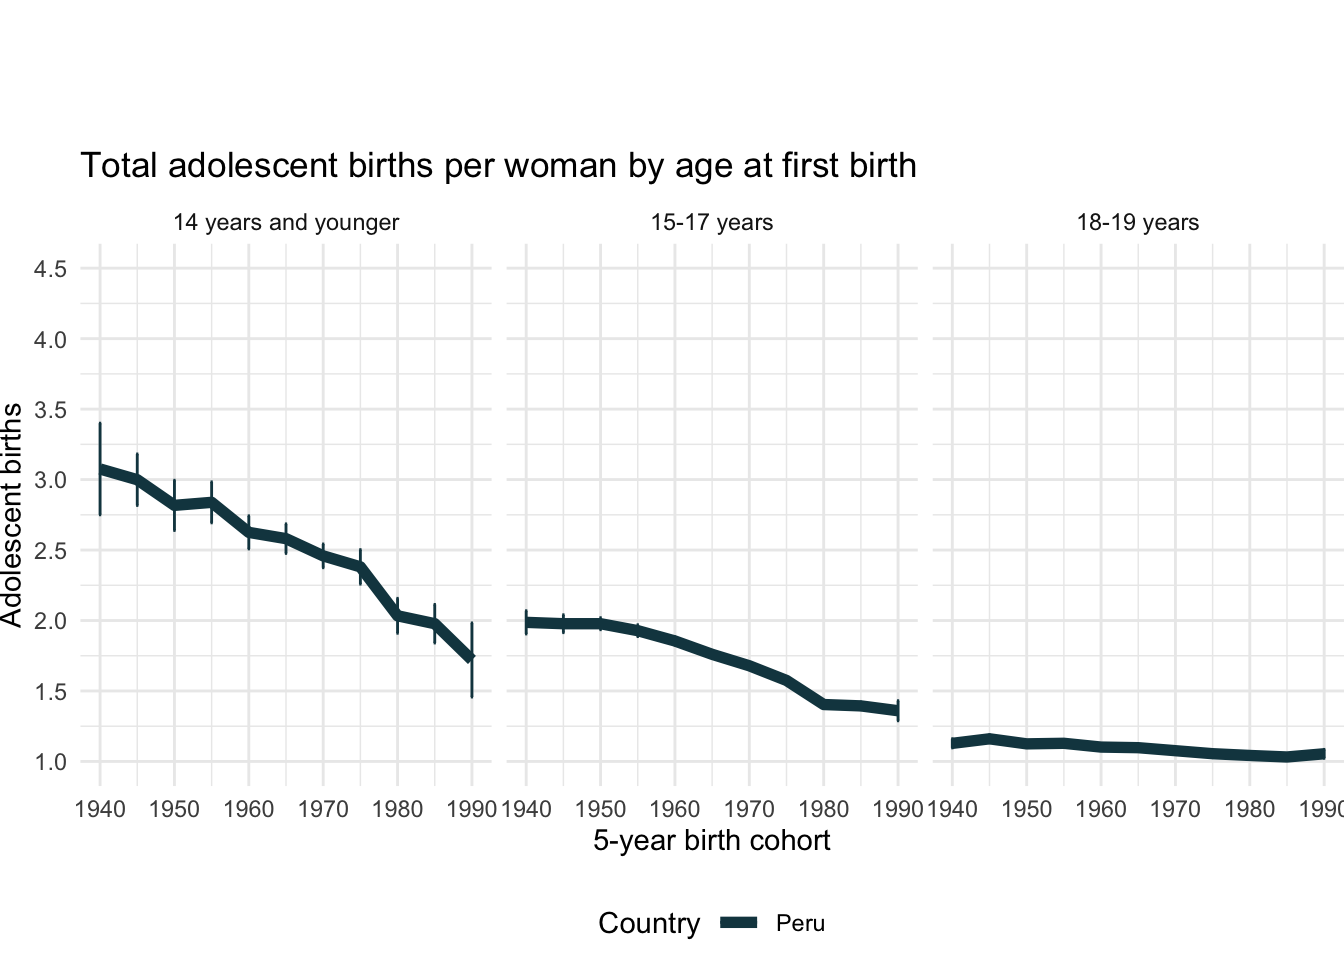
Country | 5-year birth cohort | Age at first birth | Unweighted cases | Total adolescent births | |
---|---|---|---|---|---|
|
|
|
|
| |
1 | Peru | 1940 | 14 years and younger | 79 | 3.08 |
2 | Peru | 1940 | 15-17 years | 382 | 1.99 |
3 | Peru | 1940 | 18-19 years | 439 | 1.13 |
4 | Peru | 1945 | 14 years and younger | 161 | 3.00 |
5 | Peru | 1945 | 15-17 years | 776 | 1.98 |
6 | Peru | 1945 | 18-19 years | 802 | 1.16 |
7 | Peru | 1950 | 14 years and younger | 252 | 2.82 |
8 | Peru | 1950 | 15-17 years | 1,541 | 1.98 |
9 | Peru | 1950 | 18-19 years | 1,600 | 1.12 |
10 | Peru | 1955 | 14 years and younger | 364 | 2.84 |
Showing 1 to 10 of 33 entries
6.18.3 Contribution to total adolescent fertility by cohort and age at first birth
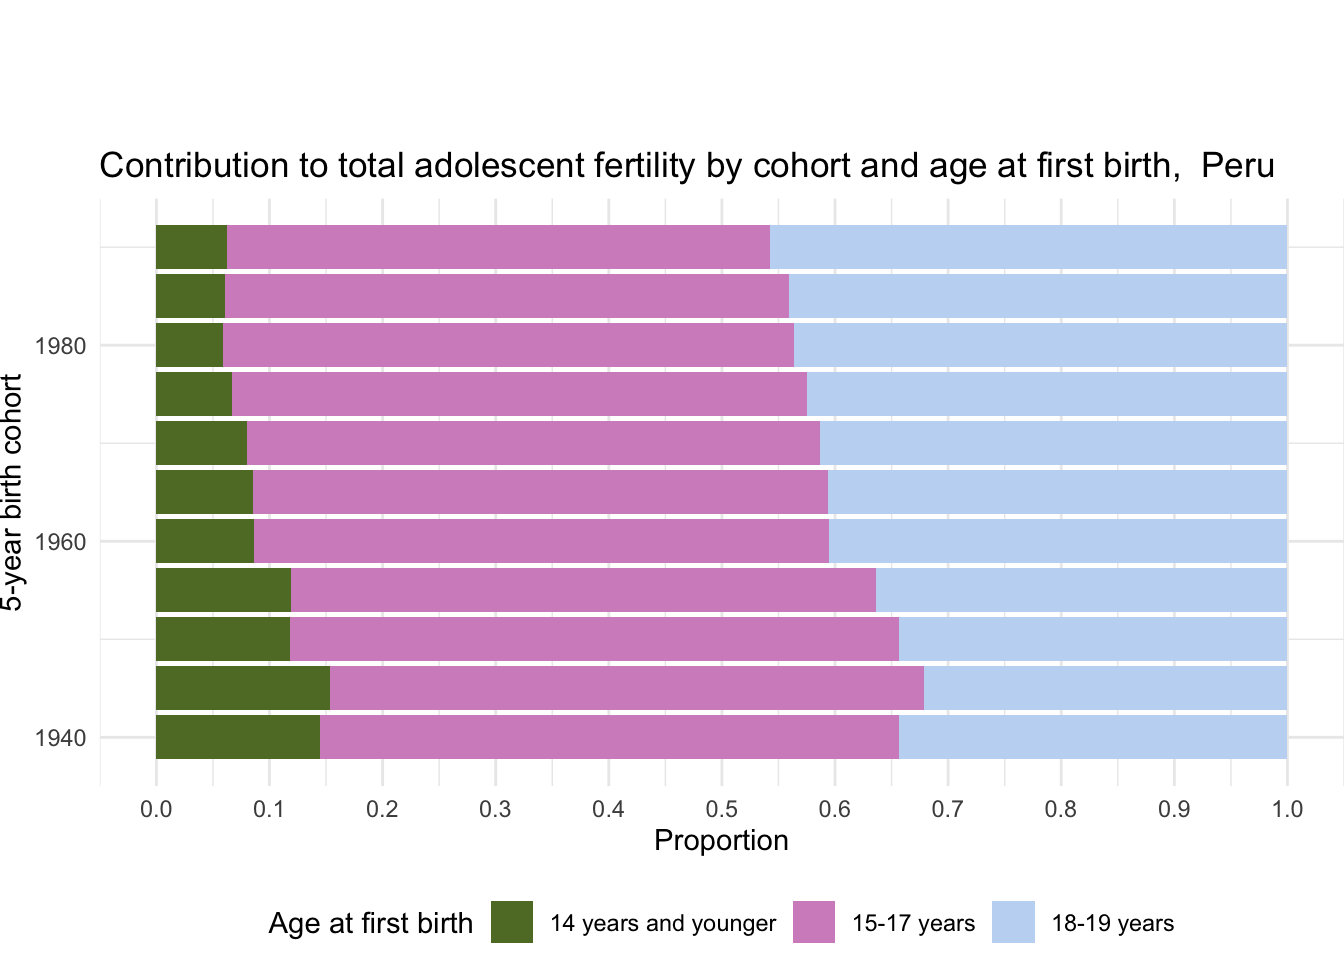
Country | 5-year birth cohort | Age at first birth | Unweighted cases | Proportion | |
---|---|---|---|---|---|
|
|
|
|
| |
1 | Peru | 1940 | 14 years and younger | 79 | 0.15 |
2 | Peru | 1940 | 15-17 years | 382 | 0.51 |
3 | Peru | 1940 | 18-19 years | 439 | 0.34 |
4 | Peru | 1945 | 14 years and younger | 161 | 0.15 |
5 | Peru | 1945 | 15-17 years | 776 | 0.53 |
6 | Peru | 1945 | 18-19 years | 802 | 0.32 |
7 | Peru | 1950 | 14 years and younger | 252 | 0.12 |
8 | Peru | 1950 | 15-17 years | 1,541 | 0.54 |
9 | Peru | 1950 | 18-19 years | 1,600 | 0.34 |
10 | Peru | 1955 | 14 years and younger | 364 | 0.12 |
Showing 1 to 10 of 33 entries
6.18.4 Contribution to total adolescent fertility by age at first birth (all cohorts)
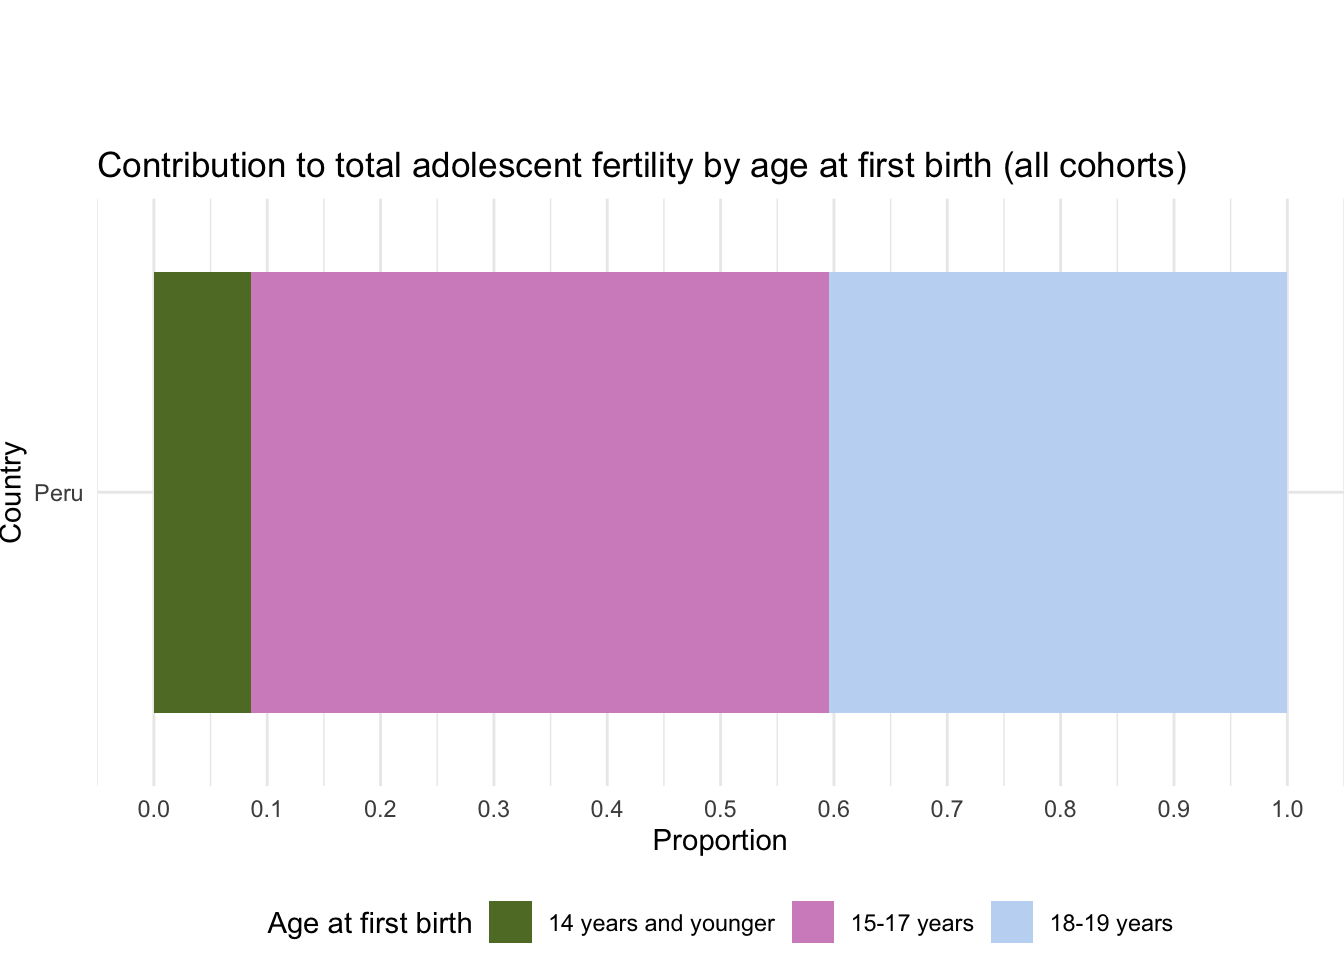
Country | Age at first birth | Unweighted cases | Proportion | |
---|---|---|---|---|
|
|
|
| |
1 | Peru | 14 years and younger | 3,505 | 0.09 |
2 | Peru | 15-17 years | 29,091 | 0.51 |
3 | Peru | 18-19 years | 33,455 | 0.40 |
Showing 1 to 3 of 3 entries
6.18.5 Completed fertility by motherhood entry age
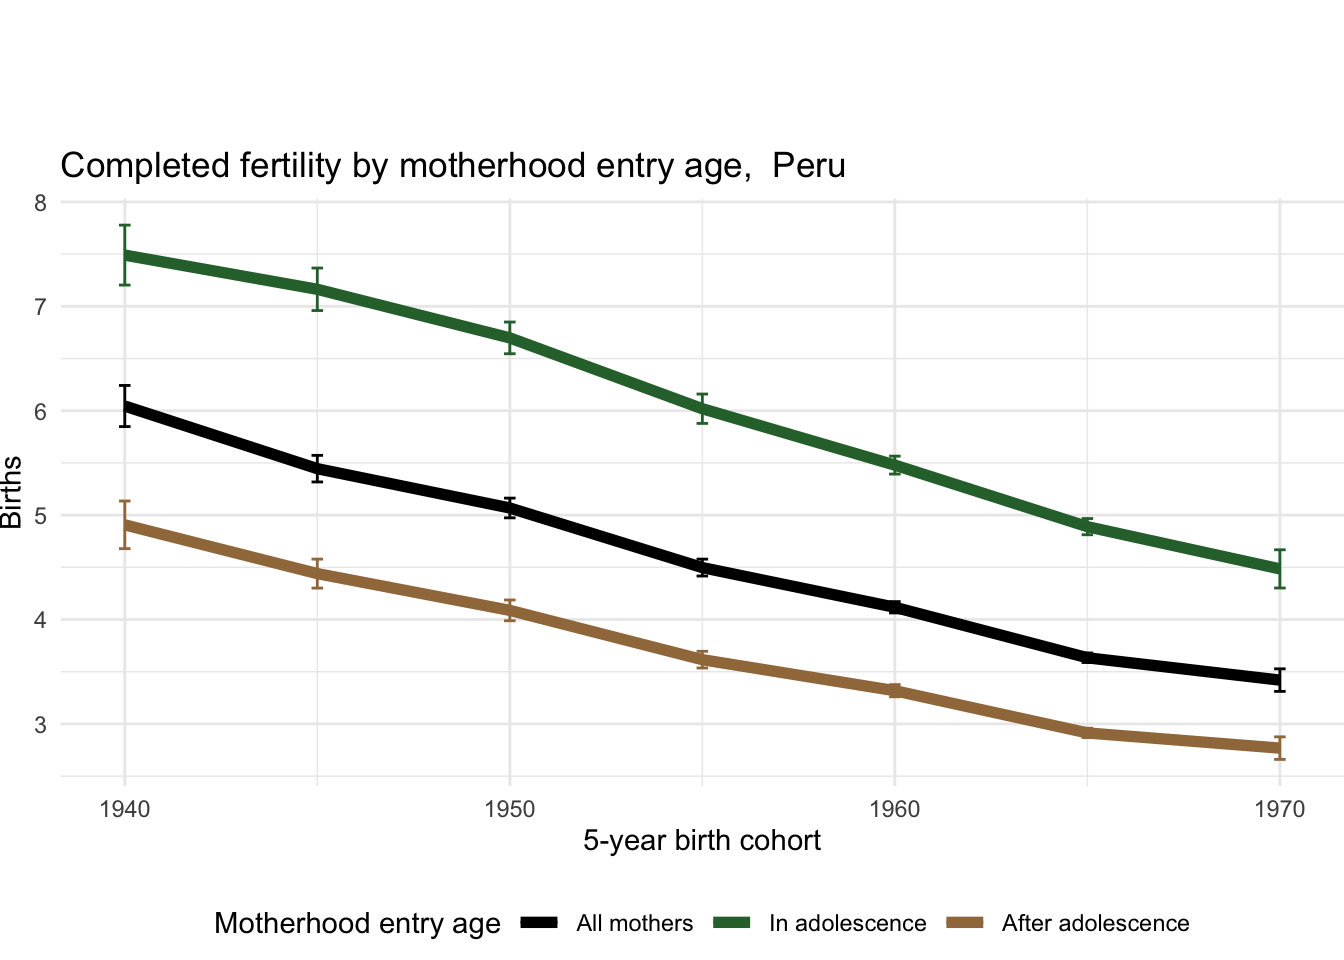
Country | 5-year birth cohort | Age at first birth | Unweighted cases | Number of children | |
---|---|---|---|---|---|
|
|
|
|
| |
1 | Peru | 1940 | All mothers | 1,080 | 6.05 |
2 | Peru | 1940 | In adolescence | 490 | 7.49 |
3 | Peru | 1940 | After adolescence | 590 | 4.91 |
4 | Peru | 1945 | All mothers | 2,673 | 5.45 |
5 | Peru | 1945 | In adolescence | 1,068 | 7.16 |
6 | Peru | 1945 | After adolescence | 1,605 | 4.44 |
7 | Peru | 1950 | All mothers | 5,018 | 5.07 |
8 | Peru | 1950 | In adolescence | 2,086 | 6.70 |
9 | Peru | 1950 | After adolescence | 2,932 | 4.09 |
10 | Peru | 1955 | All mothers | 5,848 | 4.50 |
Showing 1 to 10 of 21 entries
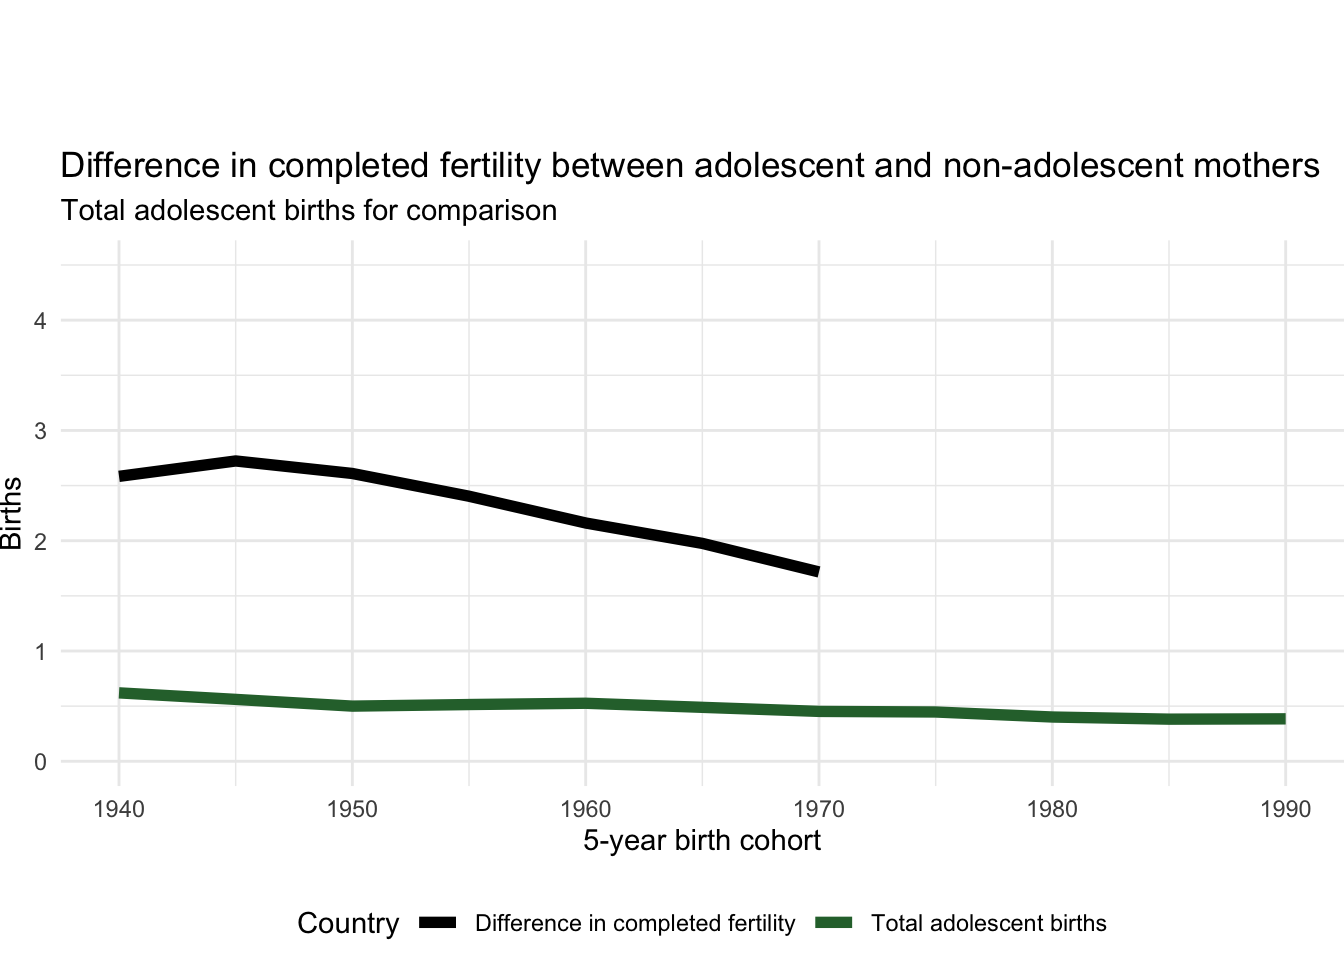
6.18.6 Difference in completed fertility between adolescent and non-adolescent mothers
Country | 5-year birth cohort | Difference in number of births | |
---|---|---|---|
|
|
| |
1 | Peru | 1940 | 2.58 |
2 | Peru | 1945 | 2.72 |
3 | Peru | 1950 | 2.61 |
4 | Peru | 1955 | 2.40 |
5 | Peru | 1960 | 2.16 |
6 | Peru | 1965 | 1.98 |
7 | Peru | 1970 | 1.72 |
Showing 1 to 7 of 7 entries
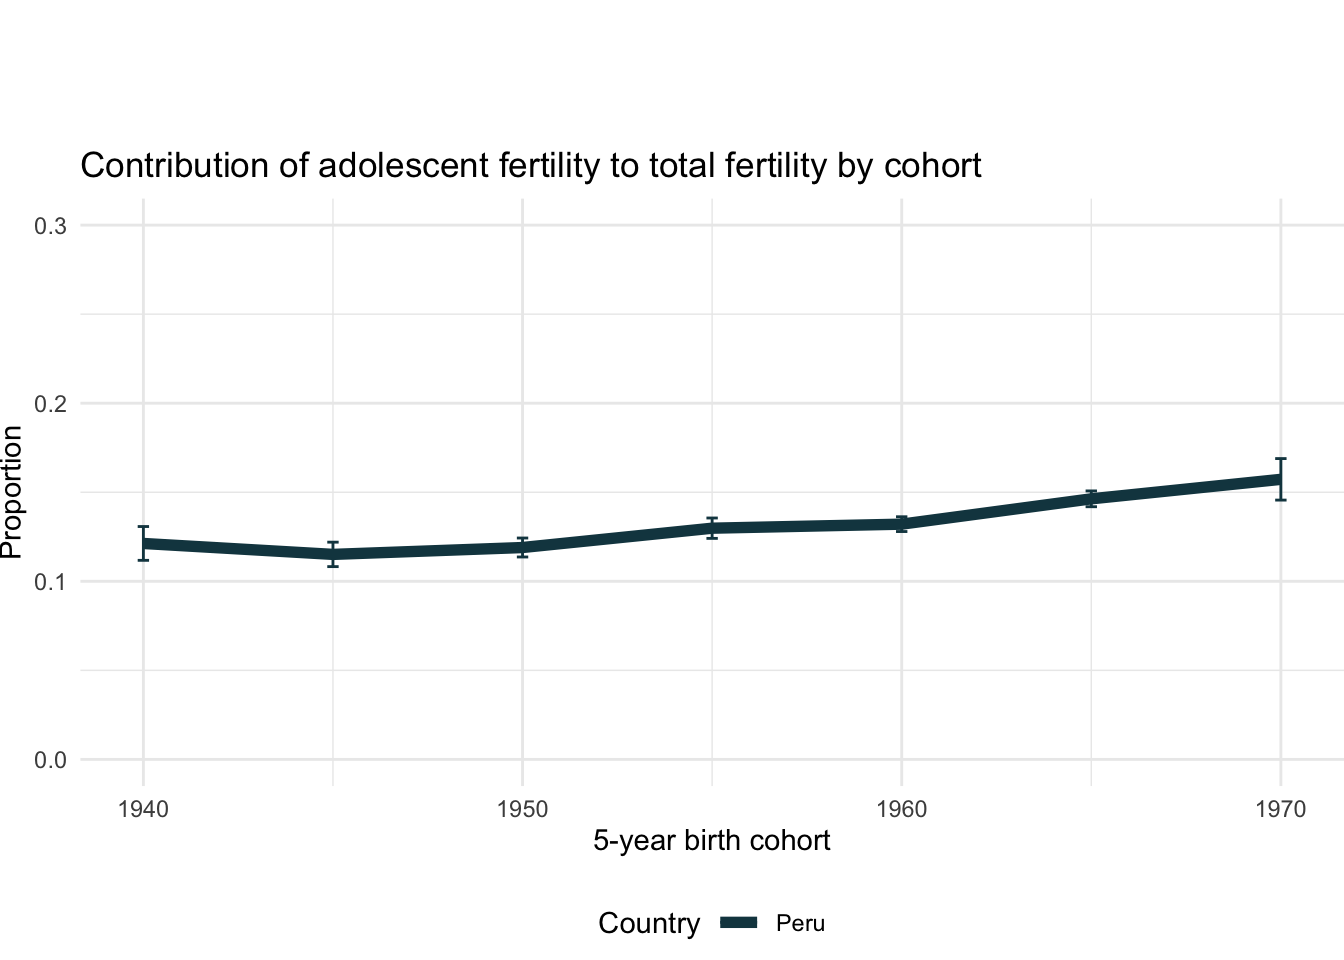
6.18.7 Contribution of adolescent fertility to total fertility by cohort
Country | 5-year birth cohort | Unweighted cases | Proportion | |
---|---|---|---|---|
|
|
|
| |
1 | Peru | 1940 | 1,080 | 0.12 |
2 | Peru | 1945 | 2,673 | 0.12 |
3 | Peru | 1950 | 5,018 | 0.12 |
4 | Peru | 1955 | 5,848 | 0.13 |
5 | Peru | 1960 | 11,653 | 0.13 |
6 | Peru | 1965 | 11,852 | 0.15 |
7 | Peru | 1970 | 1,758 | 0.16 |
Showing 1 to 7 of 7 entries
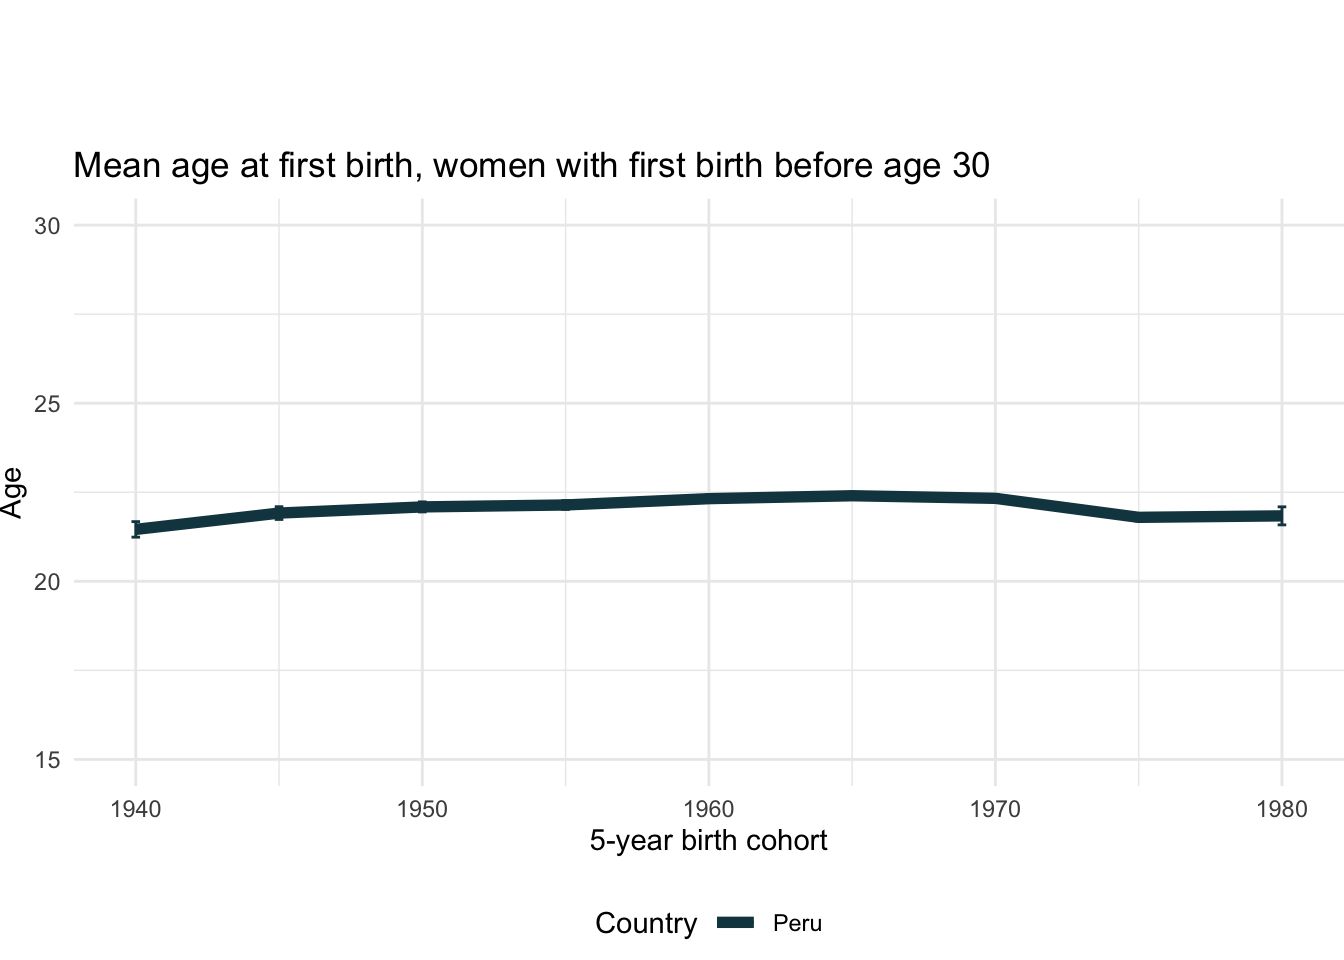
6.18.8 Mean age at first birth
Country | 5-year birth cohort | Unweighted cases | Mean age | |
---|---|---|---|---|
|
|
|
| |
1 | Peru | 1940 | 1,929 | 21.46 |
2 | Peru | 1945 | 3,504 | 21.92 |
3 | Peru | 1950 | 6,852 | 22.09 |
4 | Peru | 1955 | 10,558 | 22.14 |
5 | Peru | 1960 | 19,485 | 22.32 |
6 | Peru | 1965 | 20,252 | 22.40 |
7 | Peru | 1970 | 17,242 | 22.33 |
8 | Peru | 1975 | 12,934 | 21.80 |
9 | Peru | 1980 | 1,806 | 21.84 |
Showing 1 to 9 of 9 entries
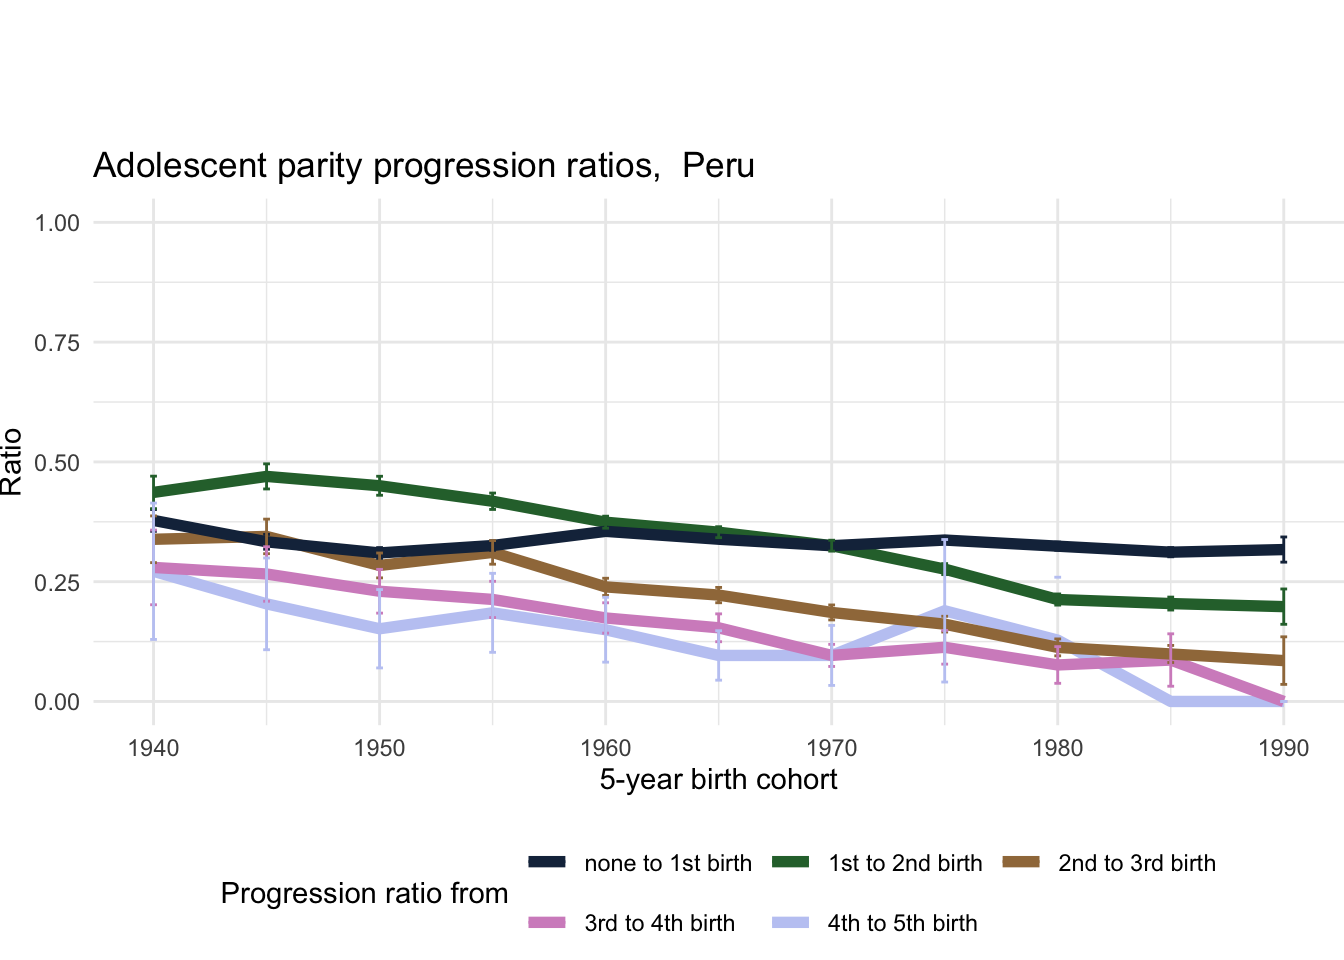
6.18.9 Adolescent parity progression ratios
Country | 5-year birth cohort | Progression ratio from | Unweighted cases | Ratio | |
---|---|---|---|---|---|
|
|
|
|
| |
1 | Peru | 1940 | none to 1st birth | 900 | 0.38 |
2 | Peru | 1940 | 1st to 2nd birth | 402 | 0.44 |
3 | Peru | 1940 | 2nd to 3rd birth | 137 | 0.34 |
4 | Peru | 1940 | 3rd to 4th birth | 41 | 0.28 |
5 | Peru | 1940 | 4th to 5th birth | 12 | 0.27 |
6 | Peru | 1945 | none to 1st birth | 1,739 | 0.33 |
7 | Peru | 1945 | 1st to 2nd birth | 841 | 0.47 |
8 | Peru | 1945 | 2nd to 3rd birth | 292 | 0.34 |
9 | Peru | 1945 | 3rd to 4th birth | 80 | 0.27 |
10 | Peru | 1945 | 4th to 5th birth | 16 | 0.20 |
Showing 1 to 10 of 55 entries
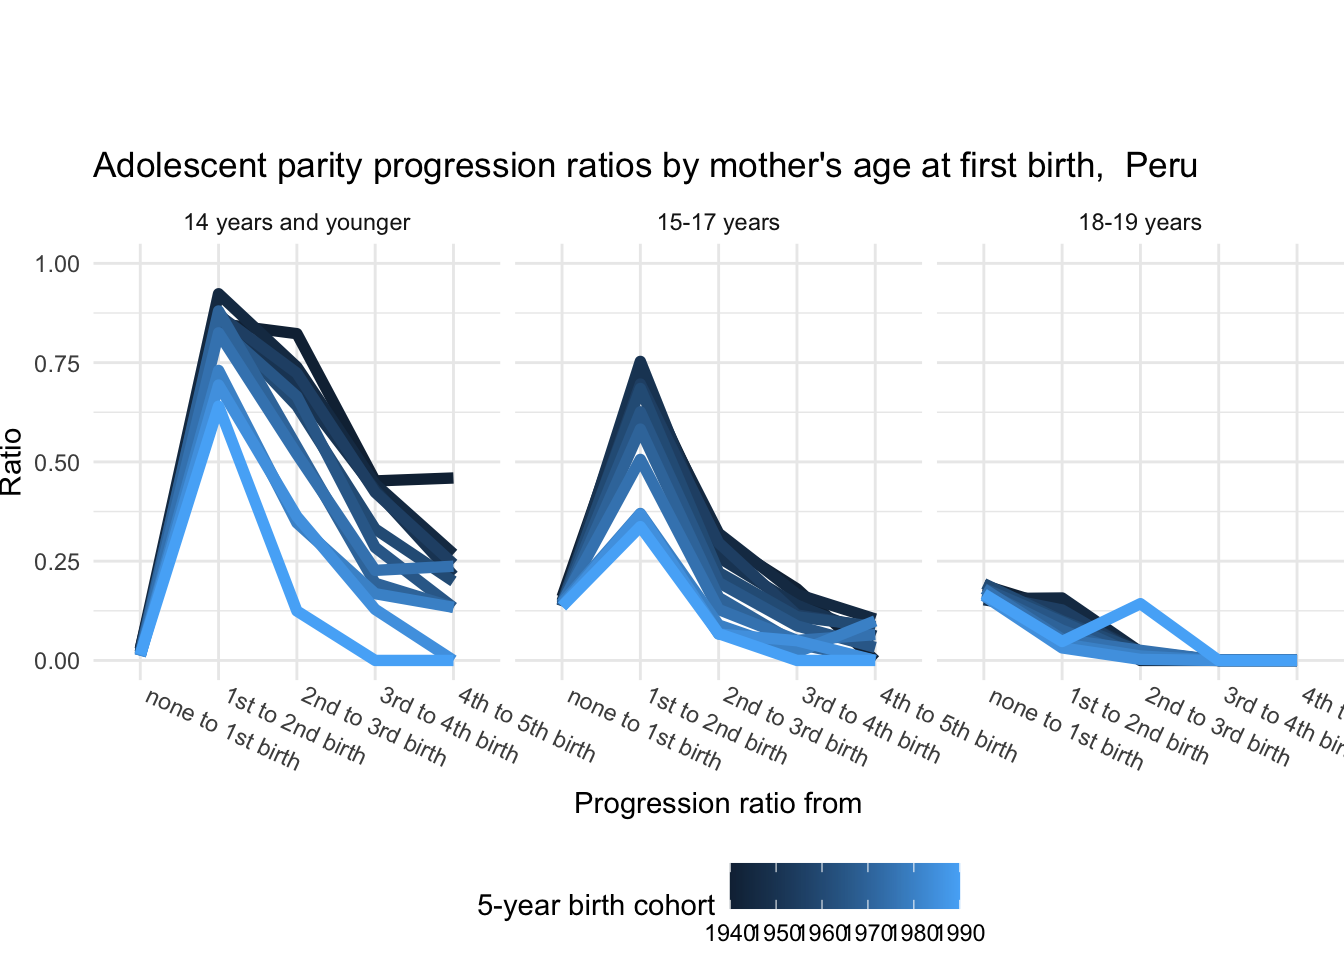
6.18.10 Adolescent parity progression ratios by age
Country | 5-year birth cohort | Age at first birth | Progression ratio from | Unweighted cases | Ratio | |
---|---|---|---|---|---|---|
|
|
|
|
|
| |
1 | Peru | 1940 | 14 years and younger | none to 1st birth | 79 | 0.03 |
2 | Peru | 1940 | 15-17 years | none to 1st birth | 382 | 0.16 |
3 | Peru | 1940 | 18-19 years | none to 1st birth | 439 | 0.19 |
4 | Peru | 1940 | 14 years and younger | 1st to 2nd birth | 68 | 0.85 |
5 | Peru | 1940 | 15-17 years | 1st to 2nd birth | 275 | 0.73 |
6 | Peru | 1940 | 18-19 years | 1st to 2nd birth | 59 | 0.13 |
7 | Peru | 1940 | 14 years and younger | 2nd to 3rd birth | 55 | 0.82 |
8 | Peru | 1940 | 15-17 years | 2nd to 3rd birth | 82 | 0.31 |
9 | Peru | 1940 | 18-19 years | 2nd to 3rd birth | 0 | 0.00 |
10 | Peru | 1940 | 14 years and younger | 3rd to 4th birth | 26 | 0.45 |
Showing 1 to 10 of 165 entries
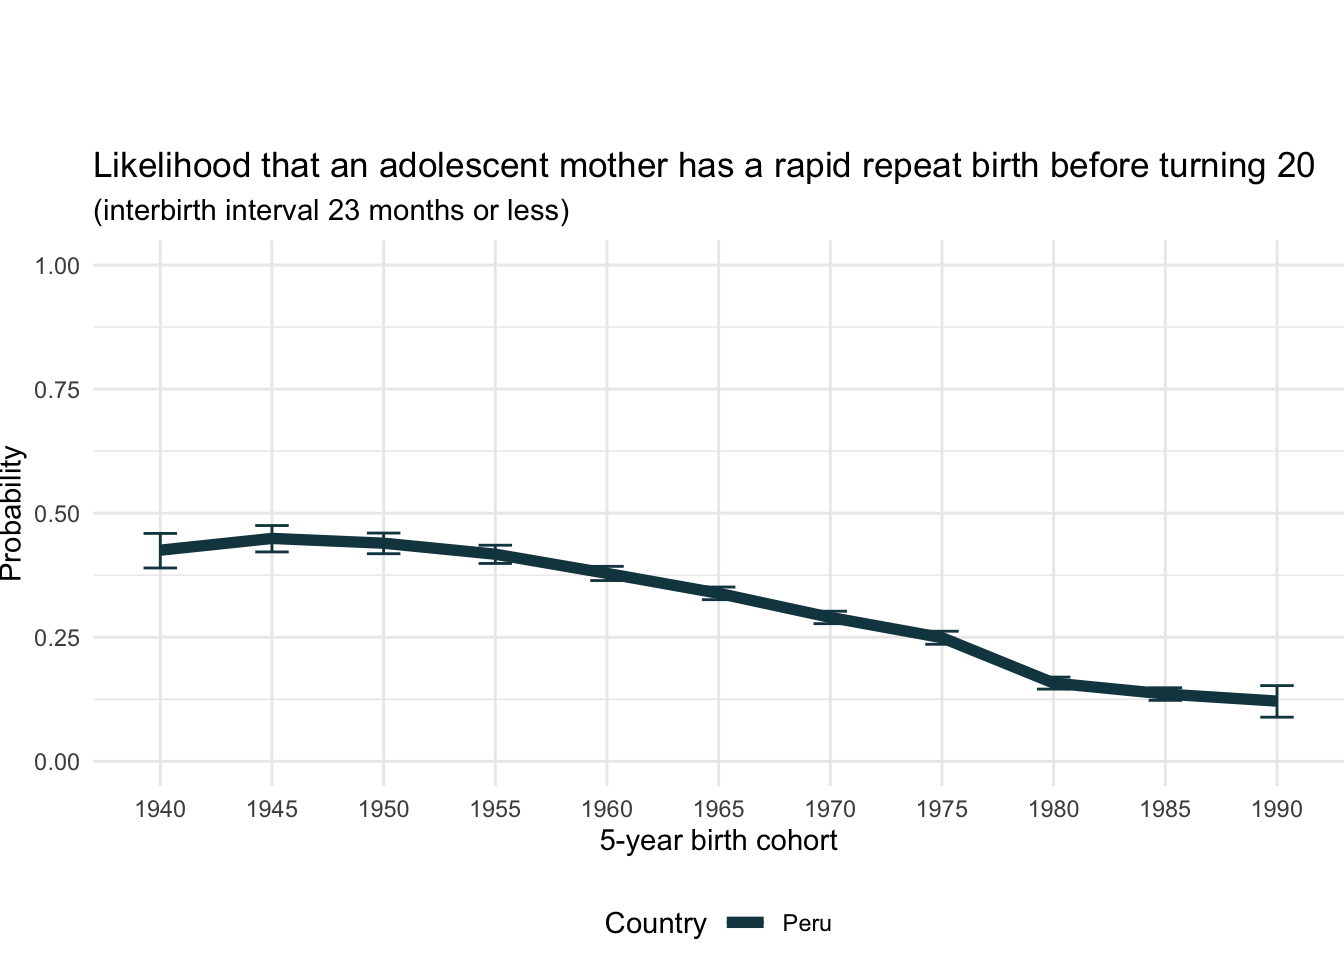
6.18.11 Rapid Repeat Birth probability
Country | 5-year birth cohort | Likelihood | |
---|---|---|---|
|
|
| |
1 | Peru | 1940 | 0.43 |
2 | Peru | 1945 | 0.45 |
3 | Peru | 1950 | 0.44 |
4 | Peru | 1955 | 0.42 |
5 | Peru | 1960 | 0.38 |
6 | Peru | 1965 | 0.34 |
7 | Peru | 1970 | 0.29 |
8 | Peru | 1975 | 0.25 |
9 | Peru | 1980 | 0.16 |
10 | Peru | 1985 | 0.14 |
Showing 1 to 10 of 11 entries
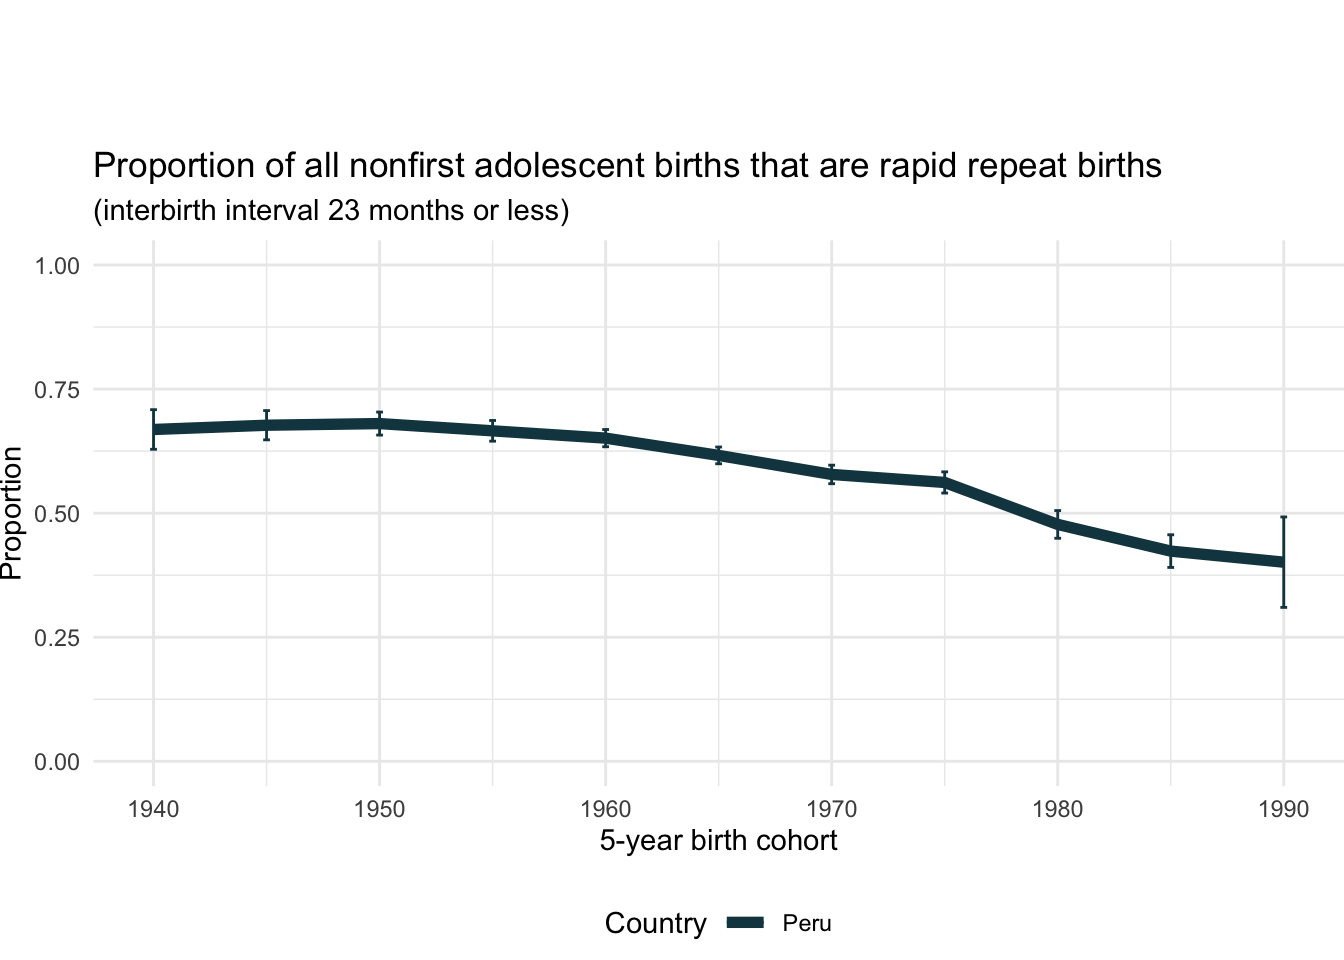
6.18.12 Rapid Repeat Birth proportion
Country | 5-year birth cohort | Unweighted cases (non-first adolescent births) | Proportion | |
---|---|---|---|---|
|
|
|
| |
1 | Peru | 1940 | 599 | 0.67 |
2 | Peru | 1945 | 1,232 | 0.68 |
3 | Peru | 1950 | 2,227 | 0.68 |
4 | Peru | 1955 | 2,958 | 0.67 |
5 | Peru | 1960 | 4,805 | 0.65 |
6 | Peru | 1965 | 5,322 | 0.62 |
7 | Peru | 1970 | 4,751 | 0.58 |
8 | Peru | 1975 | 3,521 | 0.56 |
9 | Peru | 1980 | 2,060 | 0.48 |
10 | Peru | 1985 | 1,446 | 0.42 |
Showing 1 to 10 of 11 entries