3.16 Summary Northern Africa and Western Asia
Summary does not include Palenstinians in Lebanon, which otherwise has a section above.
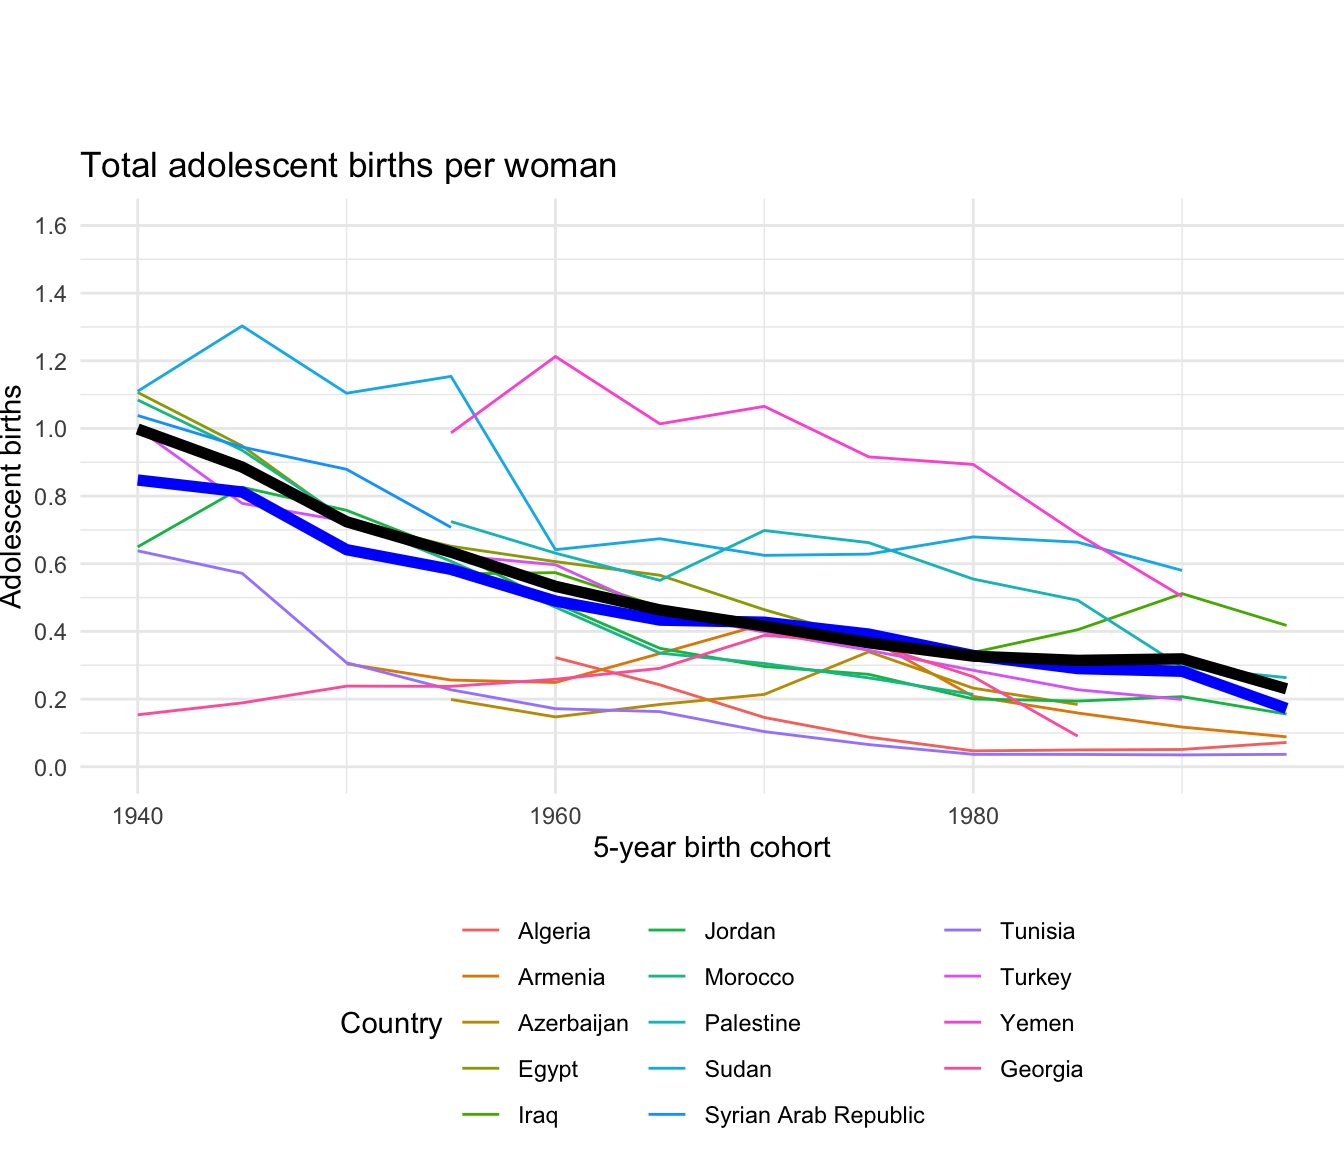
3.16.1 Total adolescent births
Region | 5-year birth cohort | Unweighted average | Weighted average | |
---|---|---|---|---|
|
|
|
| |
1 | Northern Africa and Western Asia | 1940 | 0.85 | 1.00 |
2 | Northern Africa and Western Asia | 1945 | 0.81 | 0.89 |
3 | Northern Africa and Western Asia | 1950 | 0.64 | 0.72 |
4 | Northern Africa and Western Asia | 1955 | 0.58 | 0.63 |
5 | Northern Africa and Western Asia | 1960 | 0.49 | 0.53 |
6 | Northern Africa and Western Asia | 1965 | 0.43 | 0.46 |
7 | Northern Africa and Western Asia | 1970 | 0.43 | 0.42 |
8 | Northern Africa and Western Asia | 1975 | 0.39 | 0.37 |
9 | Northern Africa and Western Asia | 1980 | 0.33 | 0.33 |
10 | Northern Africa and Western Asia | 1985 | 0.29 | 0.31 |
Showing 1 to 10 of 12 entries
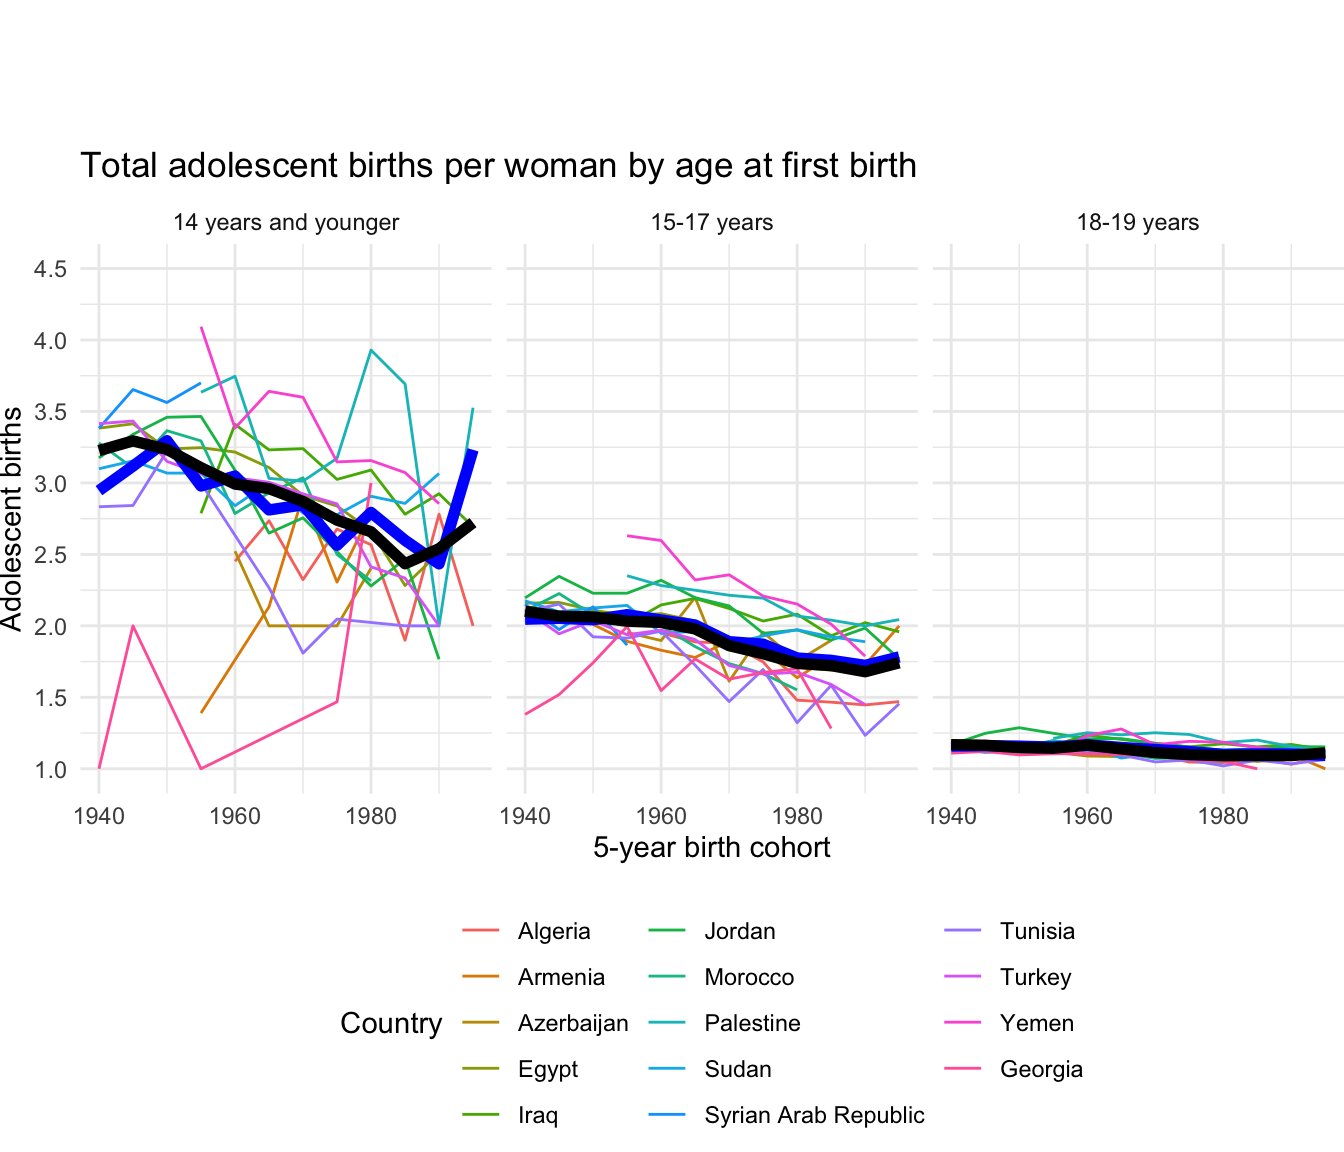
3.16.2 Total adolescent births by age at first birth
Region | 5-year birth cohort | Age at first birth | Unweighted average | Weighted average | |
---|---|---|---|---|---|
|
|
|
|
| |
1 | Northern Africa and Western Asia | 1940 | 14 years and younger | 2.95 | 3.23 |
2 | Northern Africa and Western Asia | 1940 | 15-17 years | 2.05 | 2.10 |
3 | Northern Africa and Western Asia | 1940 | 18-19 years | 1.16 | 1.17 |
4 | Northern Africa and Western Asia | 1945 | 14 years and younger | 3.12 | 3.29 |
5 | Northern Africa and Western Asia | 1945 | 15-17 years | 2.05 | 2.07 |
6 | Northern Africa and Western Asia | 1945 | 18-19 years | 1.16 | 1.16 |
7 | Northern Africa and Western Asia | 1950 | 14 years and younger | 3.30 | 3.23 |
8 | Northern Africa and Western Asia | 1950 | 15-17 years | 2.04 | 2.06 |
9 | Northern Africa and Western Asia | 1950 | 18-19 years | 1.16 | 1.15 |
10 | Northern Africa and Western Asia | 1955 | 14 years and younger | 2.98 | 3.11 |
Showing 1 to 10 of 36 entries
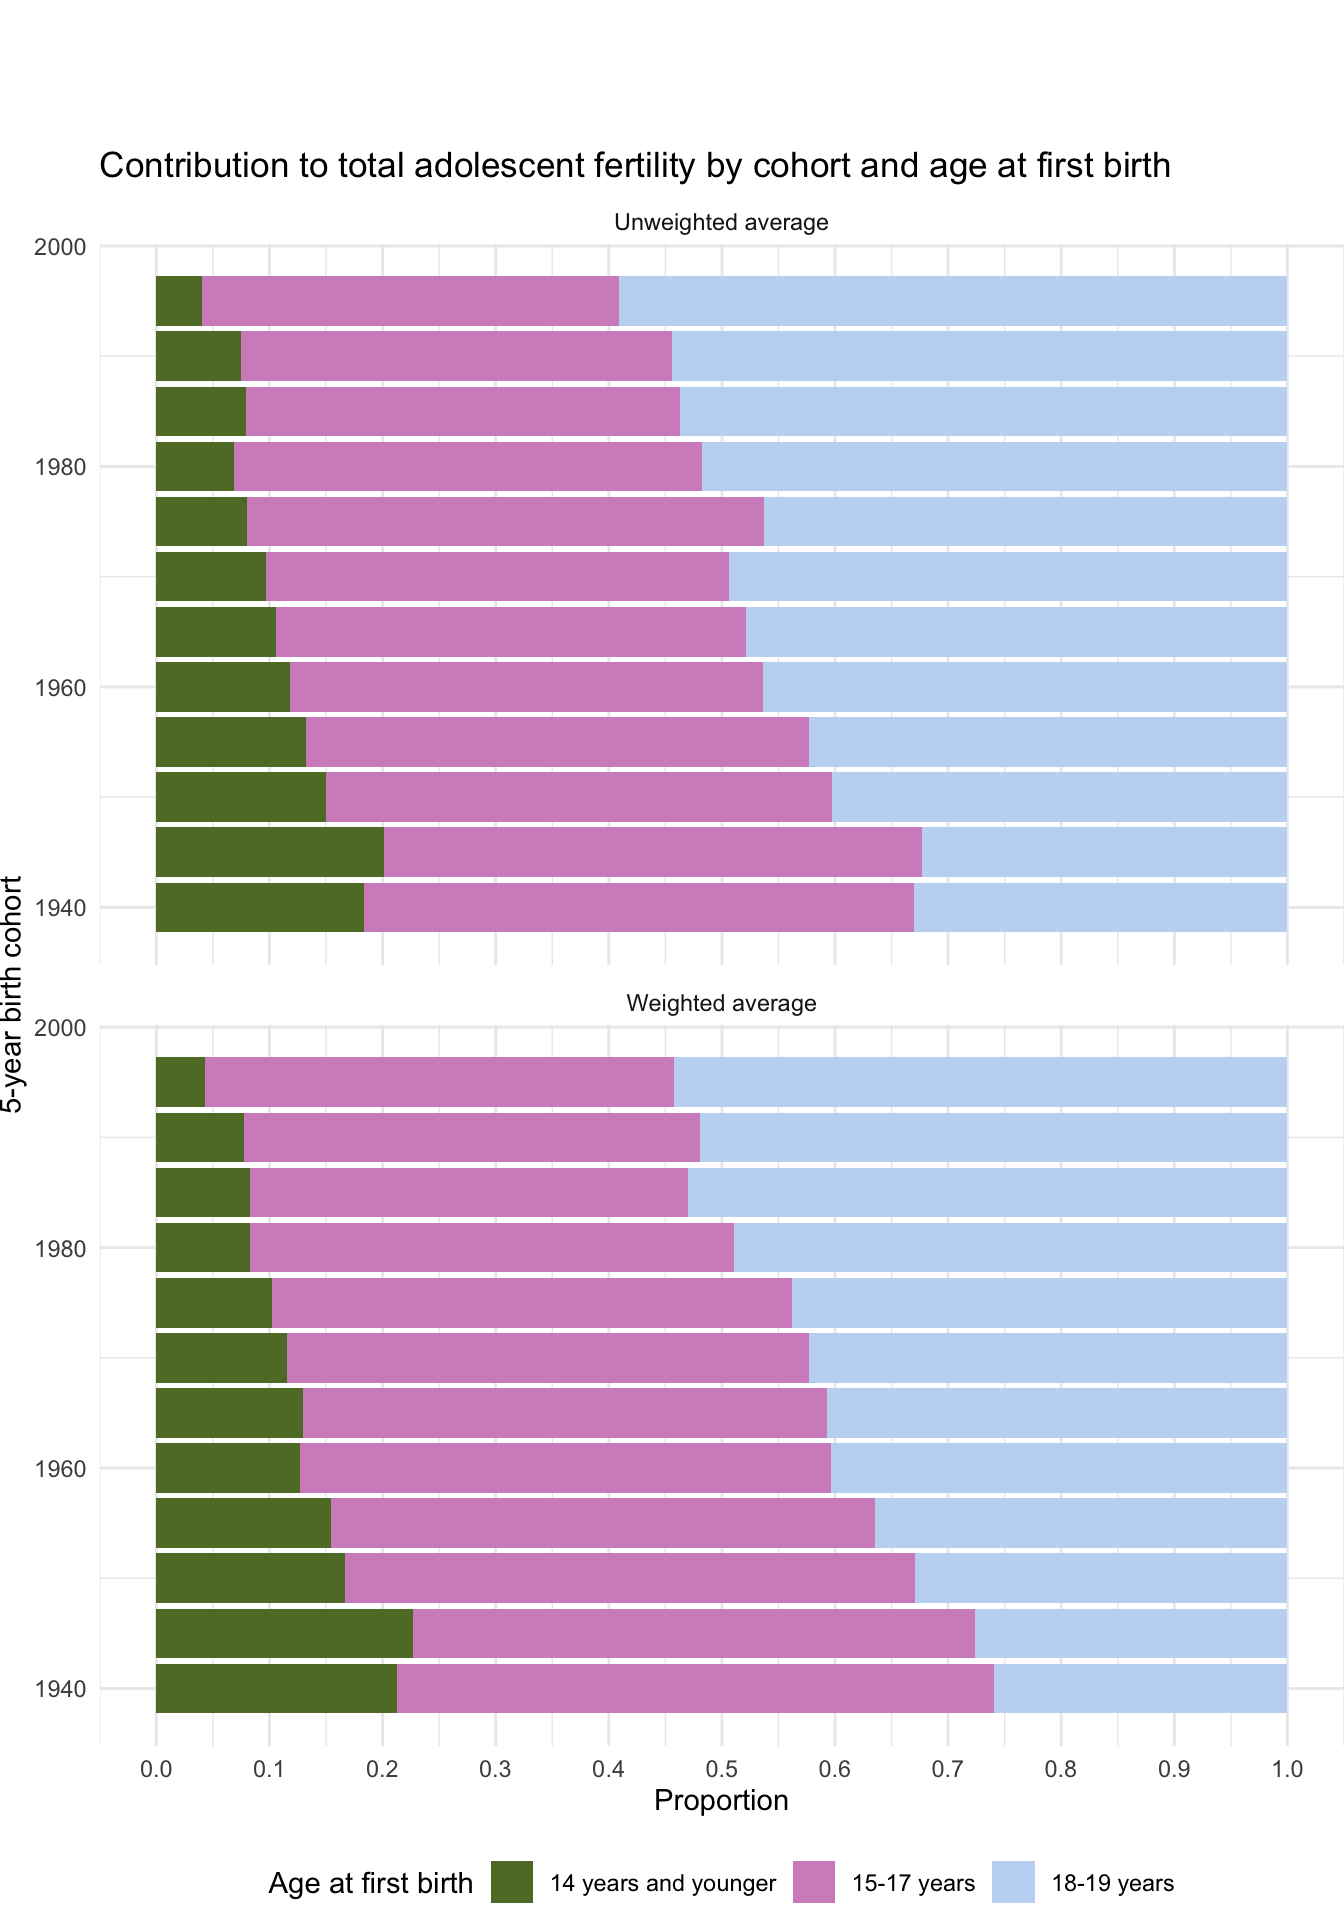
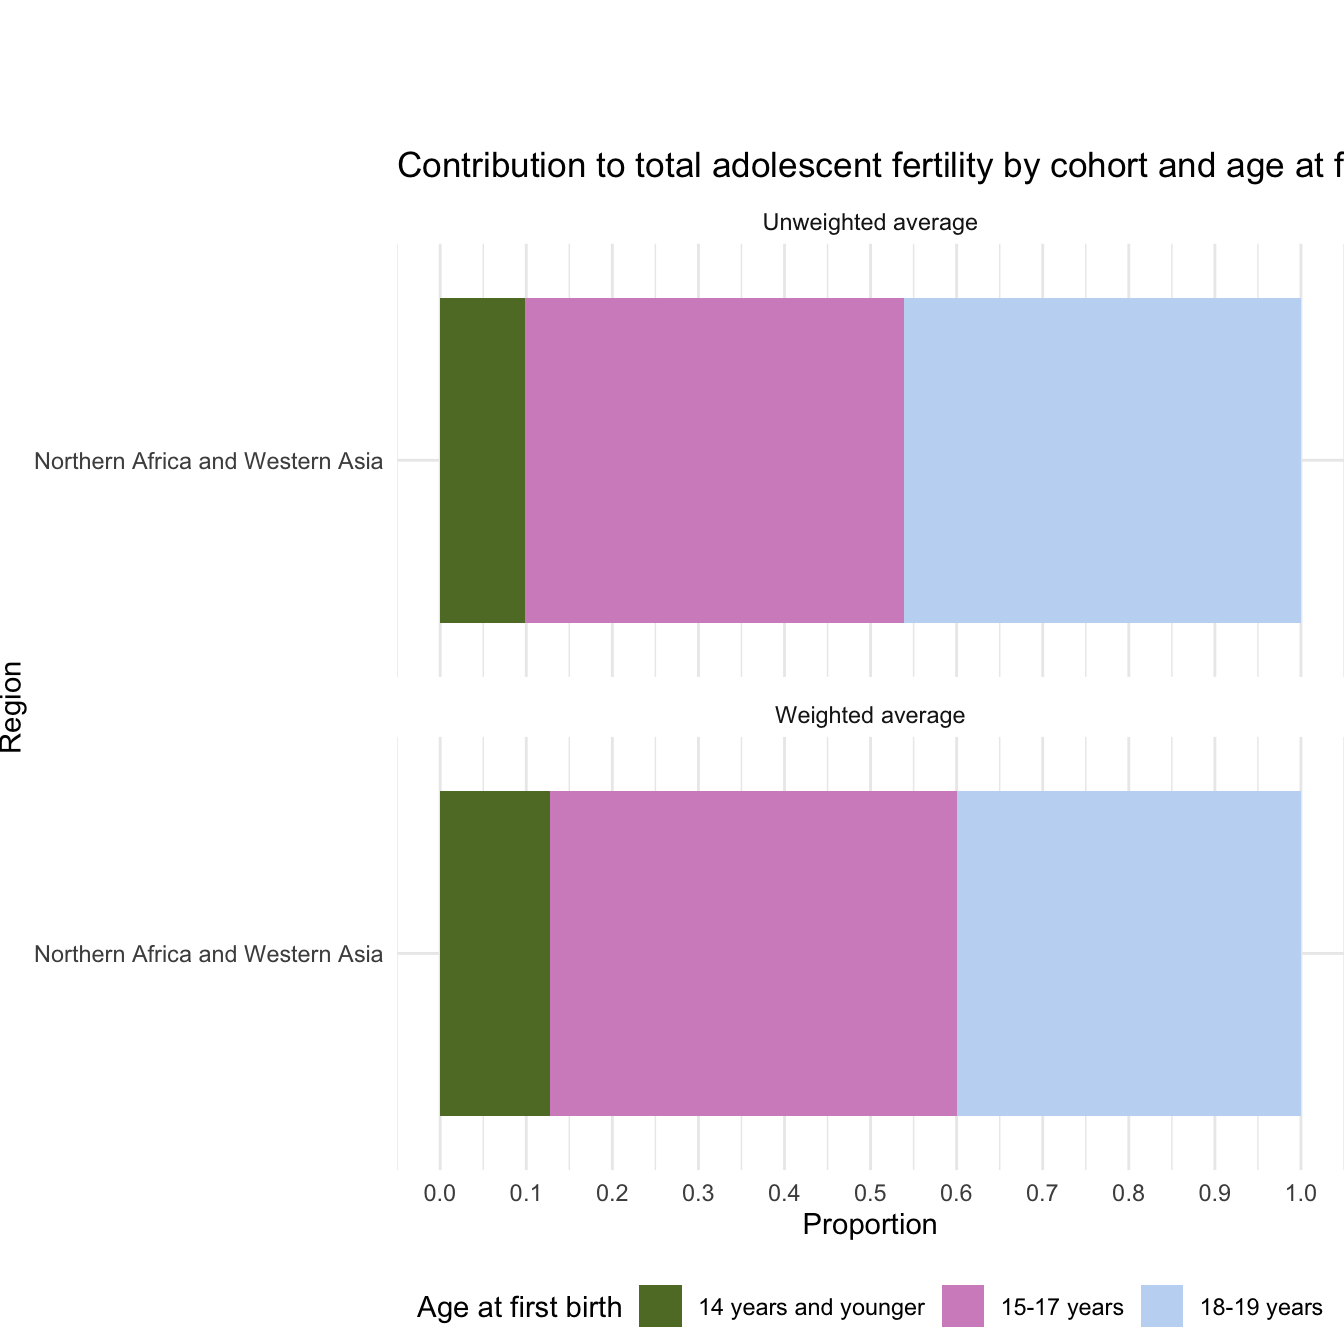
3.16.3 Contribution to total adolescent fertility by cohort and age at first birth
Region | 5-year birth cohort | Age at first birth | Unweighted average | Weighted average | |
---|---|---|---|---|---|
|
|
|
|
| |
1 | Northern Africa and Western Asia | 1940 | 14 years and younger | 0.18 | 0.21 |
2 | Northern Africa and Western Asia | 1940 | 15-17 years | 0.49 | 0.53 |
3 | Northern Africa and Western Asia | 1940 | 18-19 years | 0.33 | 0.26 |
4 | Northern Africa and Western Asia | 1945 | 14 years and younger | 0.20 | 0.23 |
5 | Northern Africa and Western Asia | 1945 | 15-17 years | 0.47 | 0.50 |
6 | Northern Africa and Western Asia | 1945 | 18-19 years | 0.32 | 0.28 |
7 | Northern Africa and Western Asia | 1950 | 14 years and younger | 0.15 | 0.17 |
8 | Northern Africa and Western Asia | 1950 | 15-17 years | 0.45 | 0.50 |
9 | Northern Africa and Western Asia | 1950 | 18-19 years | 0.40 | 0.33 |
10 | Northern Africa and Western Asia | 1955 | 14 years and younger | 0.13 | 0.15 |
Showing 1 to 10 of 36 entries
3.16.4 Contribution to total adolescent fertility by age at first birth (all cohorts)
Region | Age at first birth | Unweighted average | Weighted average | |
---|---|---|---|---|
|
|
|
| |
1 | Northern Africa and Western Asia | 14 years and younger | 0.10 | 0.13 |
2 | Northern Africa and Western Asia | 15-17 years | 0.44 | 0.47 |
3 | Northern Africa and Western Asia | 18-19 years | 0.46 | 0.40 |
Showing 1 to 3 of 3 entries
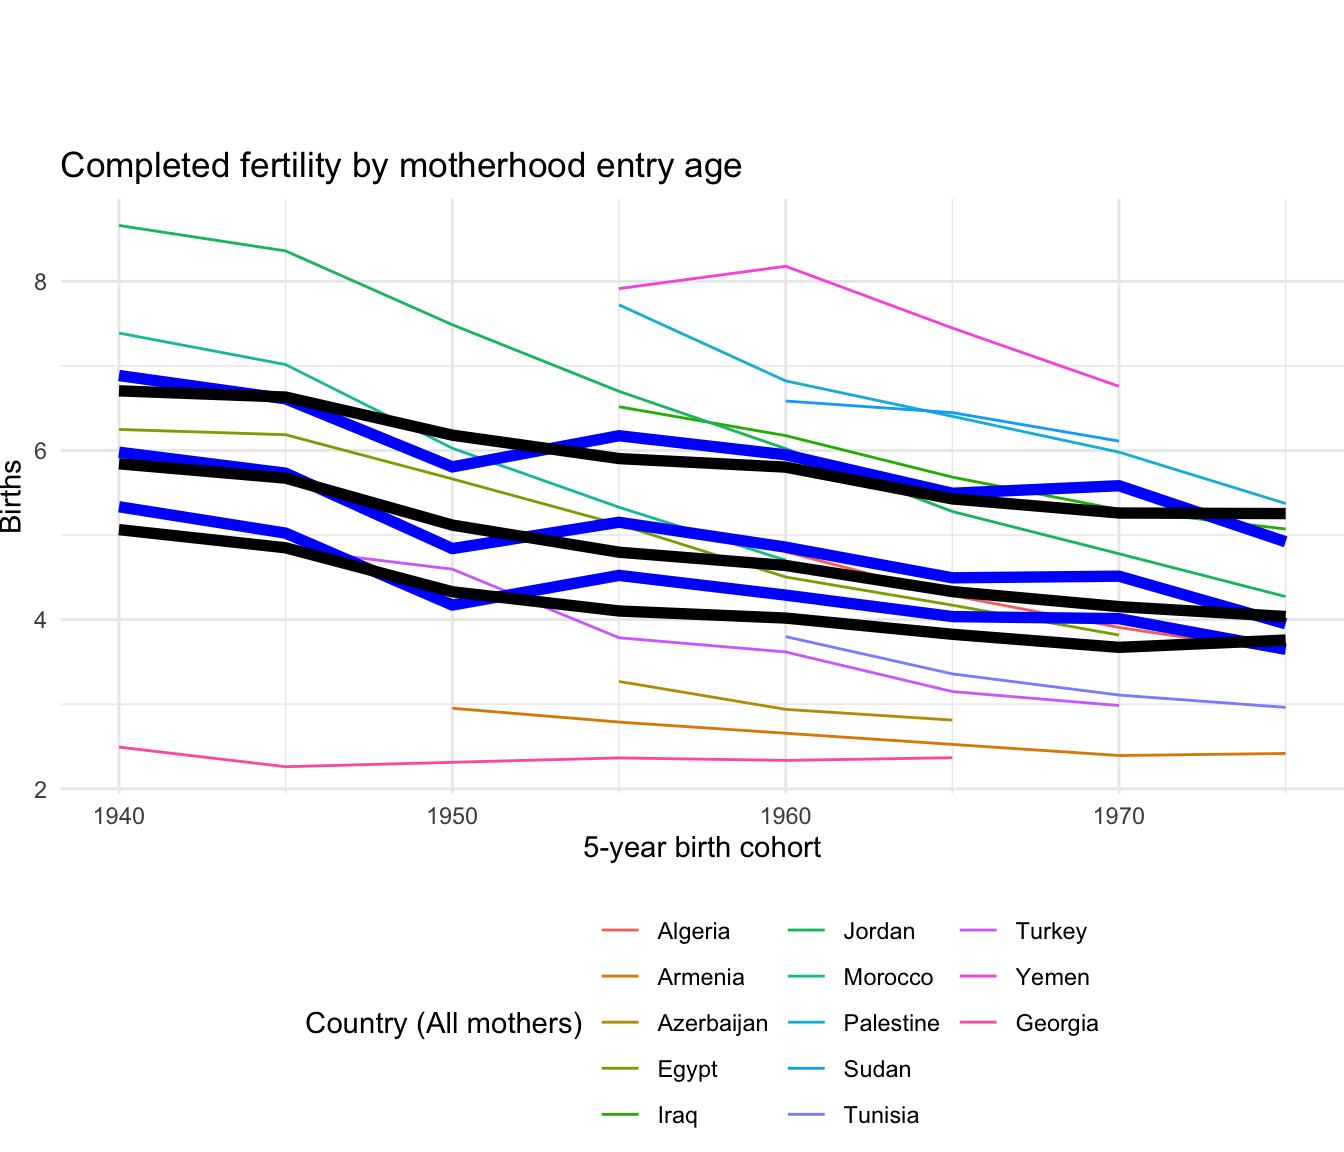
3.16.5 Completed fertility by motherhood entry age
Region | 5-year birth cohort | Age at first birth | Unweighted average | Weighted average | |
---|---|---|---|---|---|
|
|
|
|
| |
1 | Northern Africa and Western Asia | 1940 | All mothers | 5.98 | 5.84 |
2 | Northern Africa and Western Asia | 1940 | In adolescence | 6.89 | 6.70 |
3 | Northern Africa and Western Asia | 1940 | After adolescence | 5.33 | 5.06 |
4 | Northern Africa and Western Asia | 1945 | All mothers | 5.73 | 5.67 |
5 | Northern Africa and Western Asia | 1945 | In adolescence | 6.61 | 6.63 |
6 | Northern Africa and Western Asia | 1945 | After adolescence | 5.02 | 4.85 |
7 | Northern Africa and Western Asia | 1950 | All mothers | 4.84 | 5.12 |
8 | Northern Africa and Western Asia | 1950 | In adolescence | 5.81 | 6.18 |
9 | Northern Africa and Western Asia | 1950 | After adolescence | 4.17 | 4.33 |
10 | Northern Africa and Western Asia | 1955 | All mothers | 5.15 | 4.80 |
Showing 1 to 10 of 24 entries
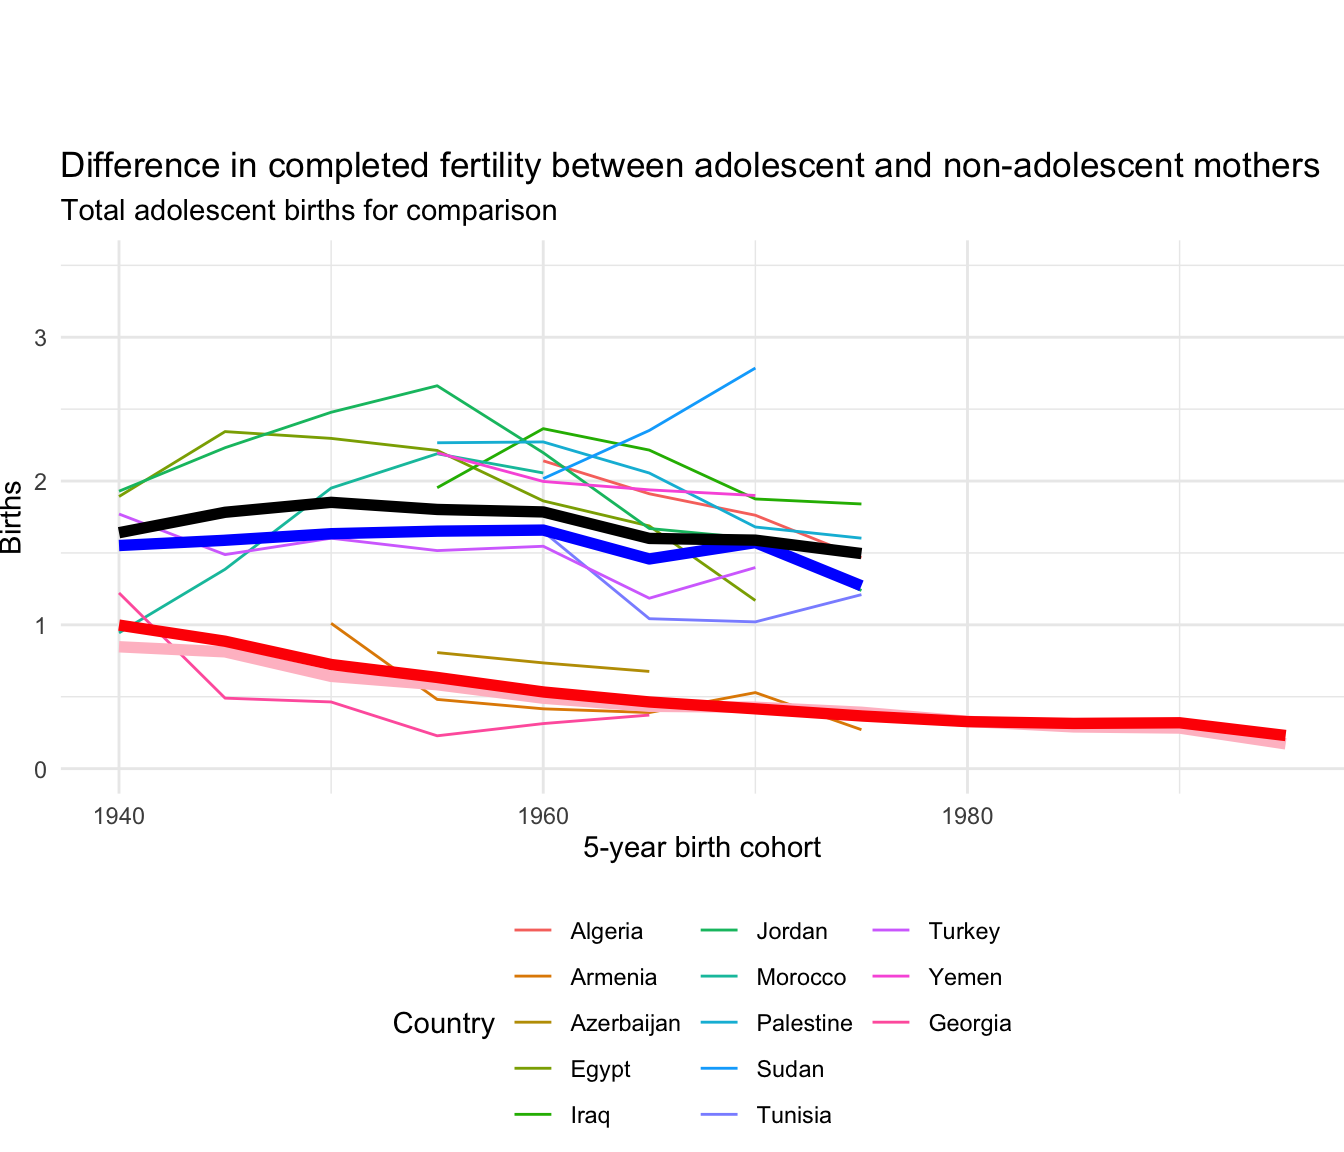
3.16.6 Difference in completed fertility between adolescent and non-adolescent mothers
Region | 5-year birth cohort | Unweighted average | Weighted average | |
---|---|---|---|---|
|
|
|
| |
1 | Northern Africa and Western Asia | 1940 | 1.55 | 1.64 |
2 | Northern Africa and Western Asia | 1945 | 1.59 | 1.78 |
3 | Northern Africa and Western Asia | 1950 | 1.63 | 1.85 |
4 | Northern Africa and Western Asia | 1955 | 1.65 | 1.80 |
5 | Northern Africa and Western Asia | 1960 | 1.66 | 1.79 |
6 | Northern Africa and Western Asia | 1965 | 1.46 | 1.60 |
7 | Northern Africa and Western Asia | 1970 | 1.57 | 1.59 |
8 | Northern Africa and Western Asia | 1975 | 1.27 | 1.50 |
Showing 1 to 8 of 8 entries
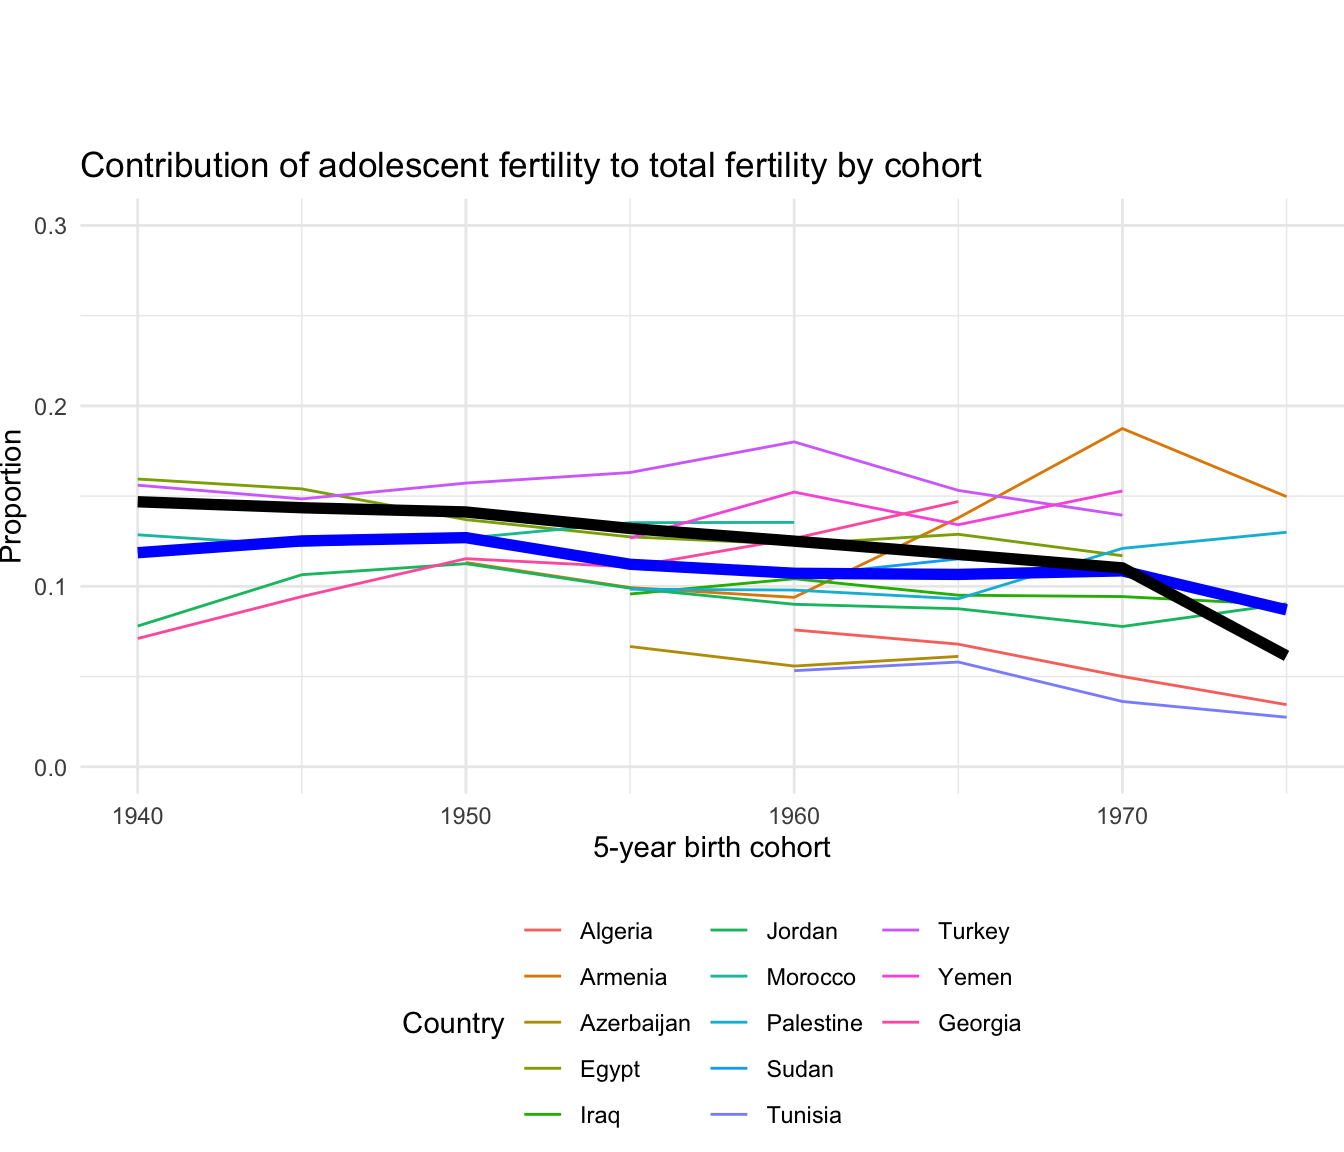
3.16.7 Contribution of adolescent fertility to total fertility by cohort
Region | 5-year birth cohort | Unweighted proportion | Weighted proportion | |
---|---|---|---|---|
|
|
|
| |
1 | Northern Africa and Western Asia | 1940 | 0.12 | 0.15 |
2 | Northern Africa and Western Asia | 1945 | 0.13 | 0.14 |
3 | Northern Africa and Western Asia | 1950 | 0.13 | 0.14 |
4 | Northern Africa and Western Asia | 1955 | 0.11 | 0.13 |
5 | Northern Africa and Western Asia | 1960 | 0.11 | 0.13 |
6 | Northern Africa and Western Asia | 1965 | 0.11 | 0.12 |
7 | Northern Africa and Western Asia | 1970 | 0.11 | 0.11 |
8 | Northern Africa and Western Asia | 1975 | 0.09 | 0.06 |
Showing 1 to 8 of 8 entries
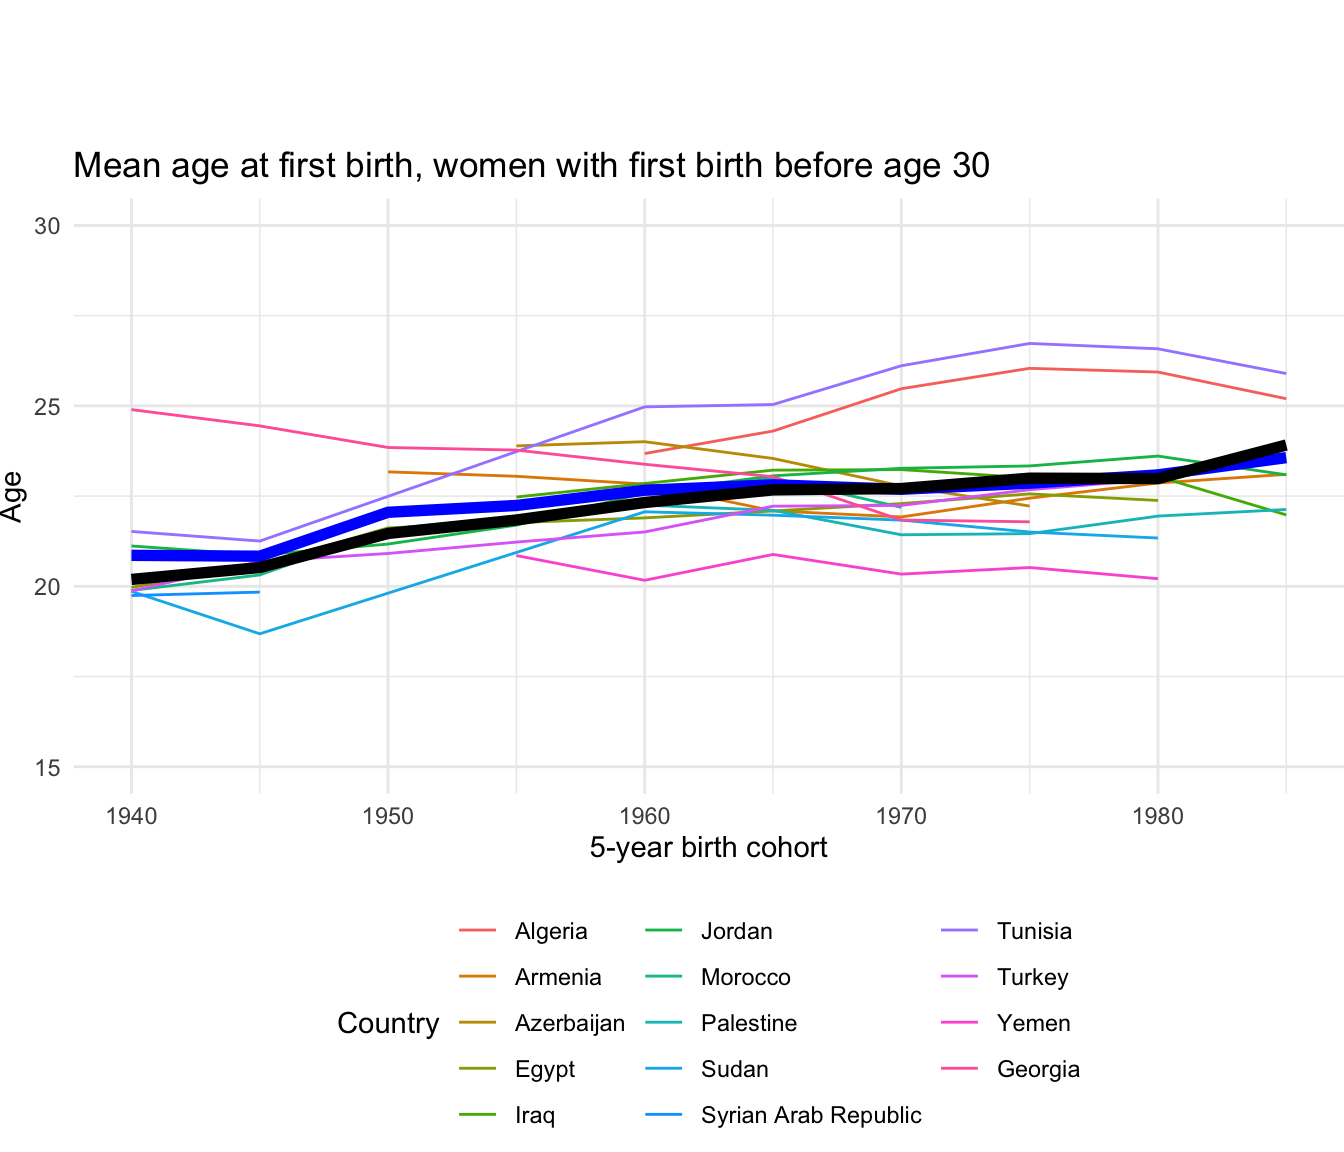
3.16.8 Mean age at first birth
Region | 5-year birth cohort | Unweighted average | Weighted average | |
---|---|---|---|---|
|
|
|
| |
1 | Northern Africa and Western Asia | 1940 | 20.9 | 20.2 |
2 | Northern Africa and Western Asia | 1945 | 20.8 | 20.5 |
3 | Northern Africa and Western Asia | 1950 | 22.1 | 21.5 |
4 | Northern Africa and Western Asia | 1955 | 22.2 | 21.8 |
5 | Northern Africa and Western Asia | 1960 | 22.7 | 22.3 |
6 | Northern Africa and Western Asia | 1965 | 22.8 | 22.7 |
7 | Northern Africa and Western Asia | 1970 | 22.7 | 22.7 |
8 | Northern Africa and Western Asia | 1975 | 22.9 | 23.0 |
9 | Northern Africa and Western Asia | 1980 | 23.1 | 23.0 |
10 | Northern Africa and Western Asia | 1985 | 23.6 | 23.9 |
Showing 1 to 10 of 10 entries
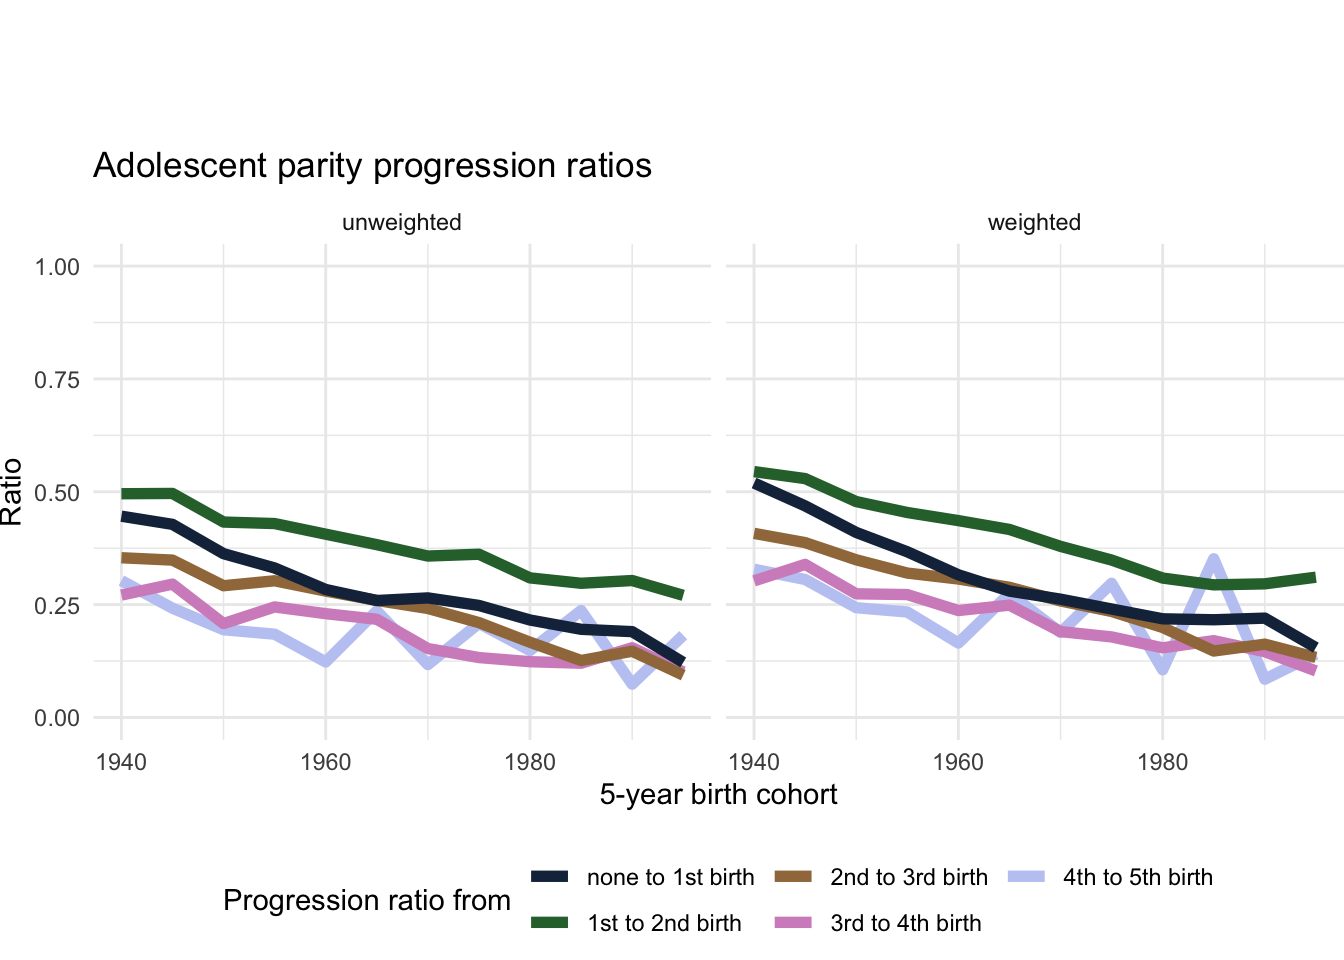
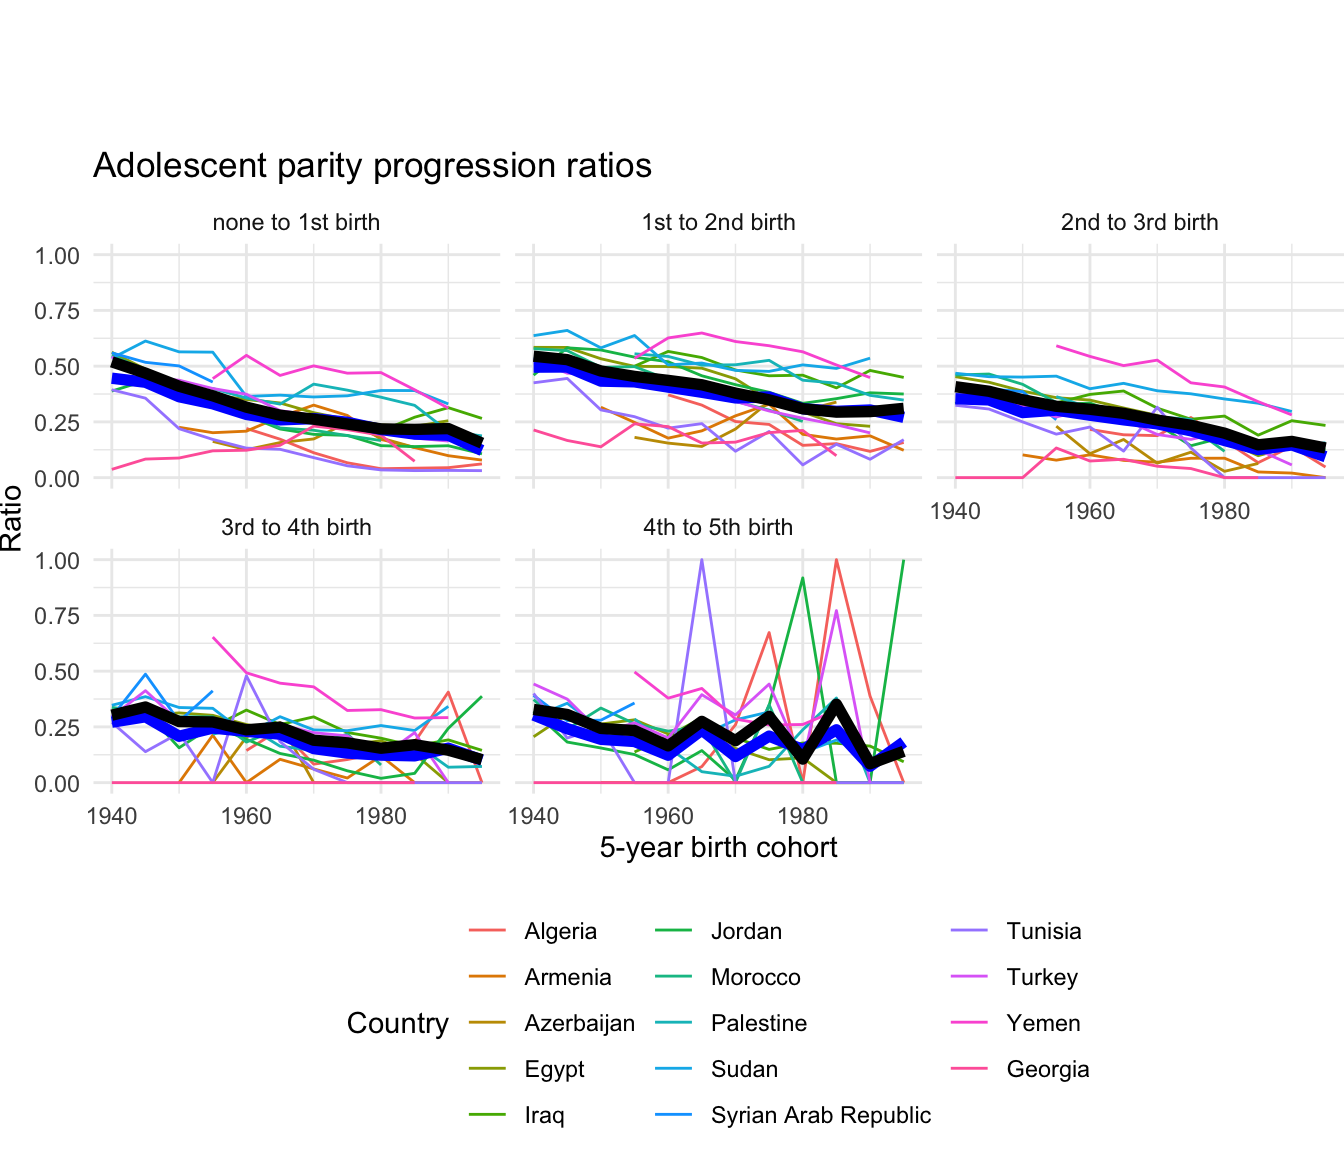
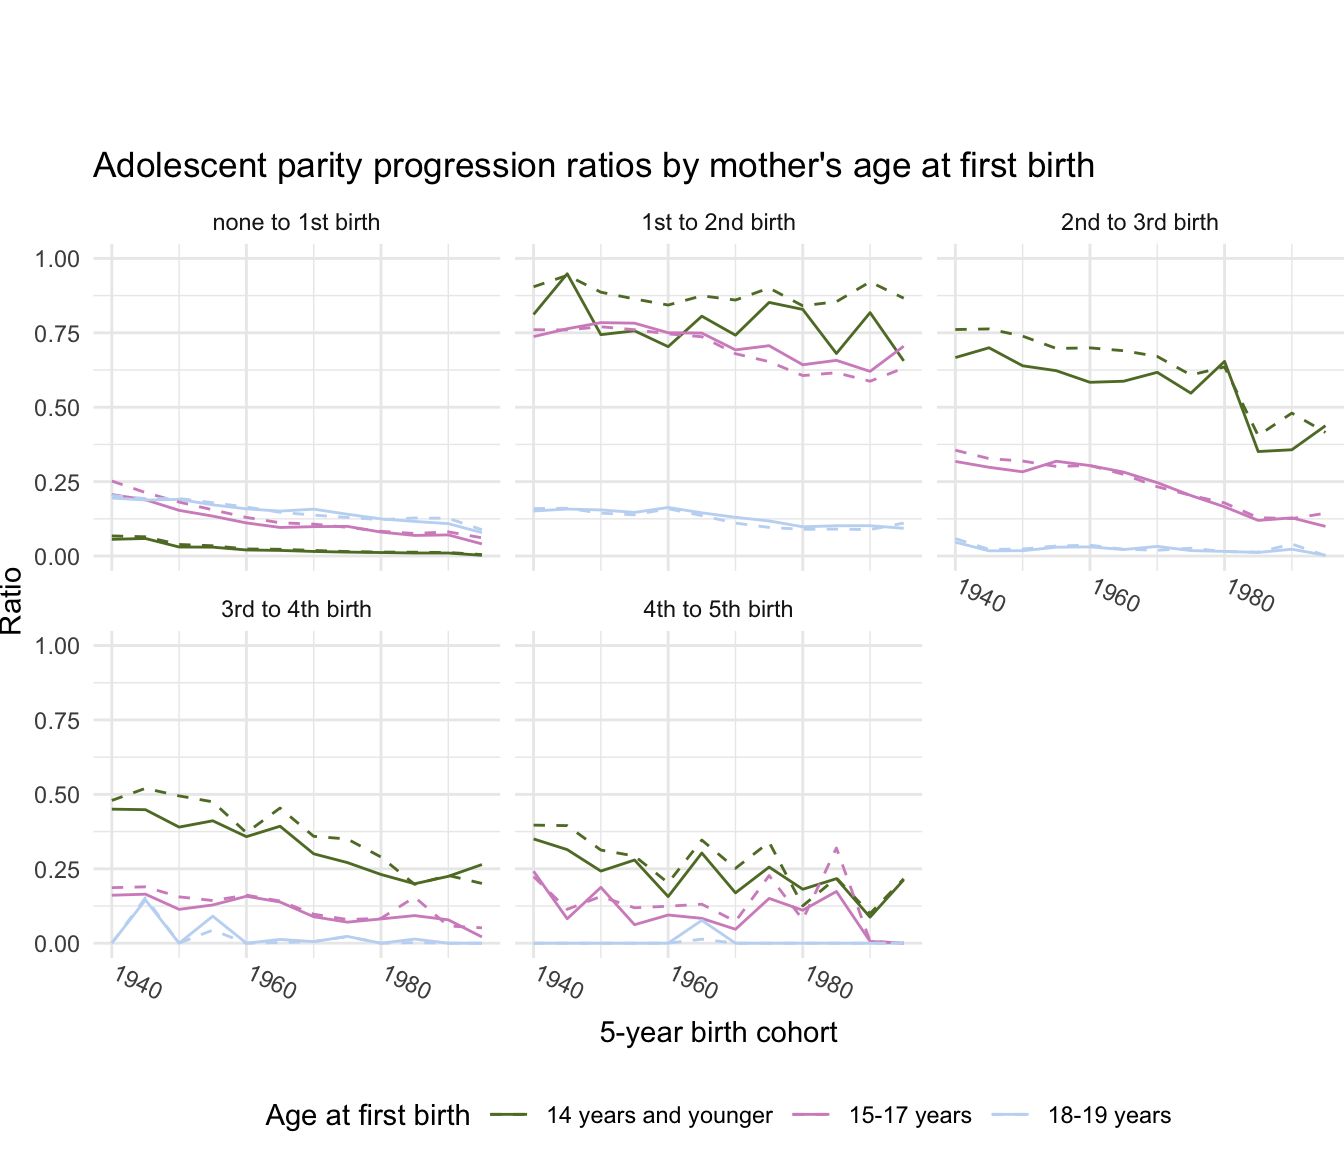
3.16.9 Adolescent parity progression ratios
Region | 5-year birth cohort | Progression ratio from | Unweighted average | Weighted average | |
---|---|---|---|---|---|
|
|
|
|
| |
1 | Northern Africa and Western Asia | 1940 | 4th to 5th birth | 0.30 | 0.33 |
2 | Northern Africa and Western Asia | 1940 | 3rd to 4th birth | 0.27 | 0.30 |
3 | Northern Africa and Western Asia | 1940 | 2nd to 3rd birth | 0.35 | 0.41 |
4 | Northern Africa and Western Asia | 1940 | 1st to 2nd birth | 0.50 | 0.54 |
5 | Northern Africa and Western Asia | 1940 | none to 1st birth | 0.45 | 0.52 |
6 | Northern Africa and Western Asia | 1945 | 4th to 5th birth | 0.24 | 0.31 |
7 | Northern Africa and Western Asia | 1945 | 3rd to 4th birth | 0.30 | 0.34 |
8 | Northern Africa and Western Asia | 1945 | 2nd to 3rd birth | 0.35 | 0.39 |
9 | Northern Africa and Western Asia | 1945 | 1st to 2nd birth | 0.50 | 0.53 |
10 | Northern Africa and Western Asia | 1945 | none to 1st birth | 0.43 | 0.47 |
Showing 1 to 10 of 60 entries
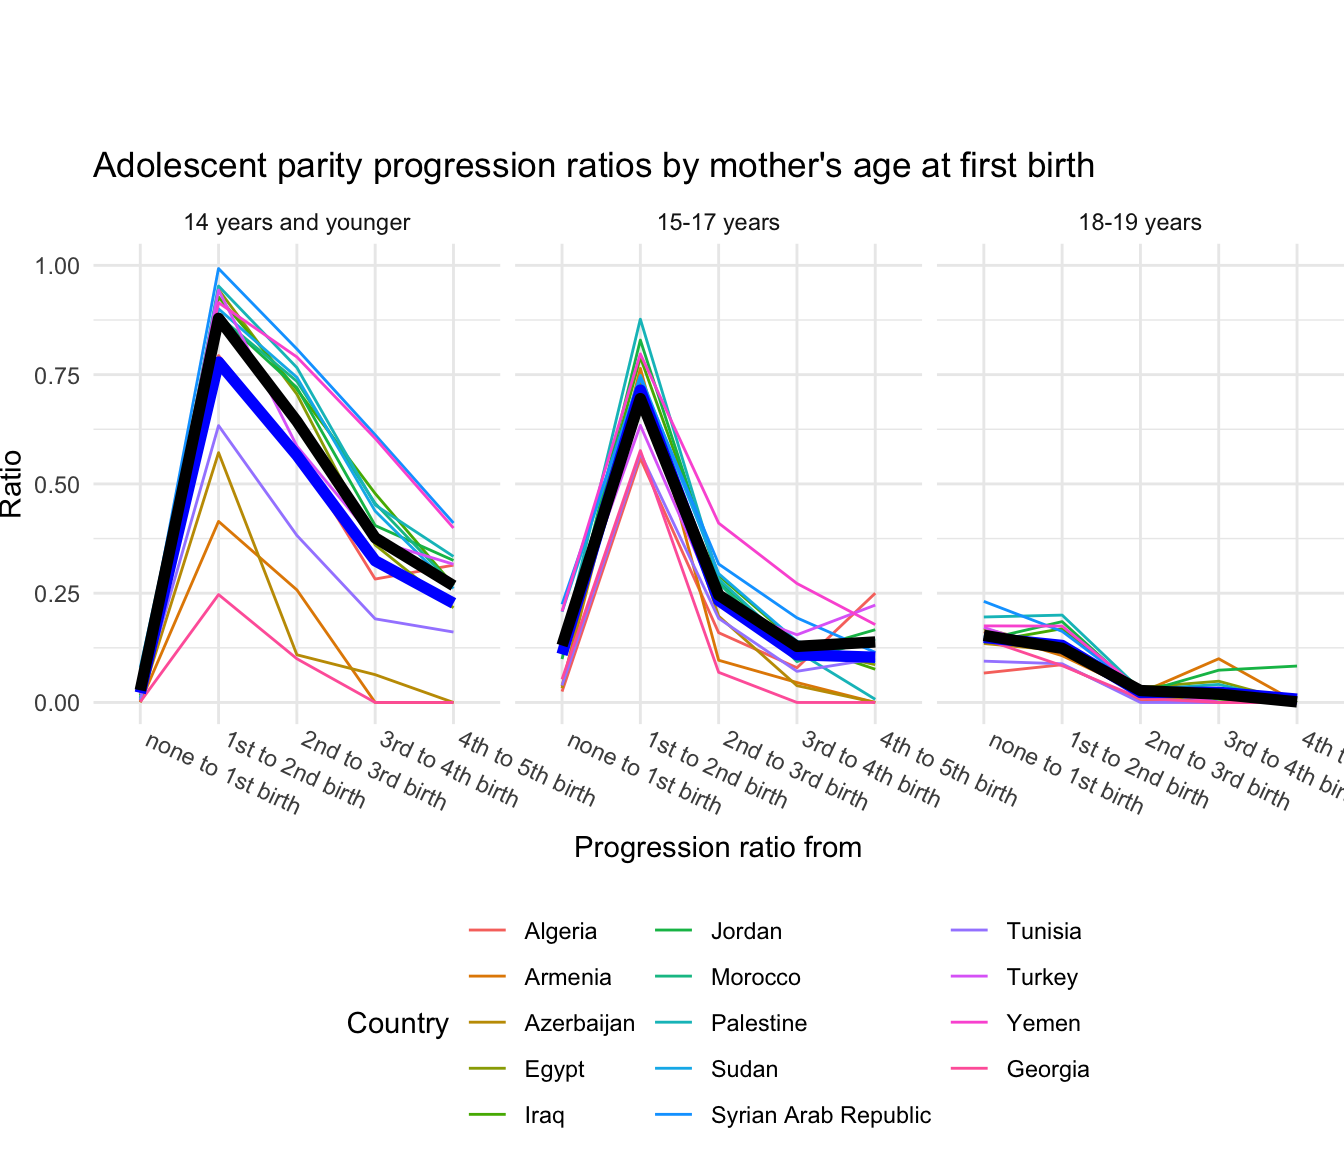
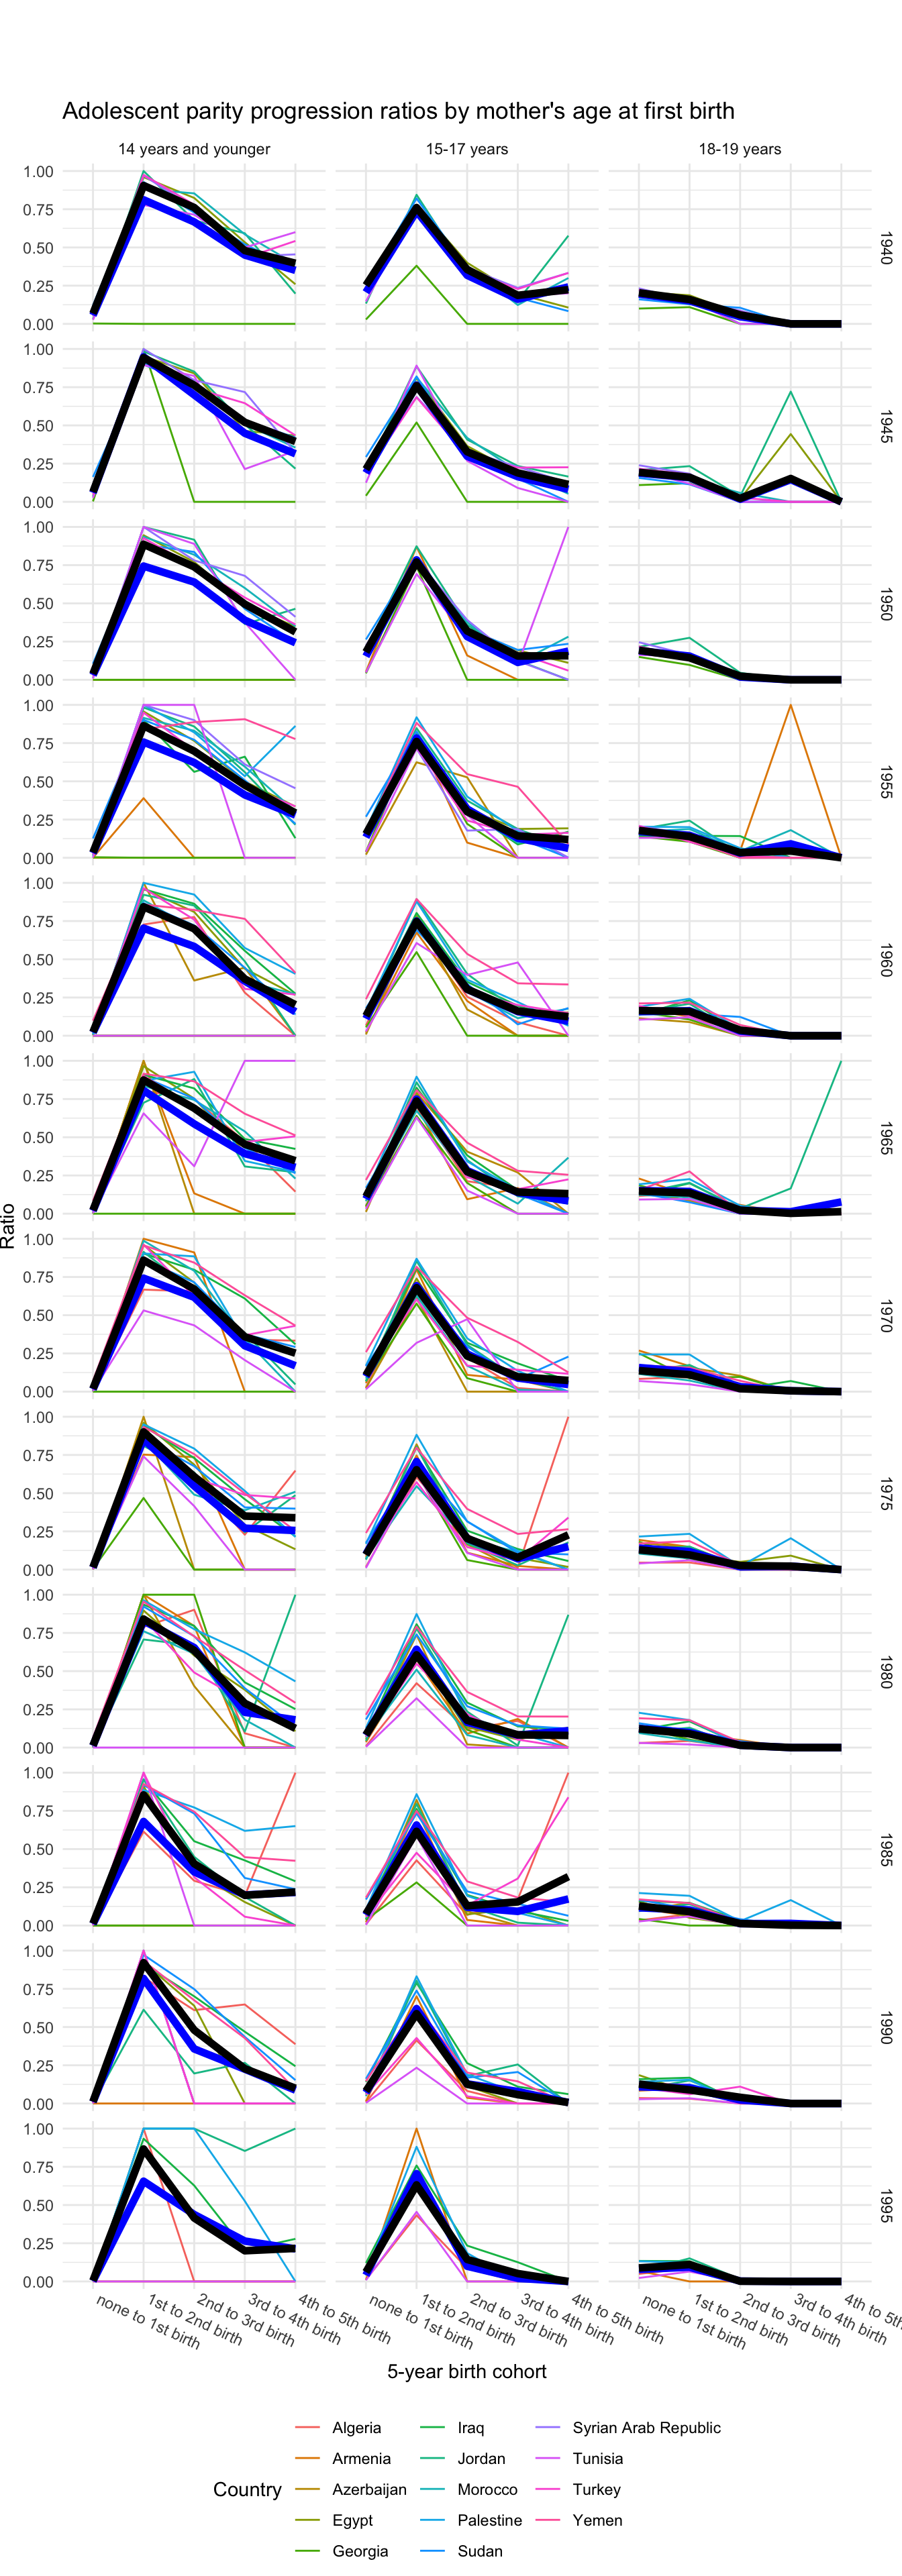
3.16.10 Adolescent parity progression ratios by age (all cohorts)
Do individual cohorts?
Region | Age at first birth | Progression ratio from | Unweighted average | Weighted average | |
---|---|---|---|---|---|
|
|
|
|
| |
1 | Northern Africa and Western Asia | 14 years and younger | none to 1st birth | 0.02 | 0.03 |
2 | Northern Africa and Western Asia | 15-17 years | none to 1st birth | 0.11 | 0.13 |
3 | Northern Africa and Western Asia | 18-19 years | none to 1st birth | 0.15 | 0.15 |
4 | Northern Africa and Western Asia | 14 years and younger | 1st to 2nd birth | 0.78 | 0.88 |
5 | Northern Africa and Western Asia | 15-17 years | 1st to 2nd birth | 0.71 | 0.70 |
6 | Northern Africa and Western Asia | 18-19 years | 1st to 2nd birth | 0.13 | 0.12 |
7 | Northern Africa and Western Asia | 14 years and younger | 2nd to 3rd birth | 0.57 | 0.64 |
8 | Northern Africa and Western Asia | 15-17 years | 2nd to 3rd birth | 0.23 | 0.25 |
9 | Northern Africa and Western Asia | 18-19 years | 2nd to 3rd birth | 0.02 | 0.03 |
10 | Northern Africa and Western Asia | 14 years and younger | 3rd to 4th birth | 0.32 | 0.38 |
Showing 1 to 10 of 15 entries
Region | Age at first birth | 5-yr birth cohort | Progression ratio from | Unweighted average | Weighted average | |
---|---|---|---|---|---|---|
|
|
|
|
|
| |
1 | Northern Africa and Western Asia | 14 years and younger | 1940 | none to 1st birth | 0.06 | 0.07 |
2 | Northern Africa and Western Asia | 15-17 years | 1940 | none to 1st birth | 0.21 | 0.25 |
3 | Northern Africa and Western Asia | 18-19 years | 1940 | none to 1st birth | 0.19 | 0.20 |
4 | Northern Africa and Western Asia | 14 years and younger | 1940 | 1st to 2nd birth | 0.81 | 0.90 |
5 | Northern Africa and Western Asia | 15-17 years | 1940 | 1st to 2nd birth | 0.74 | 0.76 |
6 | Northern Africa and Western Asia | 18-19 years | 1940 | 1st to 2nd birth | 0.15 | 0.16 |
7 | Northern Africa and Western Asia | 14 years and younger | 1940 | 2nd to 3rd birth | 0.67 | 0.76 |
8 | Northern Africa and Western Asia | 15-17 years | 1940 | 2nd to 3rd birth | 0.32 | 0.36 |
9 | Northern Africa and Western Asia | 18-19 years | 1940 | 2nd to 3rd birth | 0.05 | 0.06 |
10 | Northern Africa and Western Asia | 14 years and younger | 1940 | 3rd to 4th birth | 0.45 | 0.48 |
Showing 1 to 10 of 180 entries
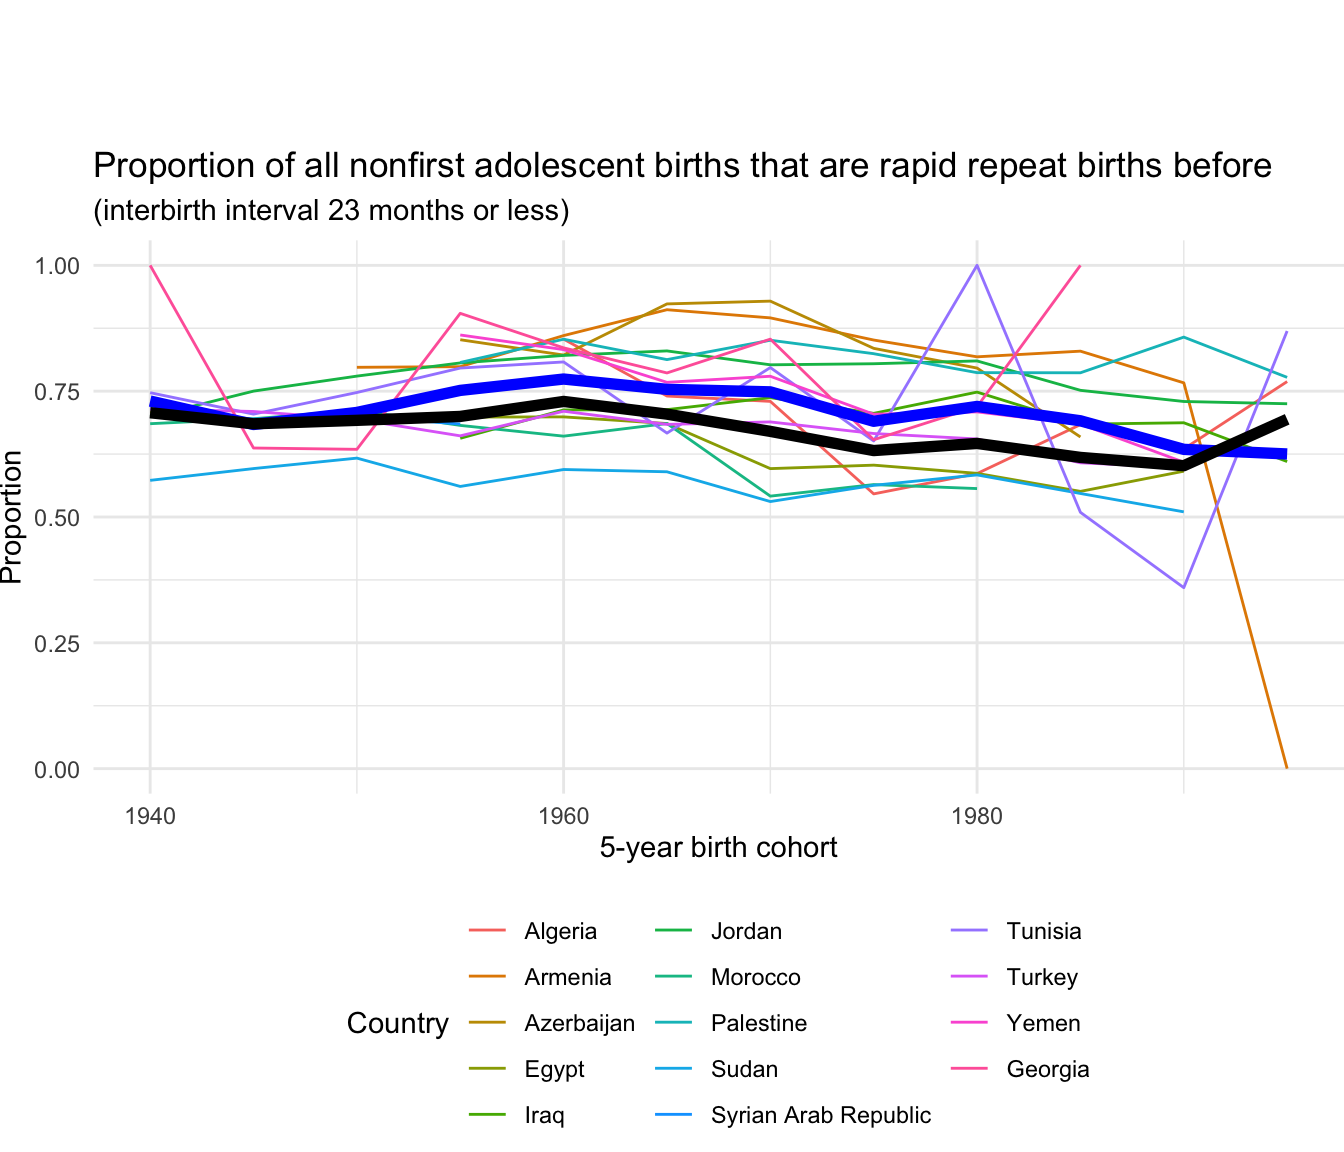
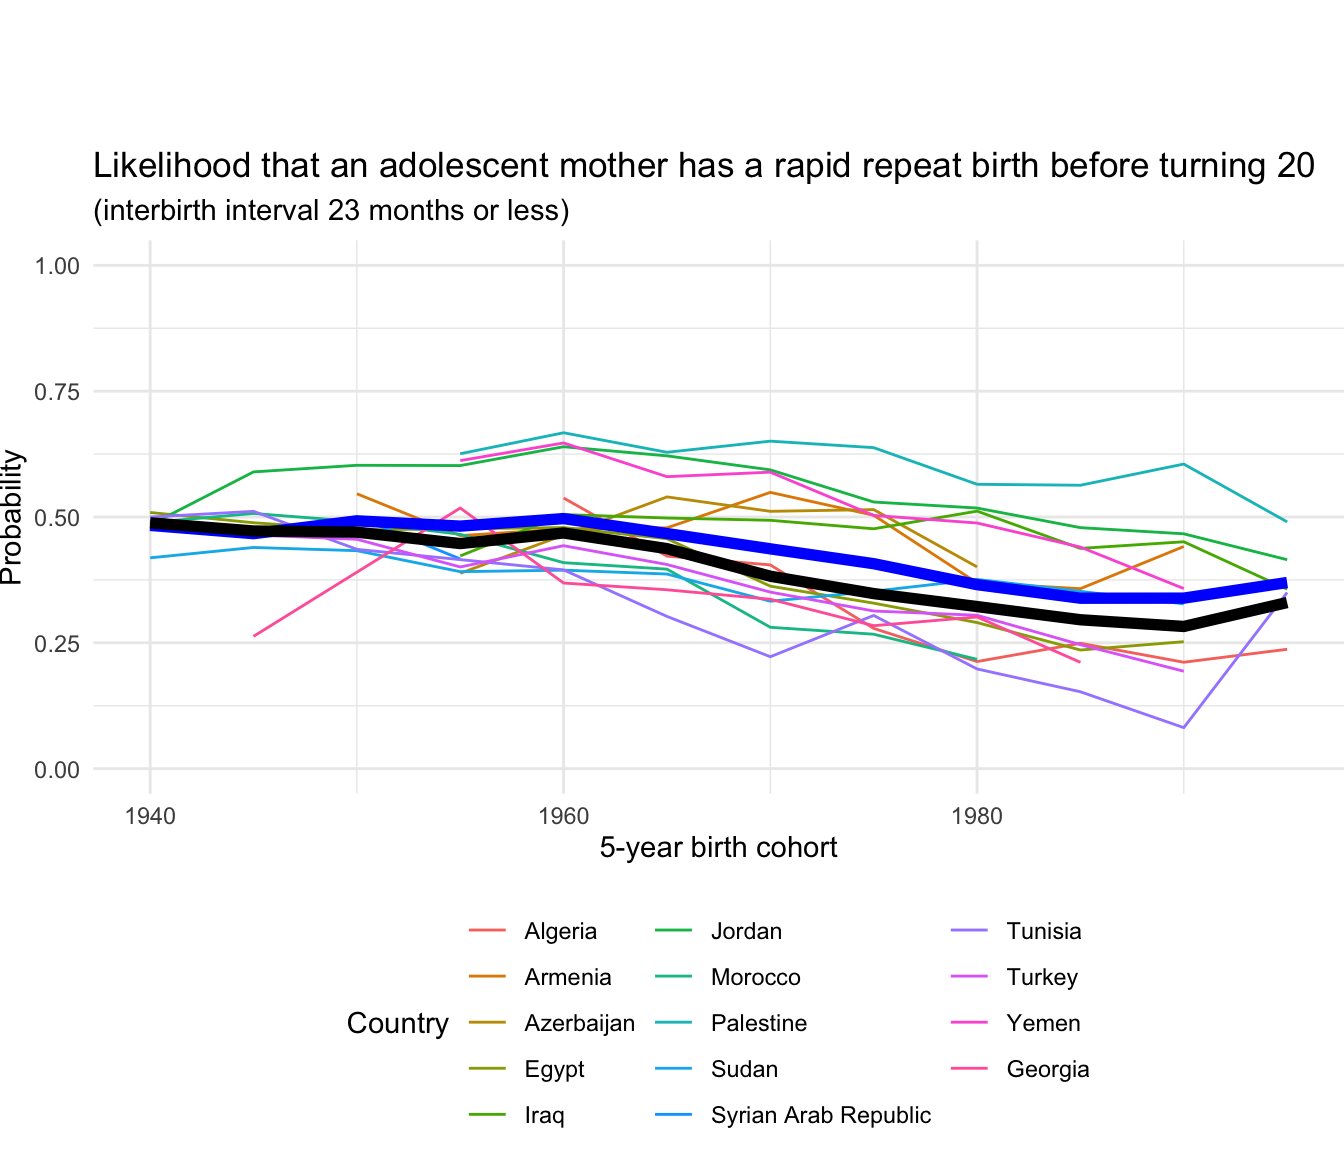
3.16.11 Rapid Repeat Birth probability
Region | 5-year birth cohort | Unweighted average | Weighted average | |
---|---|---|---|---|
|
|
|
| |
1 | Northern Africa and Western Asia | 1940 | 0.48 | 0.49 |
2 | Northern Africa and Western Asia | 1945 | 0.47 | 0.47 |
3 | Northern Africa and Western Asia | 1950 | 0.49 | 0.47 |
4 | Northern Africa and Western Asia | 1955 | 0.48 | 0.45 |
5 | Northern Africa and Western Asia | 1960 | 0.50 | 0.47 |
6 | Northern Africa and Western Asia | 1965 | 0.47 | 0.44 |
7 | Northern Africa and Western Asia | 1970 | 0.44 | 0.38 |
8 | Northern Africa and Western Asia | 1975 | 0.41 | 0.35 |
9 | Northern Africa and Western Asia | 1980 | 0.37 | 0.32 |
10 | Northern Africa and Western Asia | 1985 | 0.34 | 0.30 |
Showing 1 to 10 of 12 entries
3.16.12 Rapid Repeat Birth proportion
Region | 5-year birth cohort | Unweighted average | Weighted average | |
---|---|---|---|---|
|
|
|
| |
1 | Northern Africa and Western Asia | 1940 | 0.73 | 0.71 |
2 | Northern Africa and Western Asia | 1945 | 0.68 | 0.69 |
3 | Northern Africa and Western Asia | 1950 | 0.71 | 0.69 |
4 | Northern Africa and Western Asia | 1955 | 0.75 | 0.70 |
5 | Northern Africa and Western Asia | 1960 | 0.77 | 0.73 |
6 | Northern Africa and Western Asia | 1965 | 0.75 | 0.70 |
7 | Northern Africa and Western Asia | 1970 | 0.75 | 0.67 |
8 | Northern Africa and Western Asia | 1975 | 0.69 | 0.63 |
9 | Northern Africa and Western Asia | 1980 | 0.72 | 0.65 |
10 | Northern Africa and Western Asia | 1985 | 0.69 | 0.62 |
Showing 1 to 10 of 12 entries