5.3 Indonesia
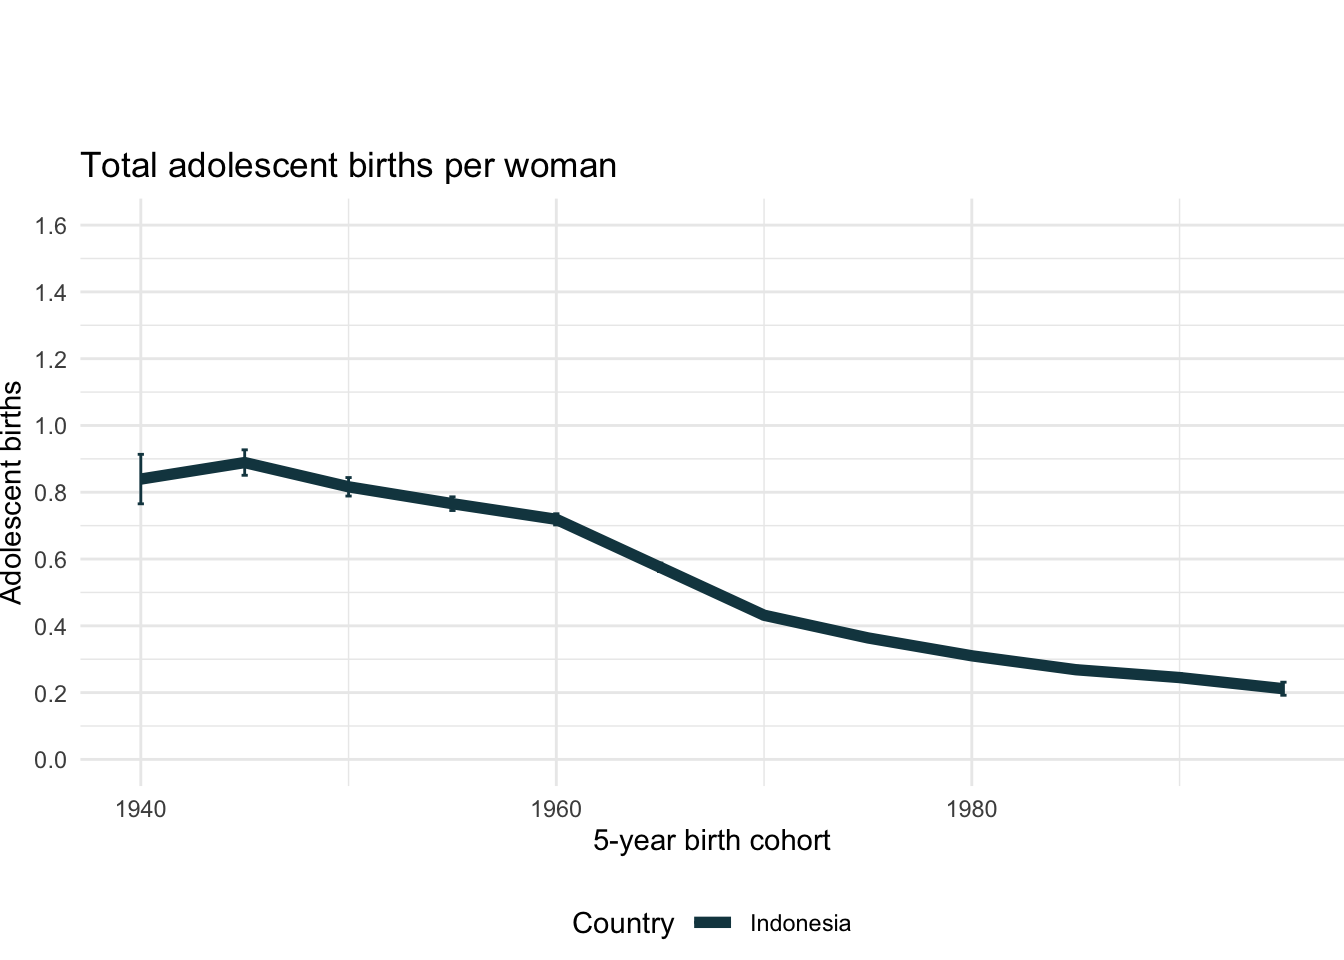
5.3.1 Total adolescent births
Country | 5-year birth cohort | Unweighted cases | Total adolescent births | |
---|---|---|---|---|
|
|
|
| |
1 | Indonesia | 1940 | 1,679 | 0.84 |
2 | Indonesia | 1945 | 7,262 | 0.89 |
3 | Indonesia | 1950 | 12,774 | 0.82 |
4 | Indonesia | 1955 | 20,195 | 0.77 |
5 | Indonesia | 1960 | 29,615 | 0.72 |
6 | Indonesia | 1965 | 37,960 | 0.58 |
7 | Indonesia | 1970 | 39,363 | 0.43 |
8 | Indonesia | 1975 | 30,569 | 0.36 |
9 | Indonesia | 1980 | 25,862 | 0.31 |
10 | Indonesia | 1985 | 16,695 | 0.27 |
Showing 1 to 10 of 12 entries
5.3.2 Total adolescent births by age at first birth
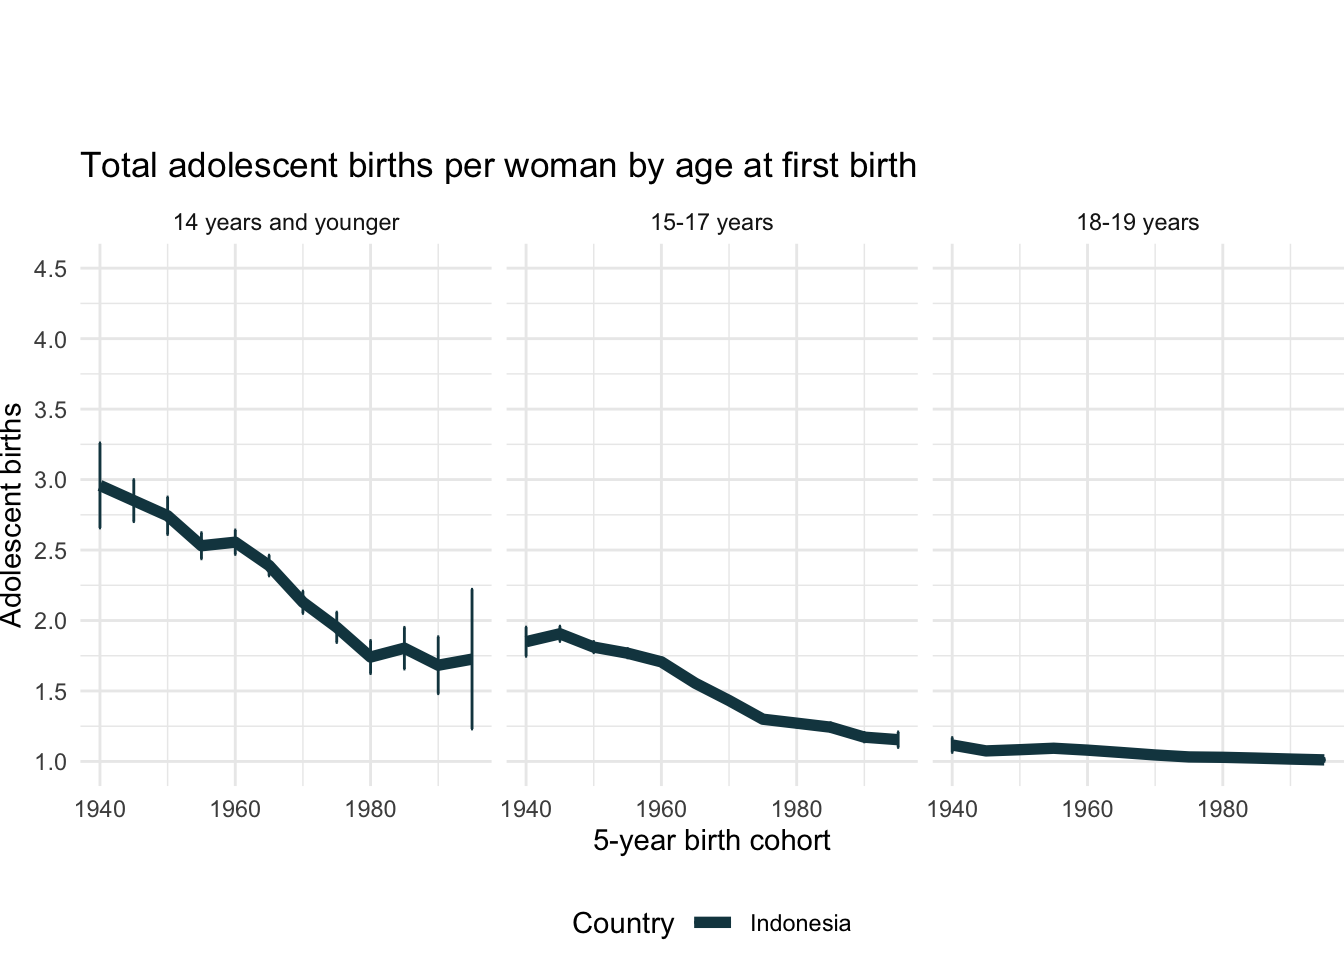
Country | 5-year birth cohort | Age at first birth | Unweighted cases | Total adolescent births | |
---|---|---|---|---|---|
|
|
|
|
| |
1 | Indonesia | 1940 | 14 years and younger | 110 | 2.96 |
2 | Indonesia | 1940 | 15-17 years | 348 | 1.85 |
3 | Indonesia | 1940 | 18-19 years | 268 | 1.12 |
4 | Indonesia | 1945 | 14 years and younger | 528 | 2.85 |
5 | Indonesia | 1945 | 15-17 years | 1,522 | 1.91 |
6 | Indonesia | 1945 | 18-19 years | 1,243 | 1.07 |
7 | Indonesia | 1950 | 14 years and younger | 703 | 2.74 |
8 | Indonesia | 1950 | 15-17 years | 2,529 | 1.81 |
9 | Indonesia | 1950 | 18-19 years | 2,438 | 1.08 |
10 | Indonesia | 1955 | 14 years and younger | 1,051 | 2.53 |
Showing 1 to 10 of 36 entries
5.3.3 Contribution to total adolescent fertility by cohort and age at first birth
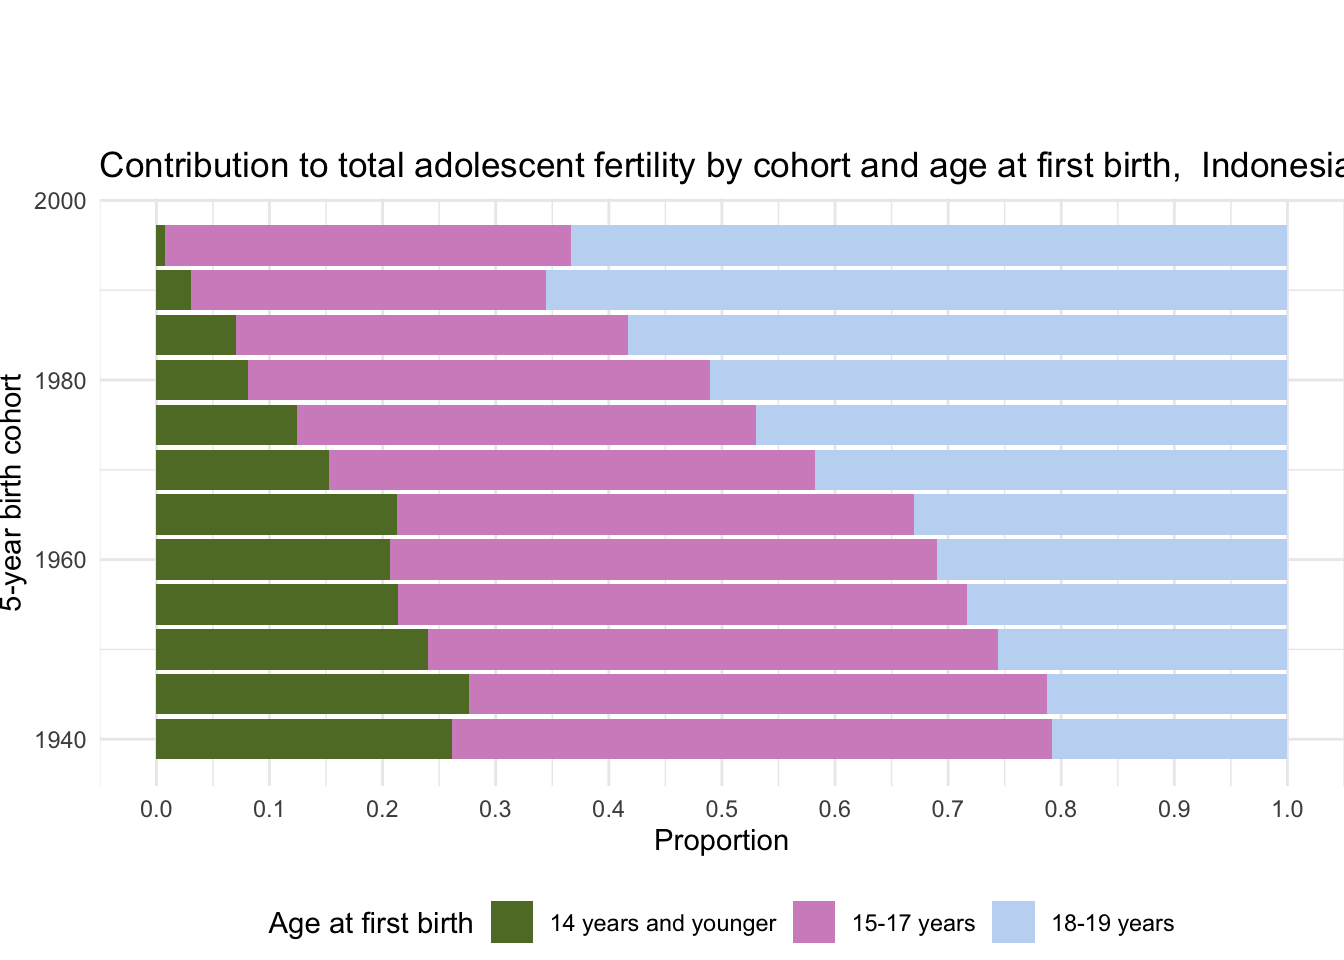
Country | 5-year birth cohort | Age at first birth | Unweighted cases | Proportion | |
---|---|---|---|---|---|
|
|
|
|
| |
1 | Indonesia | 1940 | 14 years and younger | 110 | 0.26 |
2 | Indonesia | 1940 | 15-17 years | 348 | 0.53 |
3 | Indonesia | 1940 | 18-19 years | 268 | 0.21 |
4 | Indonesia | 1945 | 14 years and younger | 528 | 0.28 |
5 | Indonesia | 1945 | 15-17 years | 1,522 | 0.51 |
6 | Indonesia | 1945 | 18-19 years | 1,243 | 0.21 |
7 | Indonesia | 1950 | 14 years and younger | 703 | 0.24 |
8 | Indonesia | 1950 | 15-17 years | 2,529 | 0.50 |
9 | Indonesia | 1950 | 18-19 years | 2,438 | 0.26 |
10 | Indonesia | 1955 | 14 years and younger | 1,051 | 0.21 |
Showing 1 to 10 of 36 entries
5.3.4 Contribution to total adolescent fertility by age at first birth (all cohorts)
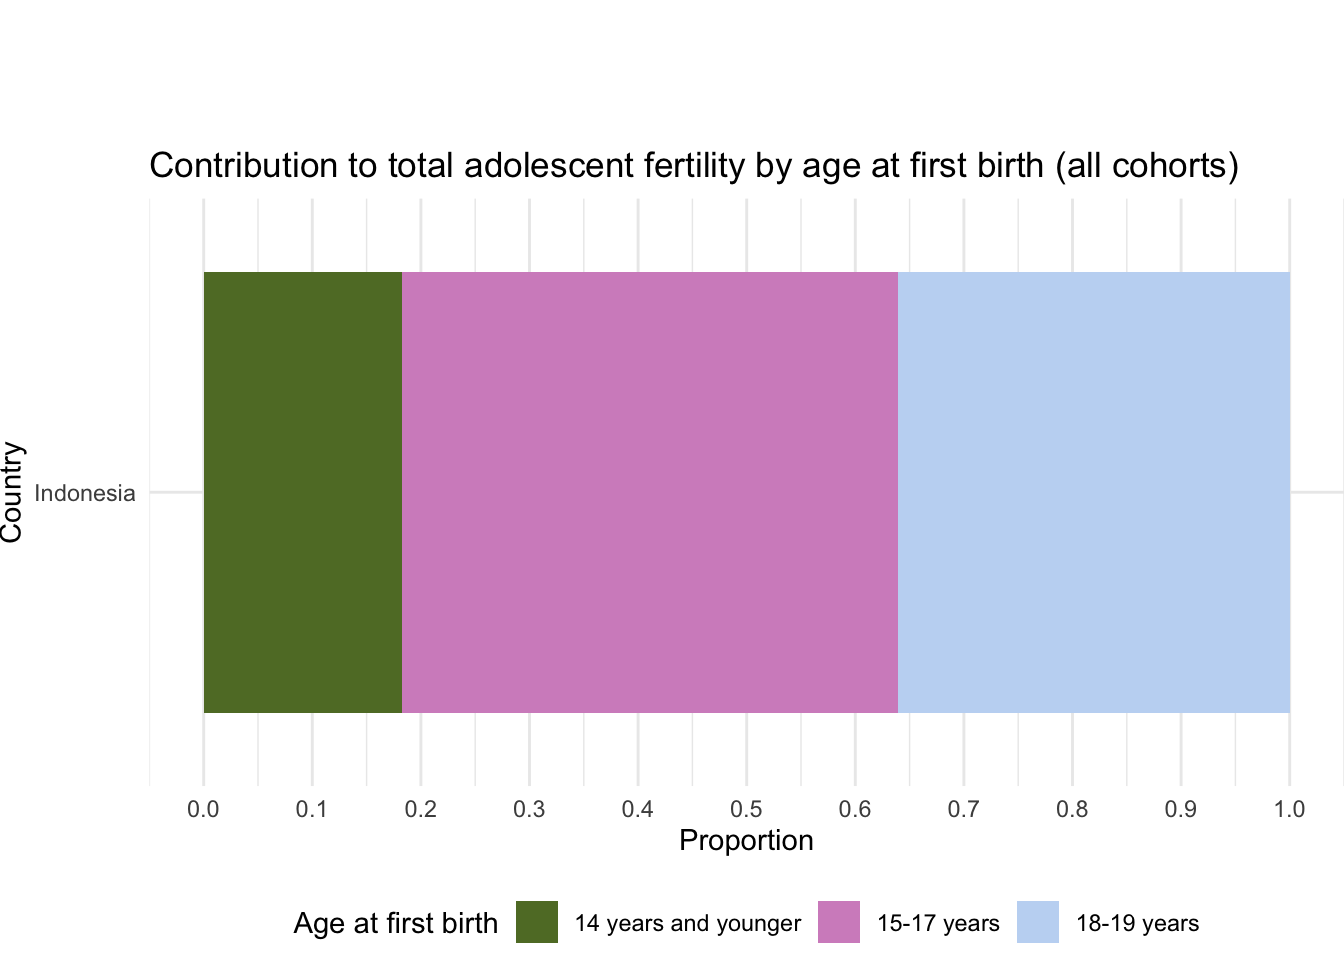
Country | Age at first birth | Unweighted cases | Proportion | |
---|---|---|---|---|
|
|
|
| |
1 | Indonesia | 14 years and younger | 7,708 | 0.18 |
2 | Indonesia | 15-17 years | 32,551 | 0.46 |
3 | Indonesia | 18-19 years | 38,763 | 0.36 |
Showing 1 to 3 of 3 entries
5.3.5 Completed fertility by motherhood entry age
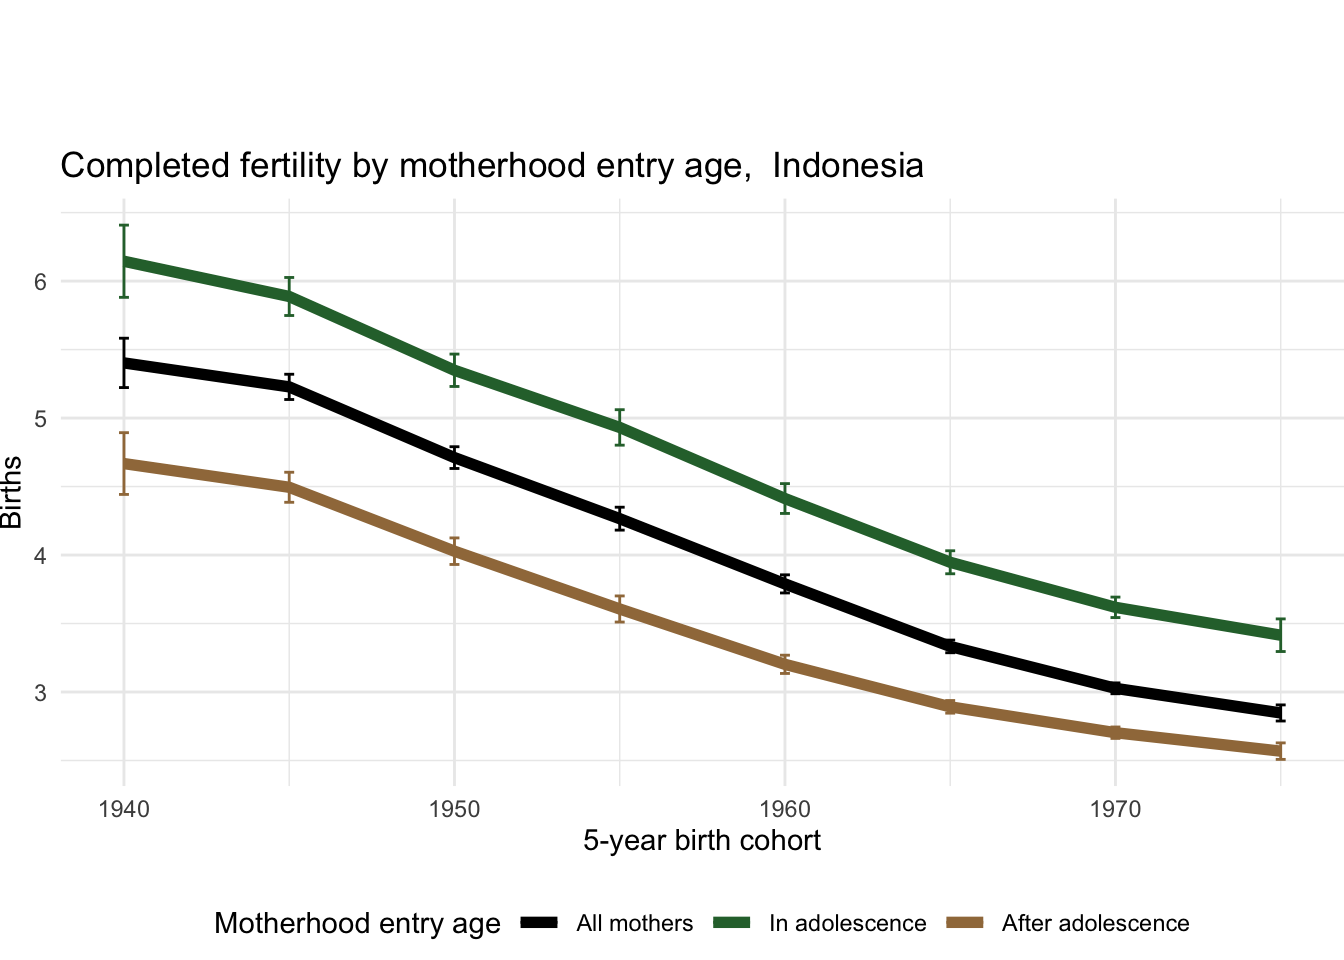
Country | 5-year birth cohort | Age at first birth | Unweighted cases | Number of children | |
---|---|---|---|---|---|
|
|
|
|
| |
1 | Indonesia | 1940 | All mothers | 1,597 | 5.40 |
2 | Indonesia | 1940 | In adolescence | 726 | 6.14 |
3 | Indonesia | 1940 | After adolescence | 871 | 4.67 |
4 | Indonesia | 1945 | All mothers | 6,877 | 5.23 |
5 | Indonesia | 1945 | In adolescence | 3,293 | 5.89 |
6 | Indonesia | 1945 | After adolescence | 3,584 | 4.49 |
7 | Indonesia | 1950 | All mothers | 8,210 | 4.71 |
8 | Indonesia | 1950 | In adolescence | 3,856 | 5.35 |
9 | Indonesia | 1950 | After adolescence | 4,354 | 4.03 |
10 | Indonesia | 1955 | All mothers | 7,054 | 4.27 |
Showing 1 to 10 of 24 entries
5.3.6 Difference in completed fertility between adolescent and non-adolescent mothers
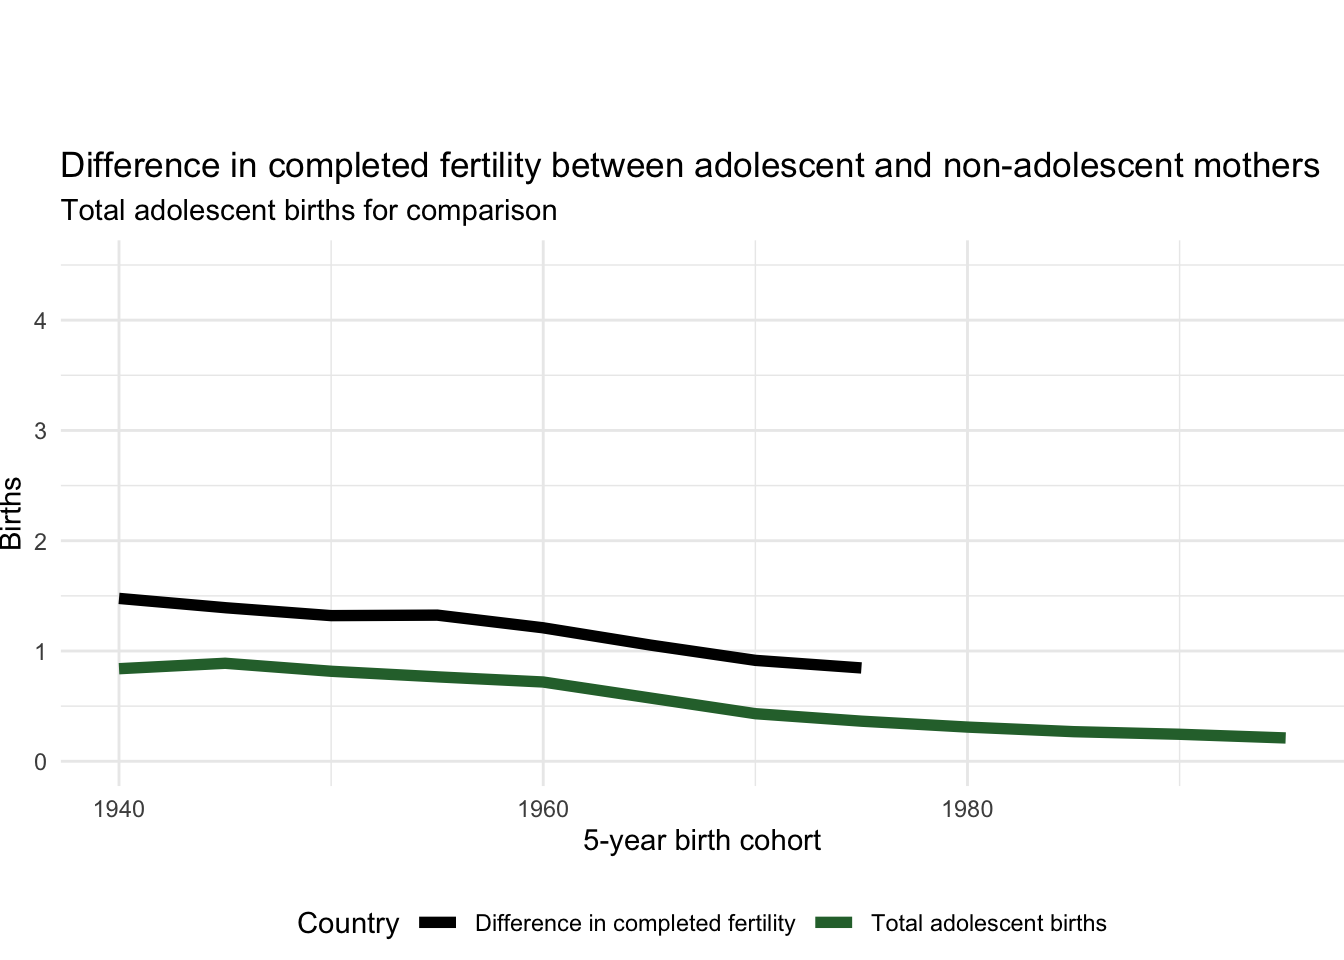
Country | 5-year birth cohort | Difference in number of births | |
---|---|---|---|
|
|
| |
1 | Indonesia | 1940 | 1.48 |
2 | Indonesia | 1945 | 1.39 |
3 | Indonesia | 1950 | 1.32 |
4 | Indonesia | 1955 | 1.33 |
5 | Indonesia | 1960 | 1.21 |
6 | Indonesia | 1965 | 1.06 |
7 | Indonesia | 1970 | 0.92 |
8 | Indonesia | 1975 | 0.85 |
Showing 1 to 8 of 8 entries
5.3.7 Contribution of adolescent fertility to total fertility by cohort
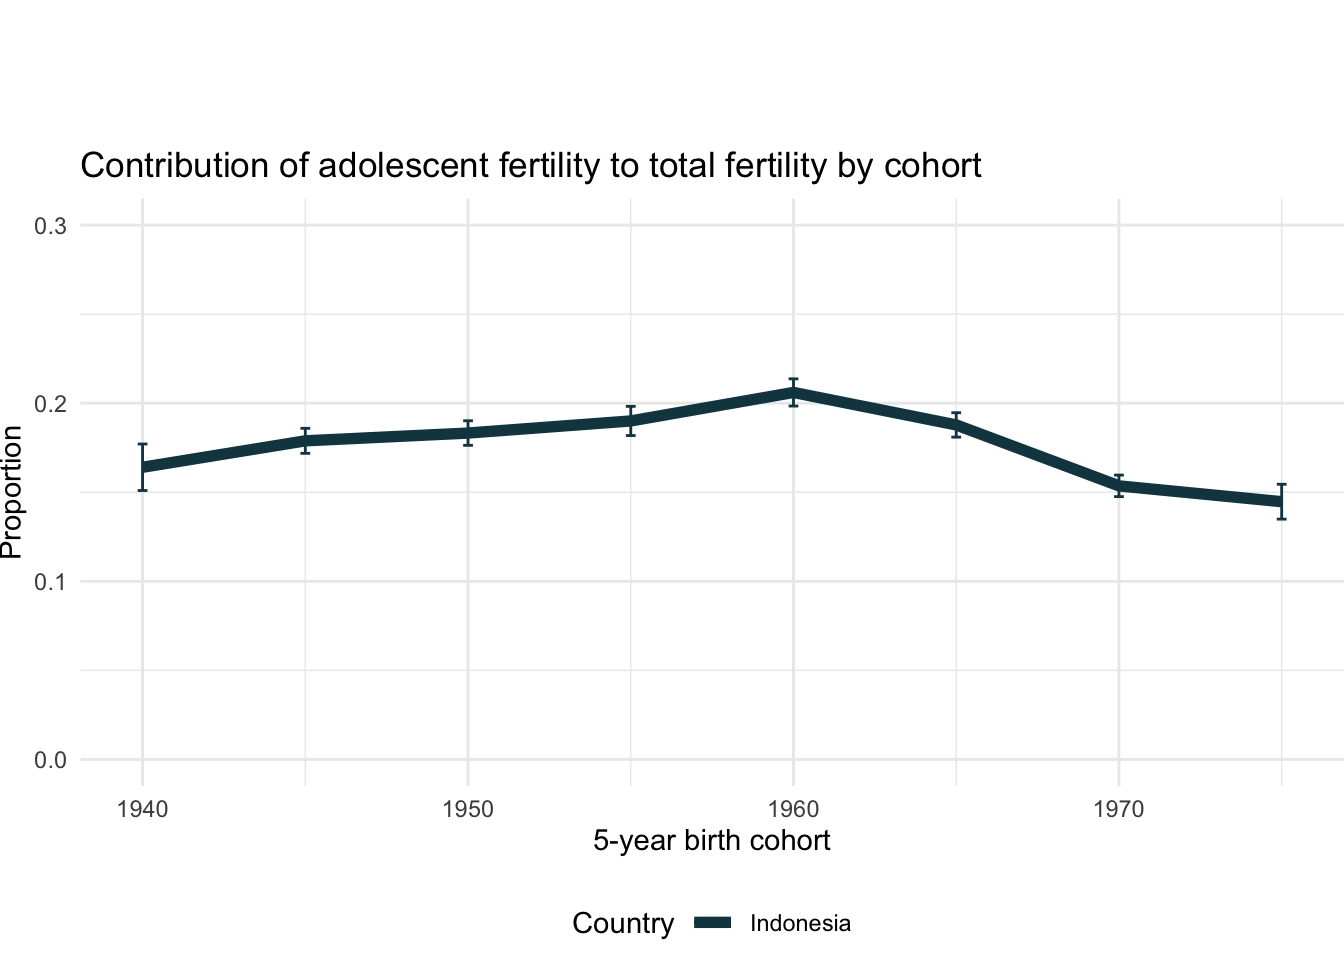
Country | 5-year birth cohort | Unweighted cases | Proportion | |
---|---|---|---|---|
|
|
|
| |
1 | Indonesia | 1940 | 1,597 | 0.16 |
2 | Indonesia | 1945 | 6,877 | 0.18 |
3 | Indonesia | 1950 | 8,210 | 0.18 |
4 | Indonesia | 1955 | 7,054 | 0.19 |
5 | Indonesia | 1960 | 8,977 | 0.21 |
6 | Indonesia | 1965 | 9,759 | 0.19 |
7 | Indonesia | 1970 | 8,350 | 0.15 |
8 | Indonesia | 1975 | 2,775 | 0.14 |
Showing 1 to 8 of 8 entries
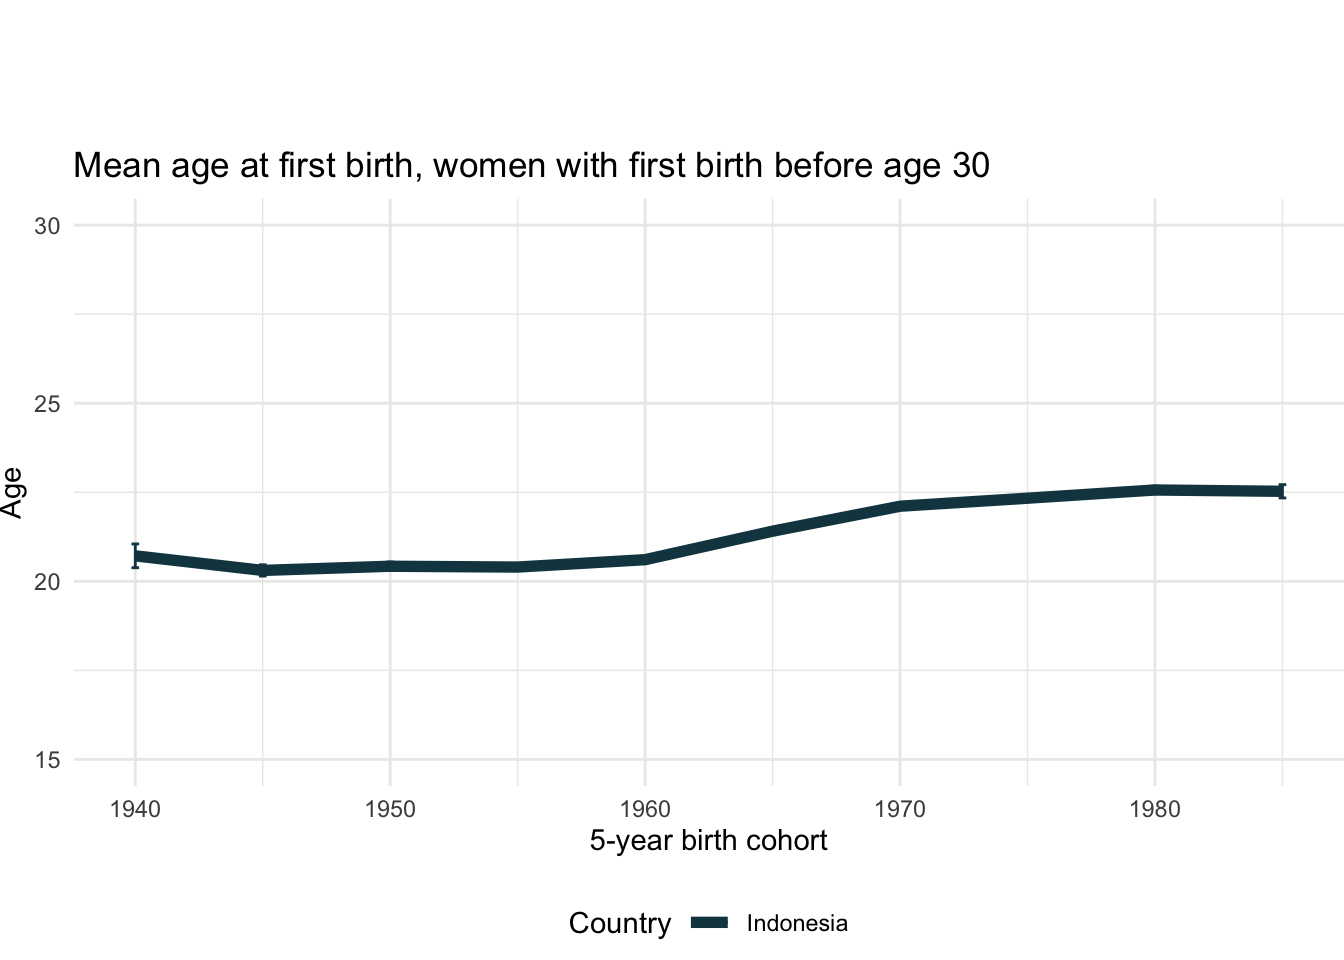
5.3.8 Mean age at first birth
Country | 5-year birth cohort | Unweighted cases | Mean age | |
---|---|---|---|---|
|
|
|
| |
1 | Indonesia | 1940 | 1,597 | 20.71 |
2 | Indonesia | 1945 | 6,877 | 20.31 |
3 | Indonesia | 1950 | 12,034 | 20.42 |
4 | Indonesia | 1955 | 18,889 | 20.40 |
5 | Indonesia | 1960 | 21,692 | 20.61 |
6 | Indonesia | 1965 | 19,952 | 21.41 |
7 | Indonesia | 1970 | 20,720 | 22.11 |
8 | Indonesia | 1975 | 15,462 | 22.33 |
9 | Indonesia | 1980 | 9,597 | 22.56 |
10 | Indonesia | 1985 | 2,533 | 22.53 |
Showing 1 to 10 of 10 entries
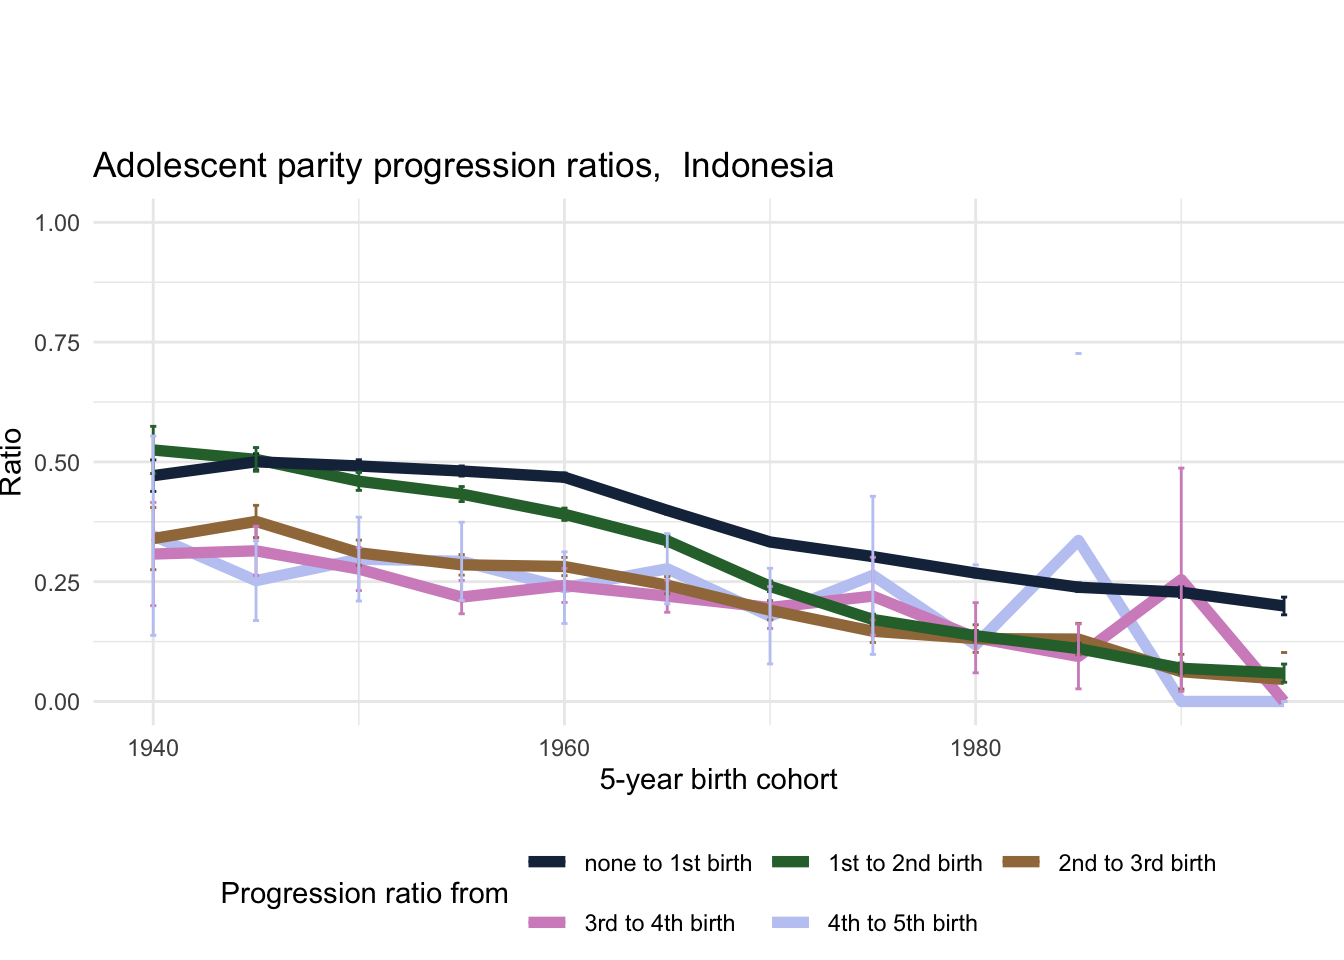
5.3.9 Adolescent parity progression ratios
Country | 5-year birth cohort | Progression ratio from | Unweighted cases | Ratio | |
---|---|---|---|---|---|
|
|
|
|
| |
1 | Indonesia | 1940 | none to 1st birth | 726 | 0.47 |
2 | Indonesia | 1940 | 1st to 2nd birth | 369 | 0.52 |
3 | Indonesia | 1940 | 2nd to 3rd birth | 129 | 0.34 |
4 | Indonesia | 1940 | 3rd to 4th birth | 40 | 0.31 |
5 | Indonesia | 1940 | 4th to 5th birth | 11 | 0.35 |
6 | Indonesia | 1945 | none to 1st birth | 3,293 | 0.50 |
7 | Indonesia | 1945 | 1st to 2nd birth | 1,656 | 0.51 |
8 | Indonesia | 1945 | 2nd to 3rd birth | 642 | 0.38 |
9 | Indonesia | 1945 | 3rd to 4th birth | 202 | 0.31 |
10 | Indonesia | 1945 | 4th to 5th birth | 53 | 0.25 |
Showing 1 to 10 of 60 entries
5.3.10 Adolescent parity progression ratios by age
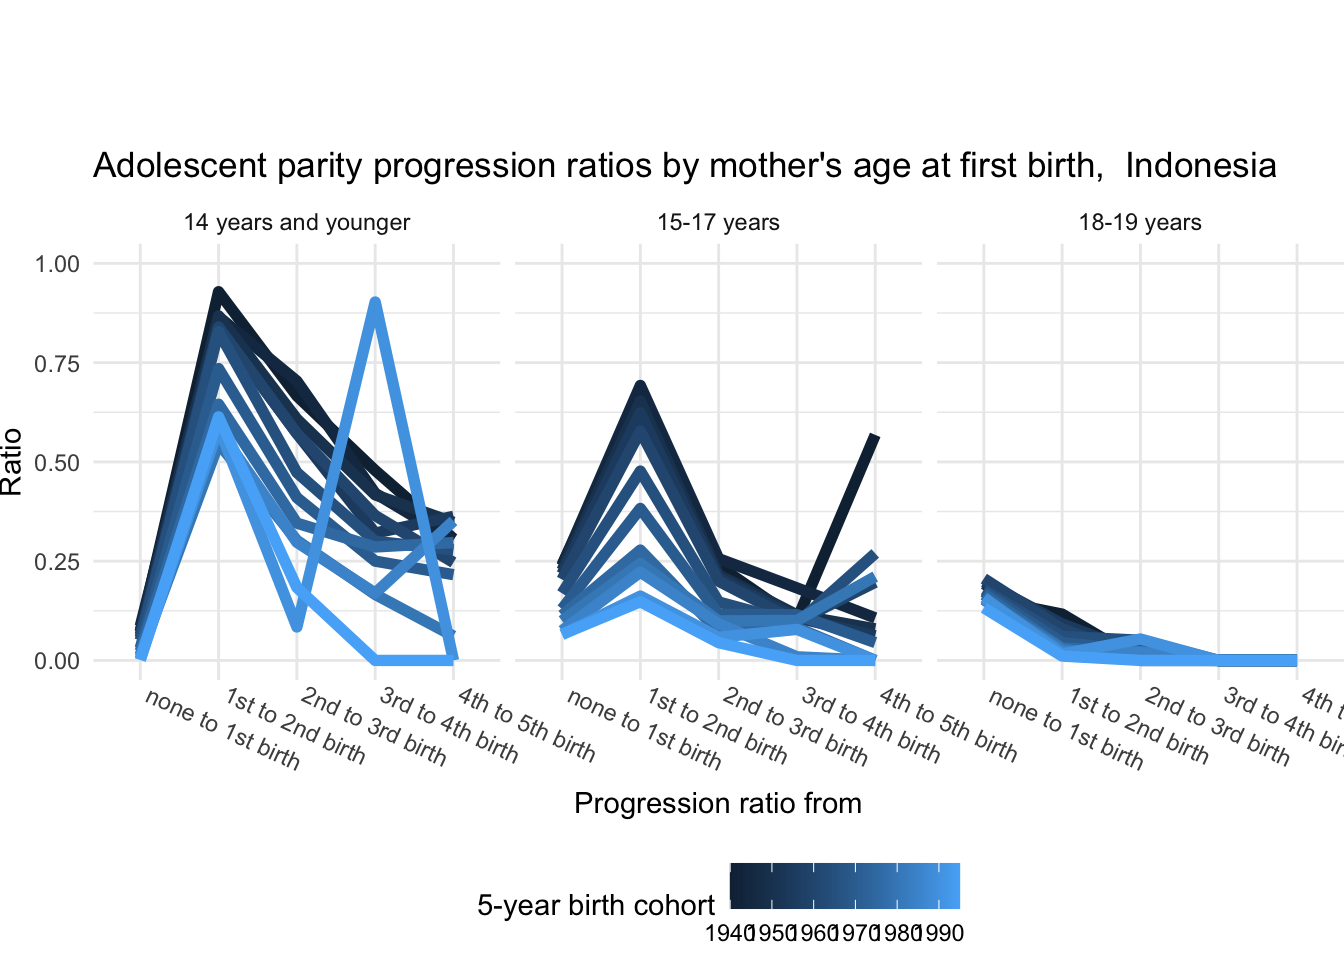
Country | 5-year birth cohort | Age at first birth | Progression ratio from | Unweighted cases | Ratio | |
---|---|---|---|---|---|---|
|
|
|
|
|
| |
1 | Indonesia | 1940 | 14 years and younger | none to 1st birth | 110 | 0.07 |
2 | Indonesia | 1940 | 15-17 years | none to 1st birth | 348 | 0.24 |
3 | Indonesia | 1940 | 18-19 years | none to 1st birth | 268 | 0.16 |
4 | Indonesia | 1940 | 14 years and younger | 1st to 2nd birth | 101 | 0.93 |
5 | Indonesia | 1940 | 15-17 years | 1st to 2nd birth | 236 | 0.67 |
6 | Indonesia | 1940 | 18-19 years | 1st to 2nd birth | 32 | 0.12 |
7 | Indonesia | 1940 | 14 years and younger | 2nd to 3rd birth | 69 | 0.67 |
8 | Indonesia | 1940 | 15-17 years | 2nd to 3rd birth | 60 | 0.24 |
9 | Indonesia | 1940 | 18-19 years | 2nd to 3rd birth | 0 | 0.00 |
10 | Indonesia | 1940 | 14 years and younger | 3rd to 4th birth | 32 | 0.48 |
Showing 1 to 10 of 180 entries
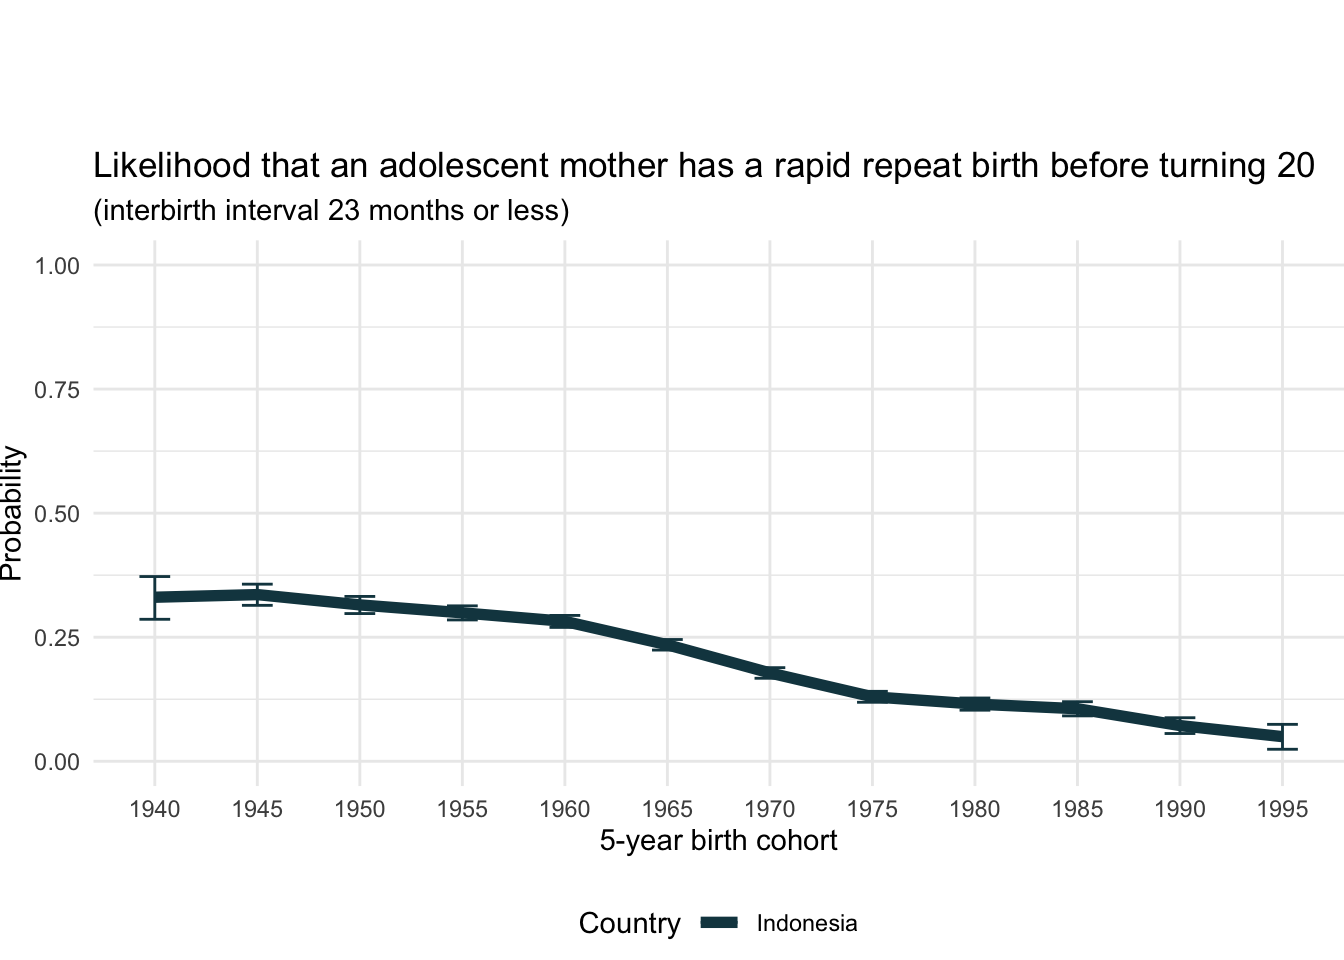
5.3.11 Rapid Repeat Birth probability
Country | 5-year birth cohort | Likelihood | |
---|---|---|---|
|
|
| |
1 | Indonesia | 1940 | 0.33 |
2 | Indonesia | 1945 | 0.34 |
3 | Indonesia | 1950 | 0.32 |
4 | Indonesia | 1955 | 0.30 |
5 | Indonesia | 1960 | 0.28 |
6 | Indonesia | 1965 | 0.23 |
7 | Indonesia | 1970 | 0.18 |
8 | Indonesia | 1975 | 0.13 |
9 | Indonesia | 1980 | 0.12 |
10 | Indonesia | 1985 | 0.11 |
Showing 1 to 10 of 12 entries
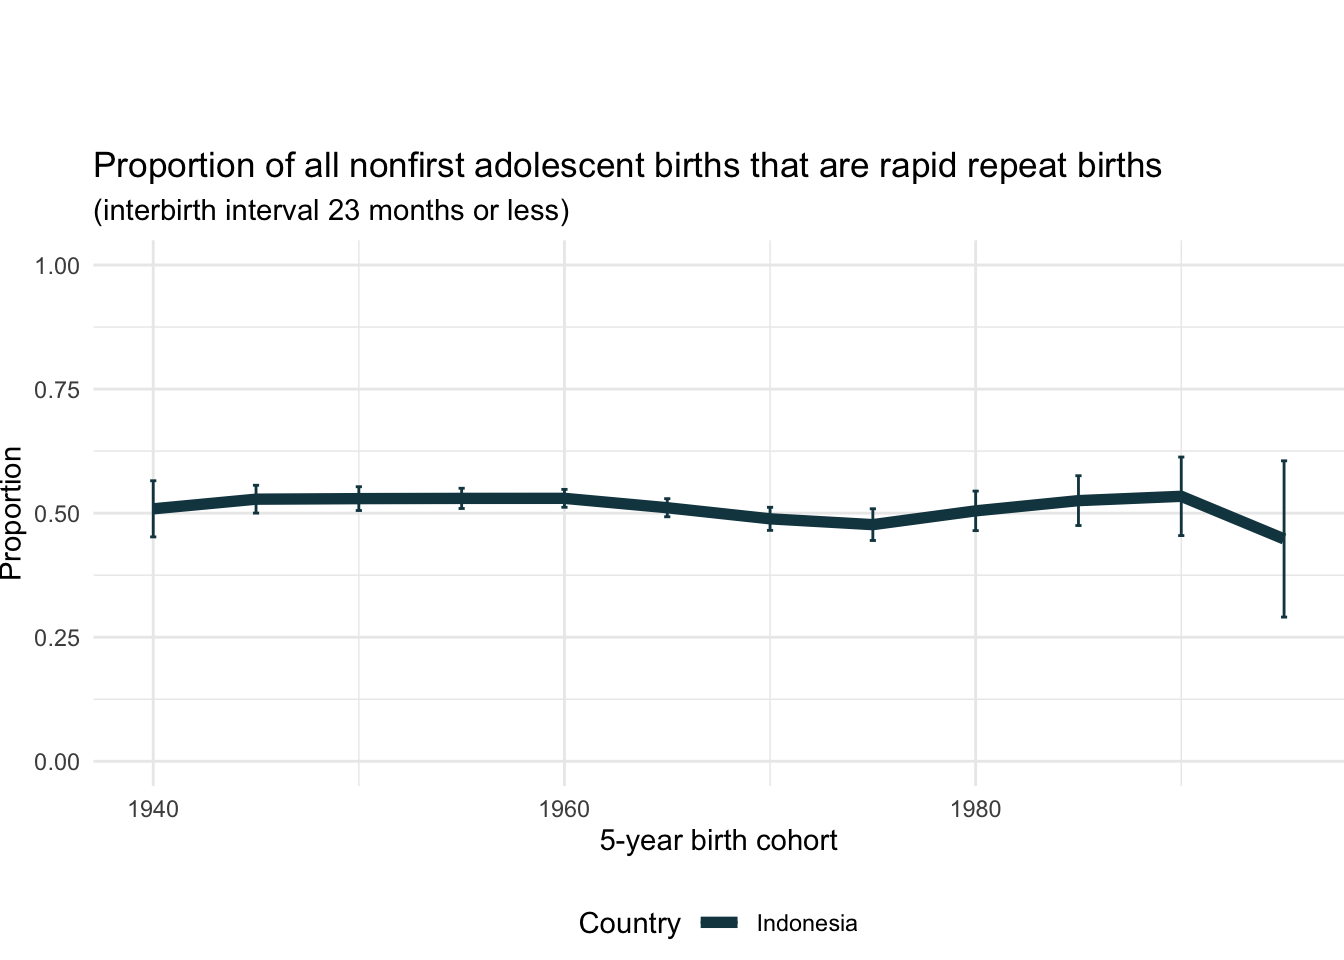
5.3.12 Rapid Repeat Birth proportion
Country | 5-year birth cohort | Unweighted cases (non-first adolescent births) | Proportion | |
---|---|---|---|---|
|
|
|
| |
1 | Indonesia | 1940 | 550 | 0.51 |
2 | Indonesia | 1945 | 2,574 | 0.53 |
3 | Indonesia | 1950 | 3,693 | 0.53 |
4 | Indonesia | 1955 | 5,305 | 0.53 |
5 | Indonesia | 1960 | 6,816 | 0.53 |
6 | Indonesia | 1965 | 6,583 | 0.51 |
7 | Indonesia | 1970 | 4,171 | 0.49 |
8 | Indonesia | 1975 | 2,250 | 0.48 |
9 | Indonesia | 1980 | 1,455 | 0.50 |
10 | Indonesia | 1985 | 760 | 0.53 |
Showing 1 to 10 of 12 entries