Global Summary
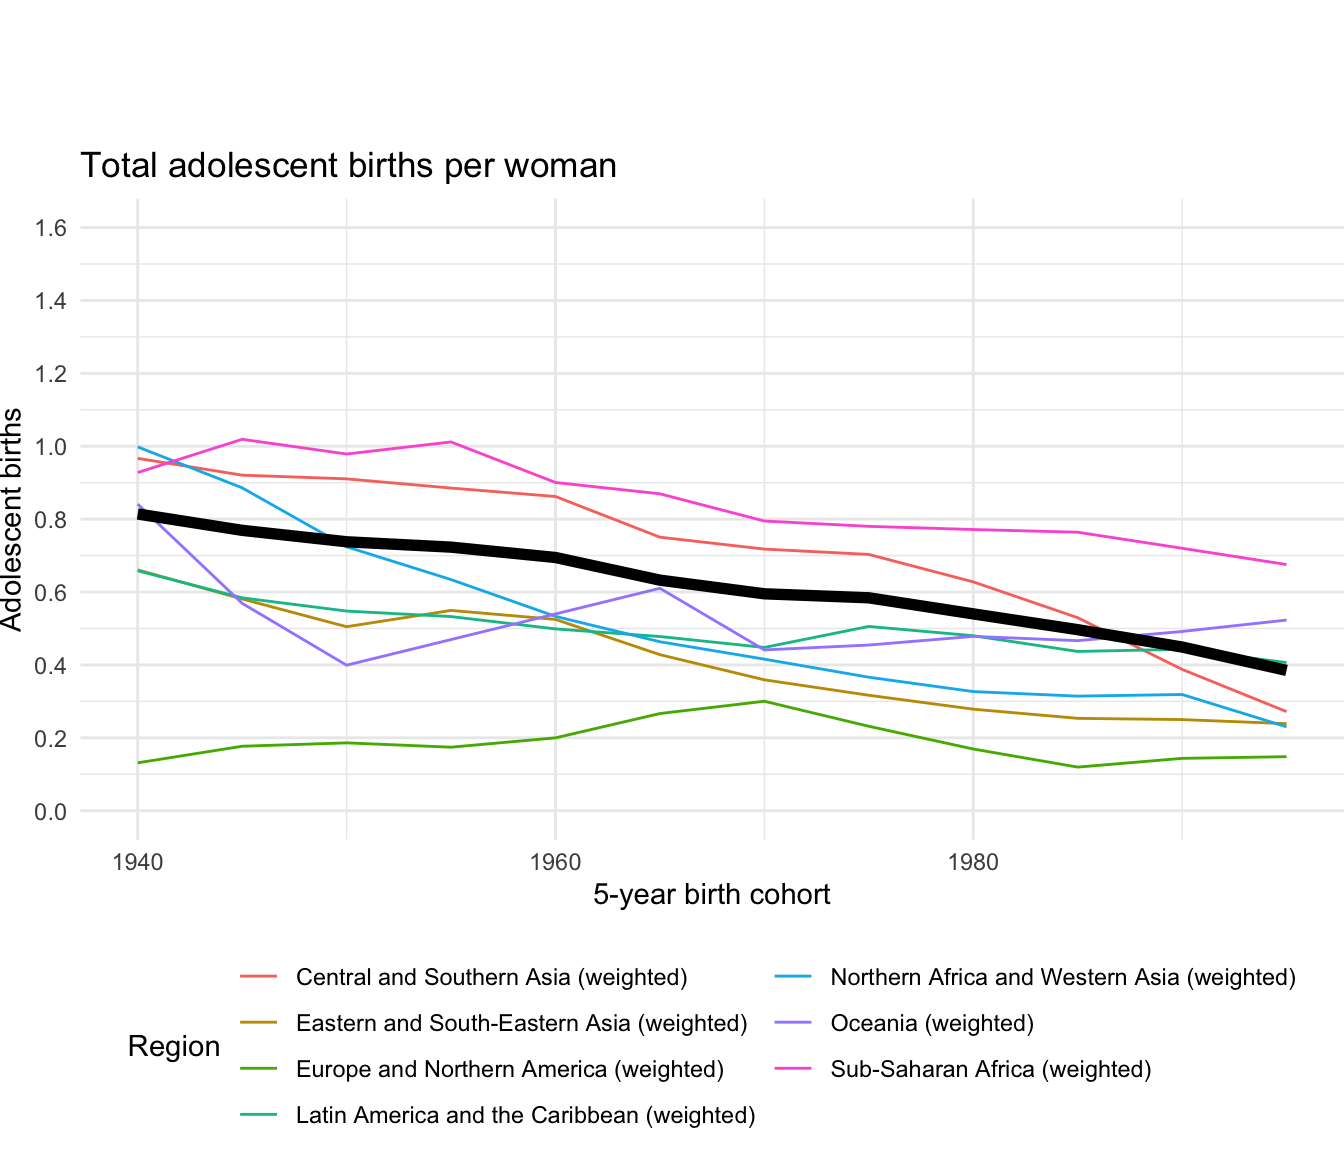
Total adolescent births
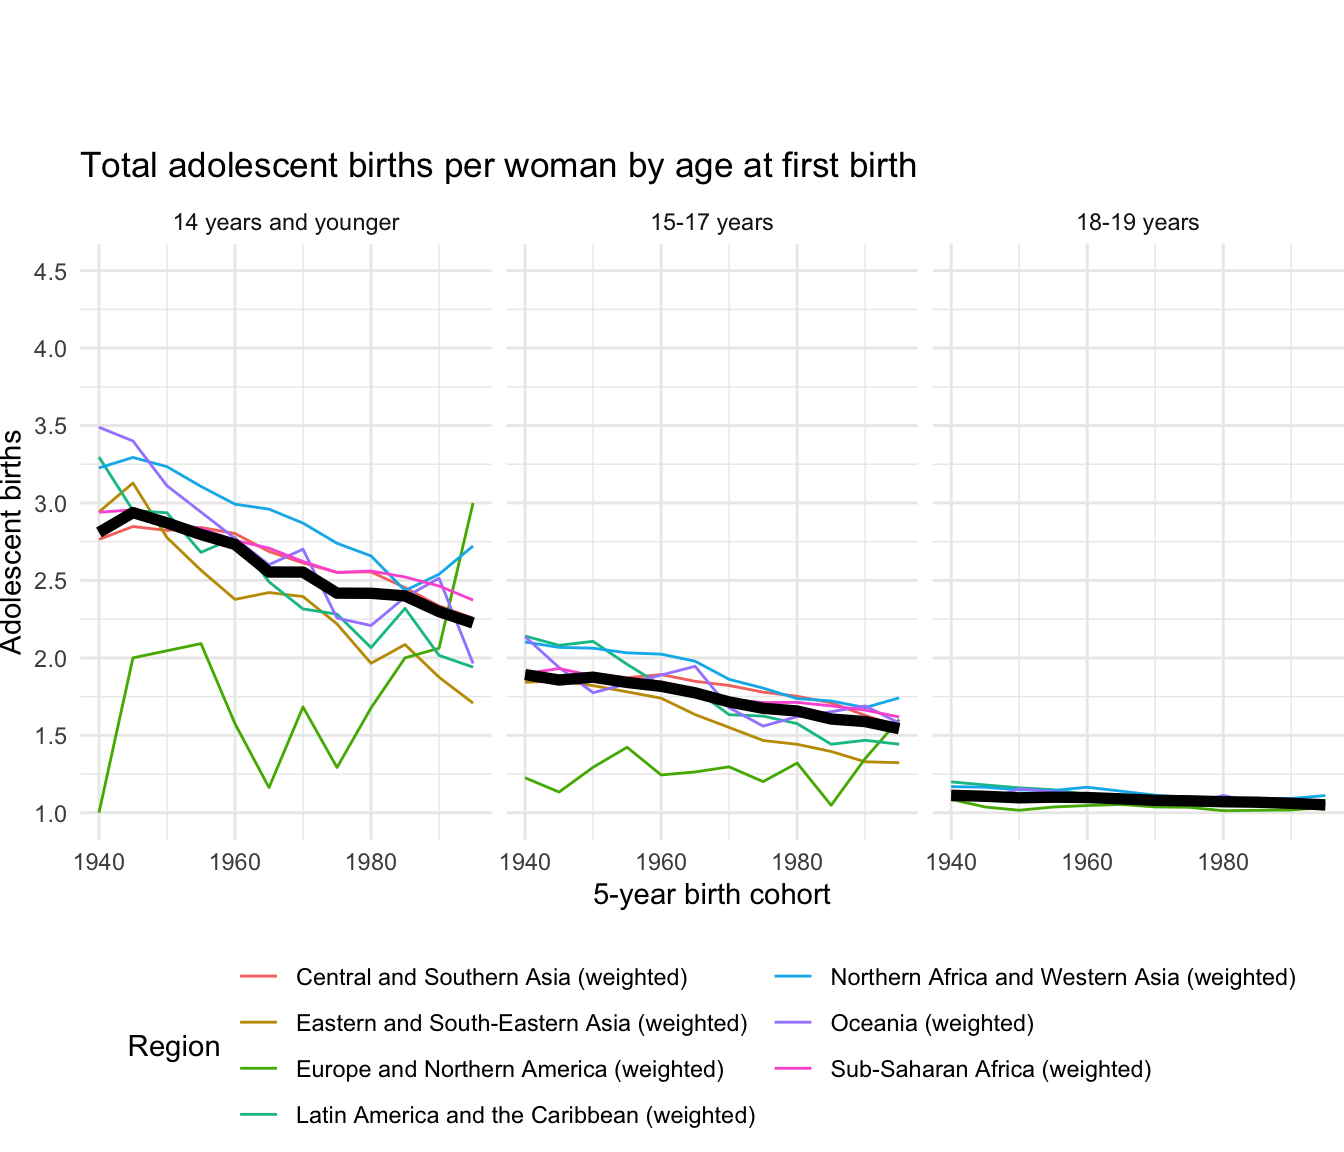
Total adolescent births by age at first birth
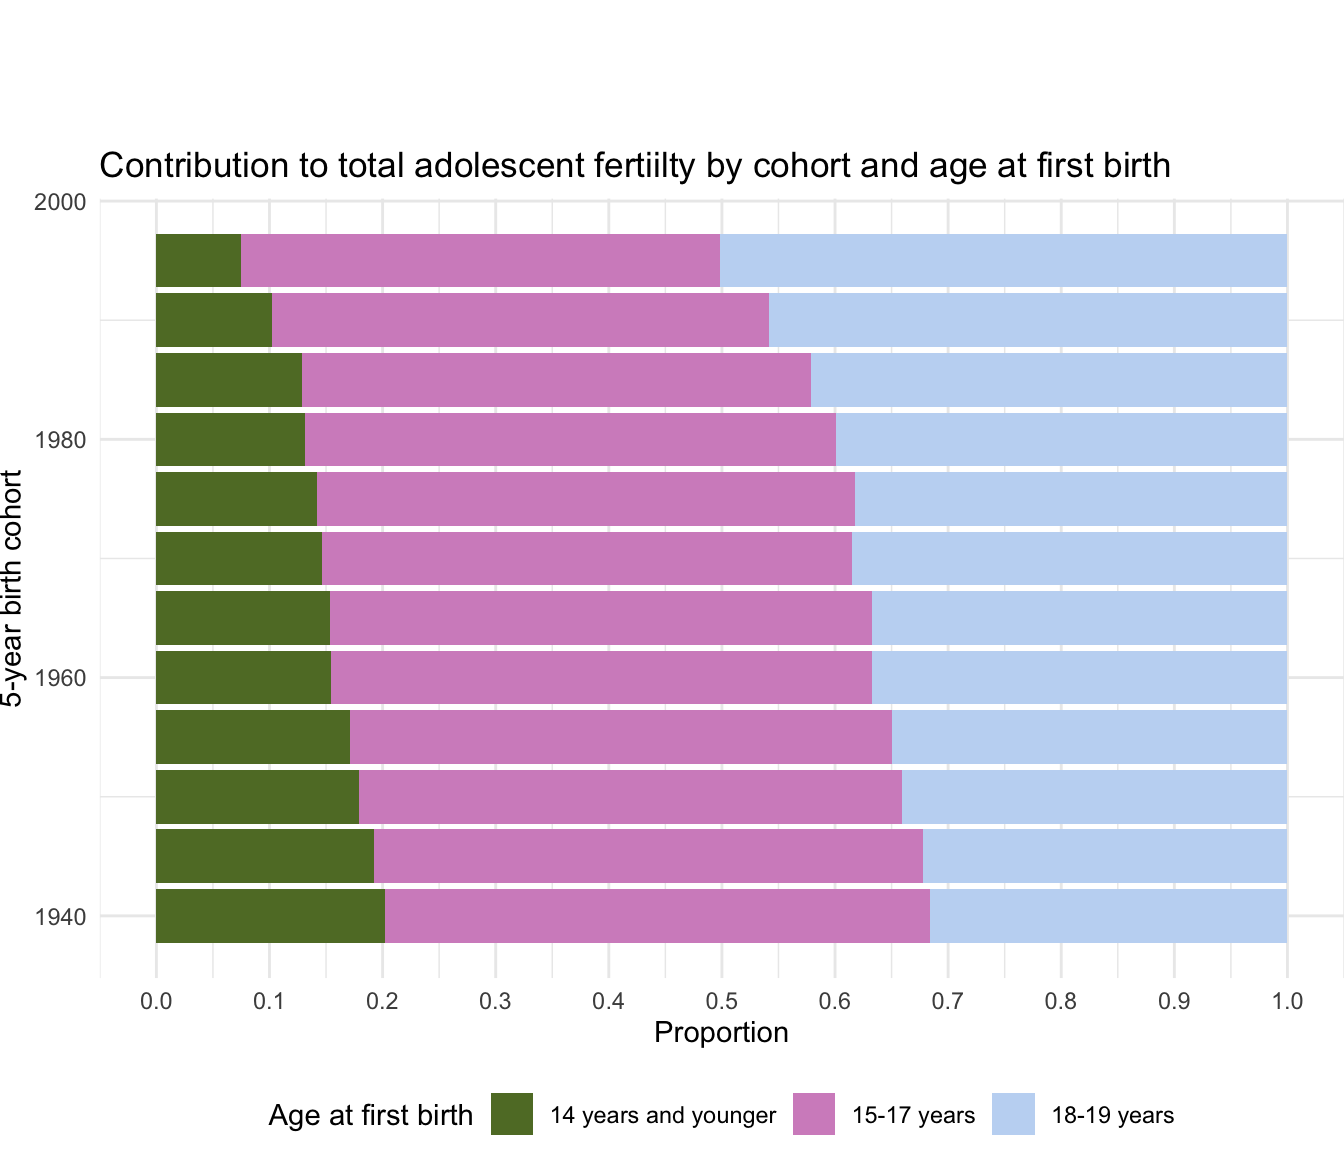
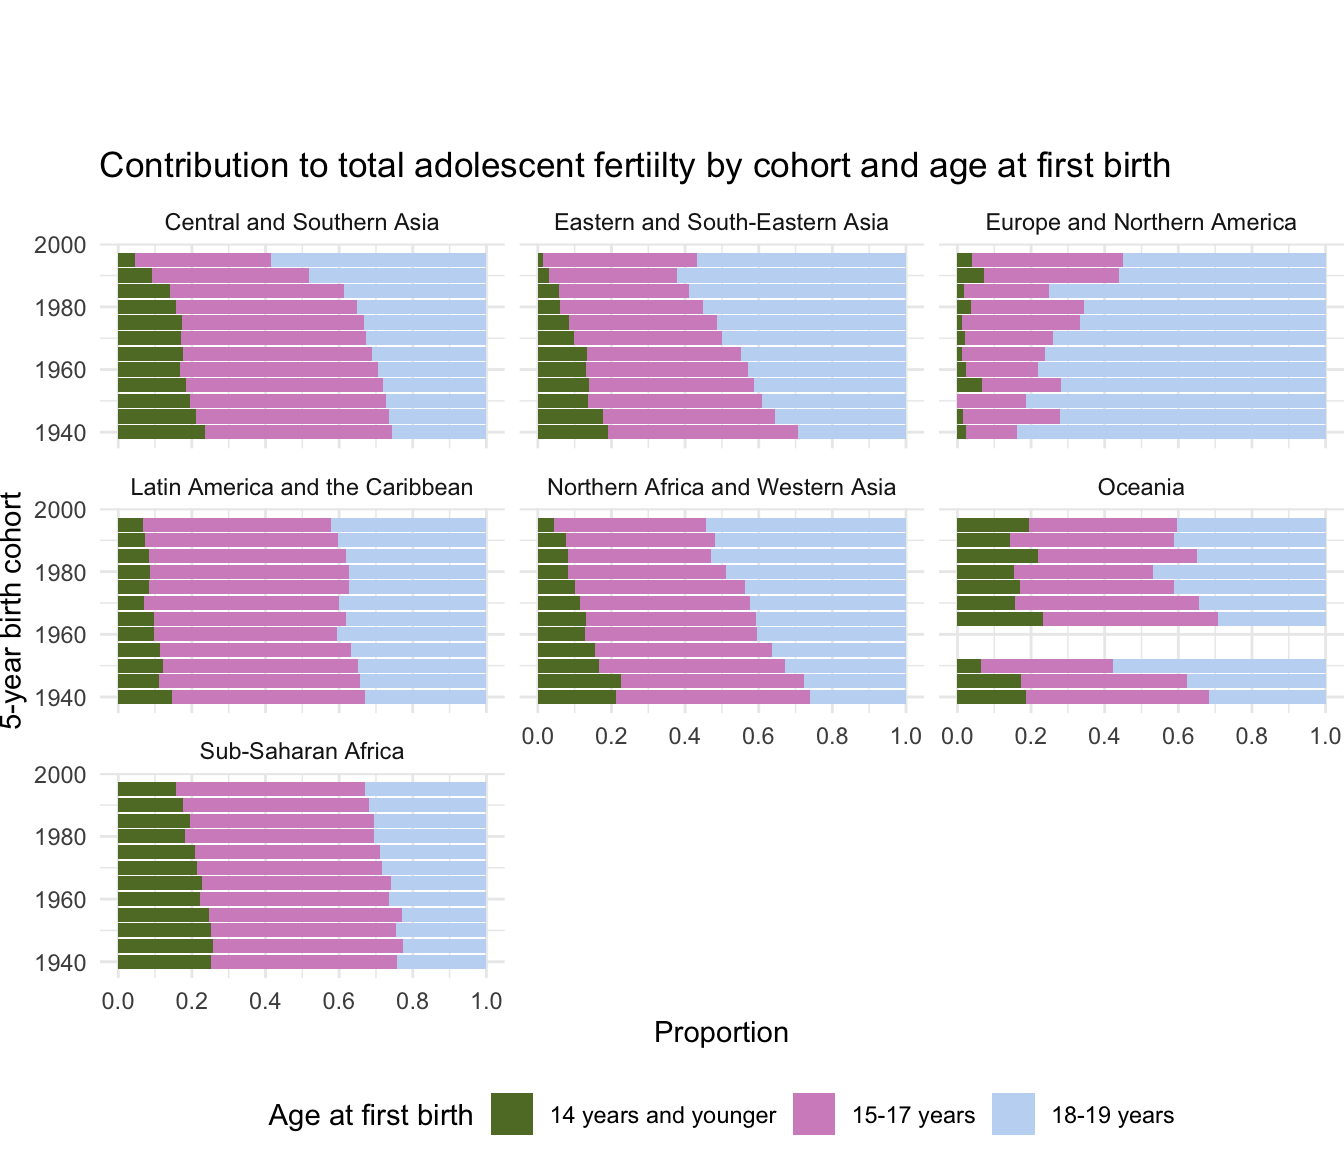
Contribution to total adolescent fertility by cohort and age at first birth
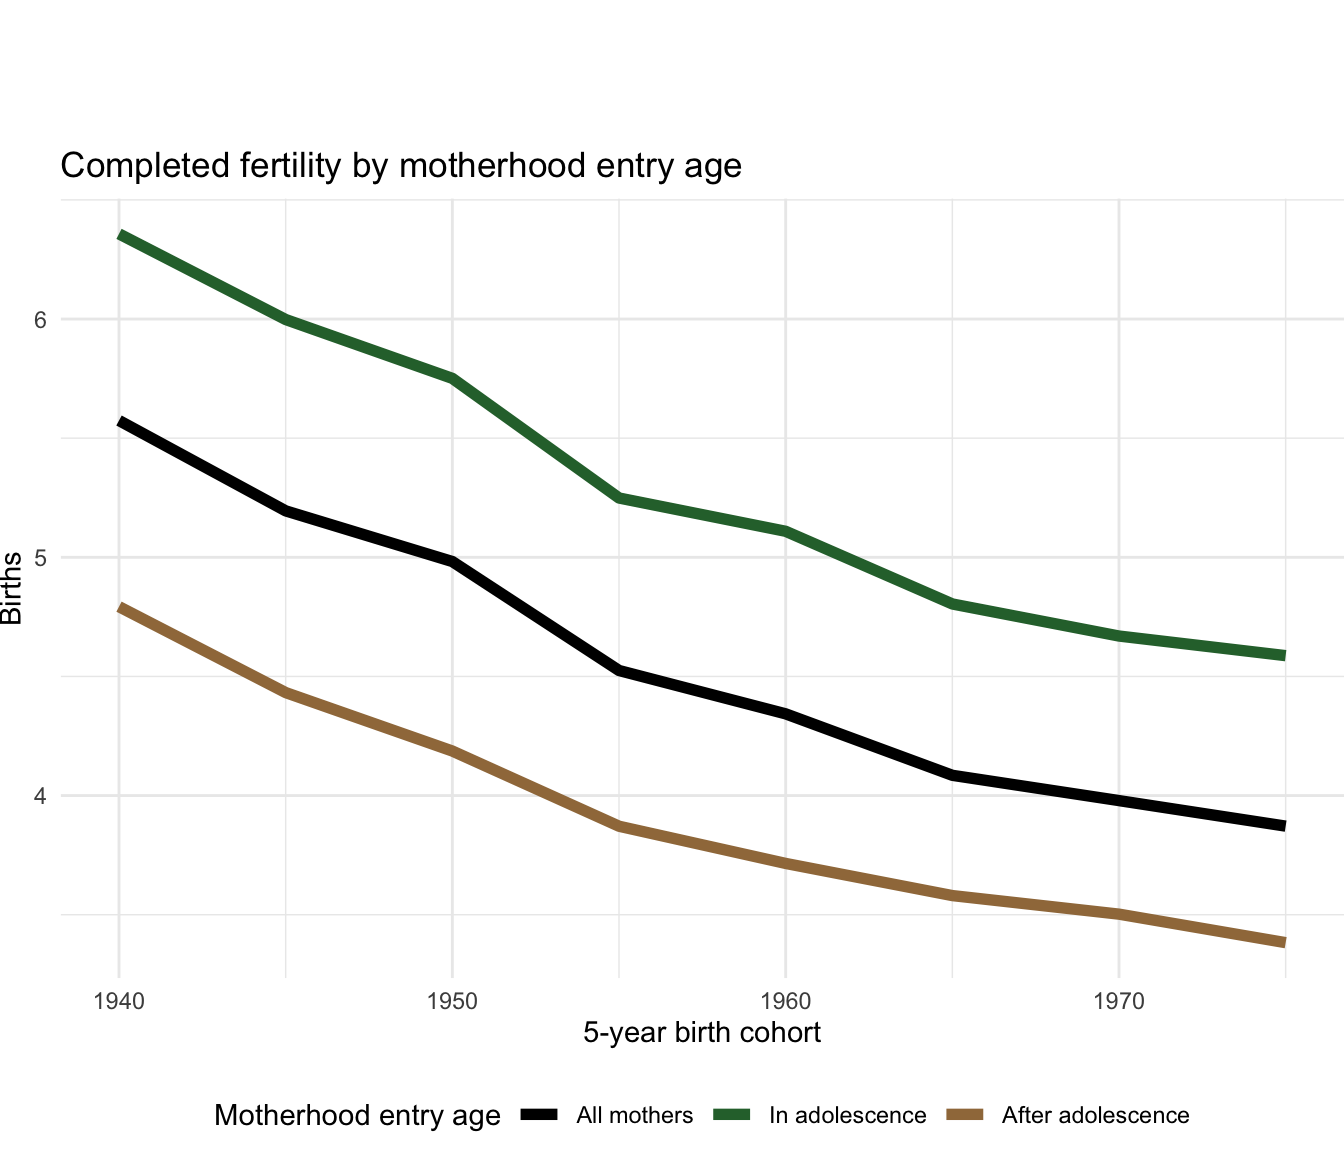
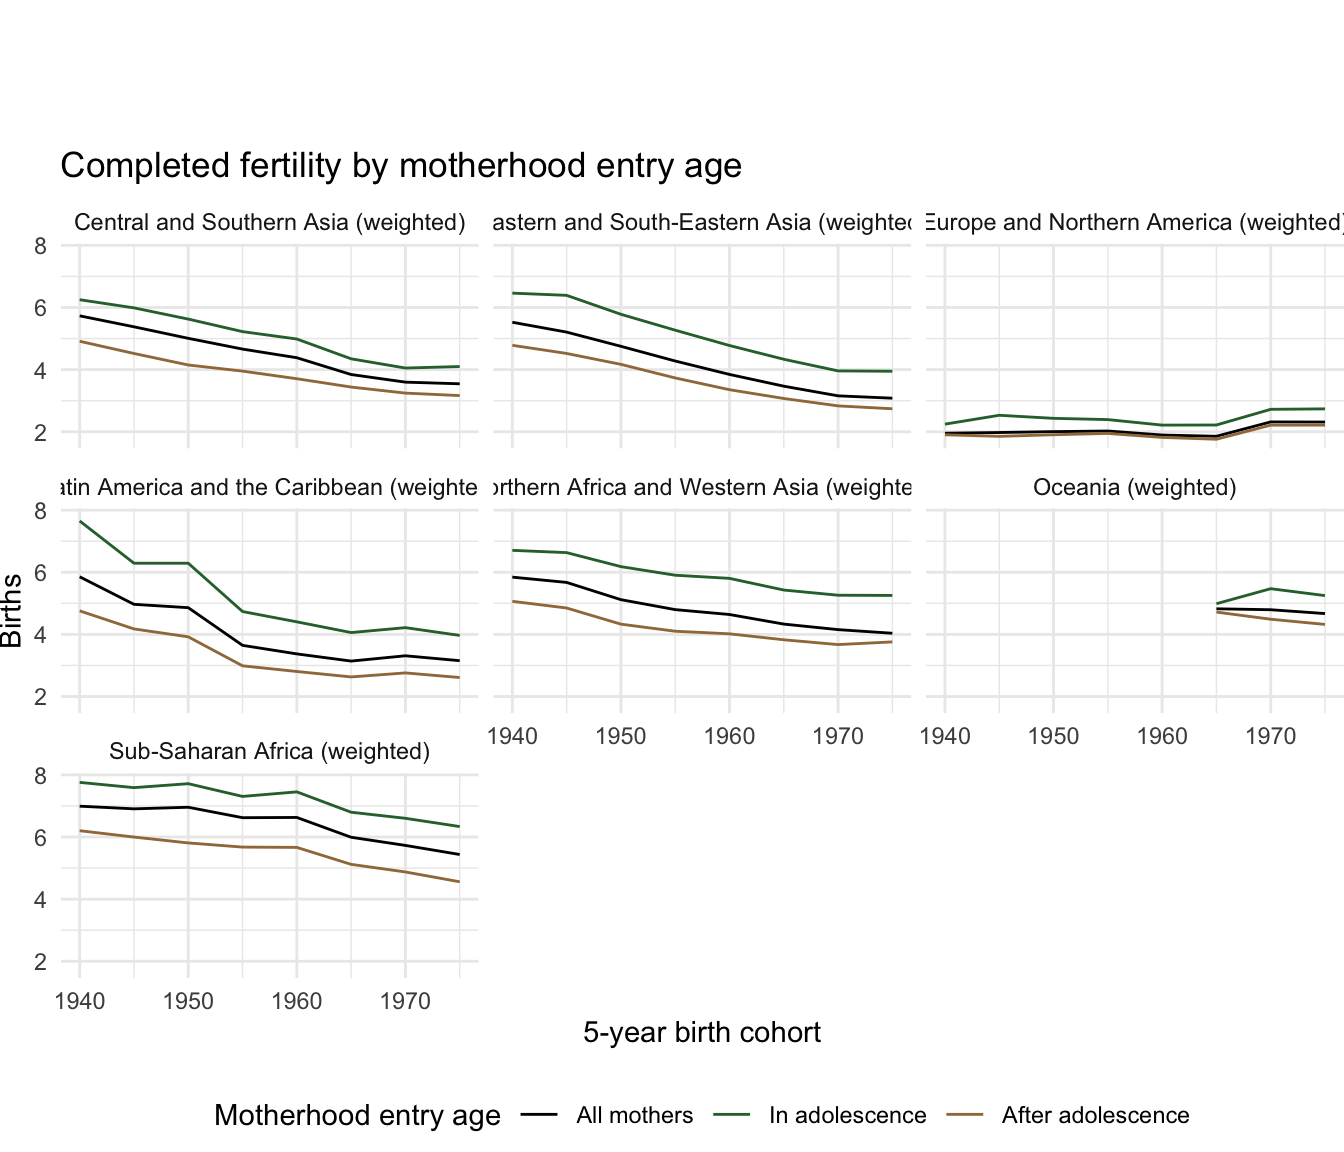
Completed fertility by motherhood entry age
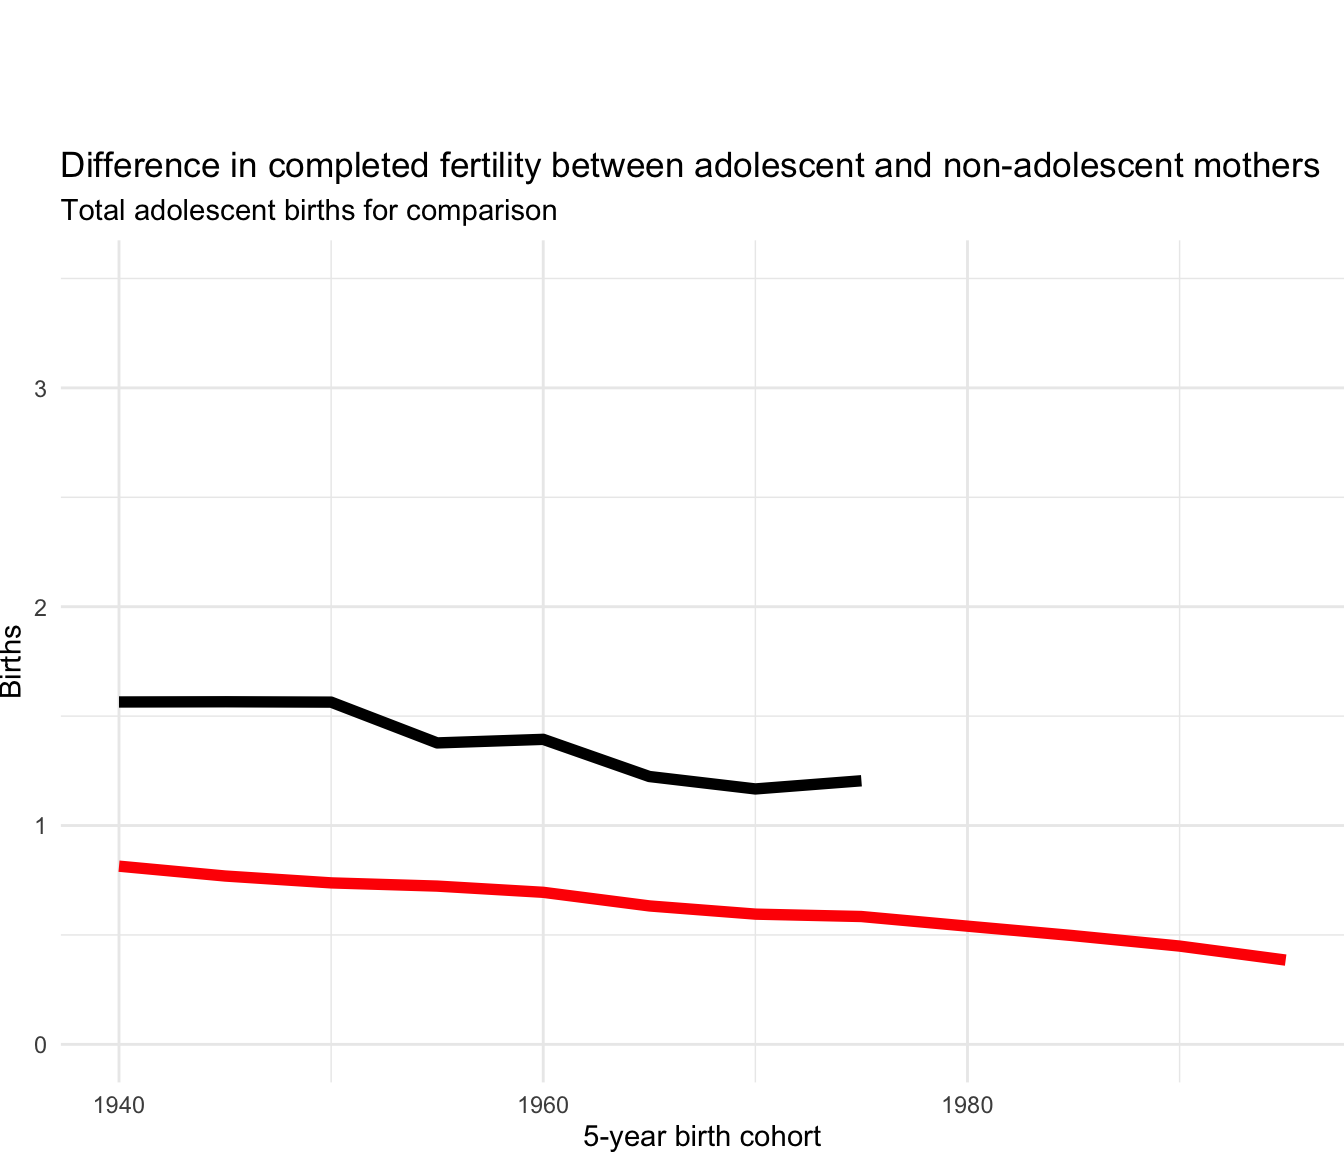
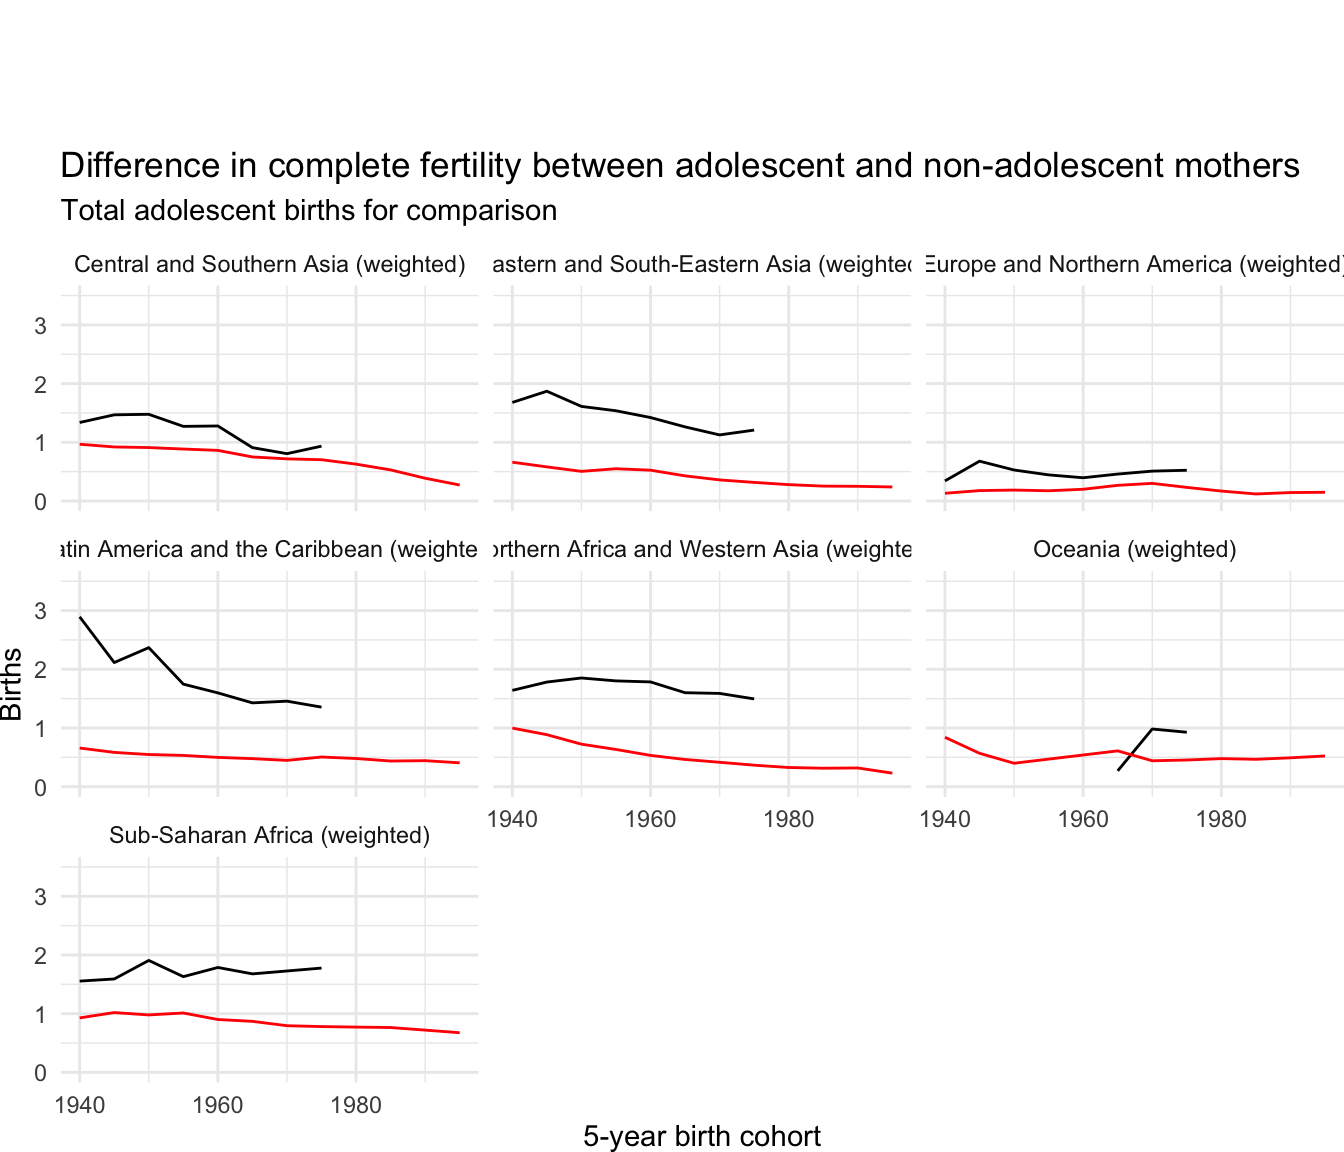
Difference in completed fertility between adolescent and non-adolescent mothers
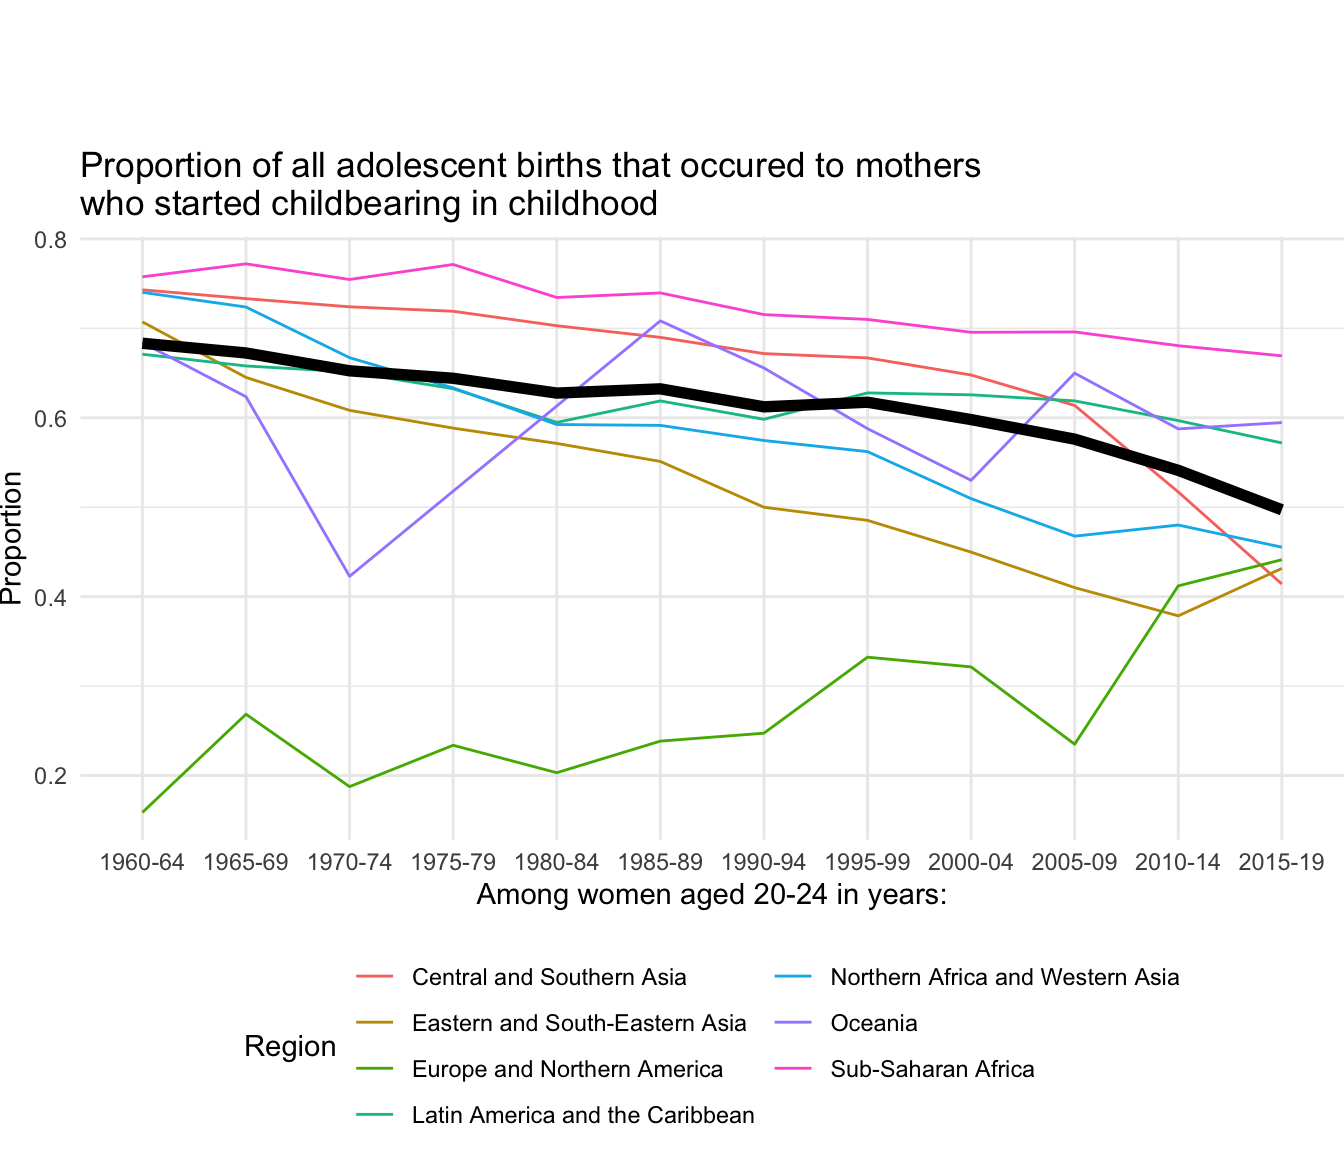
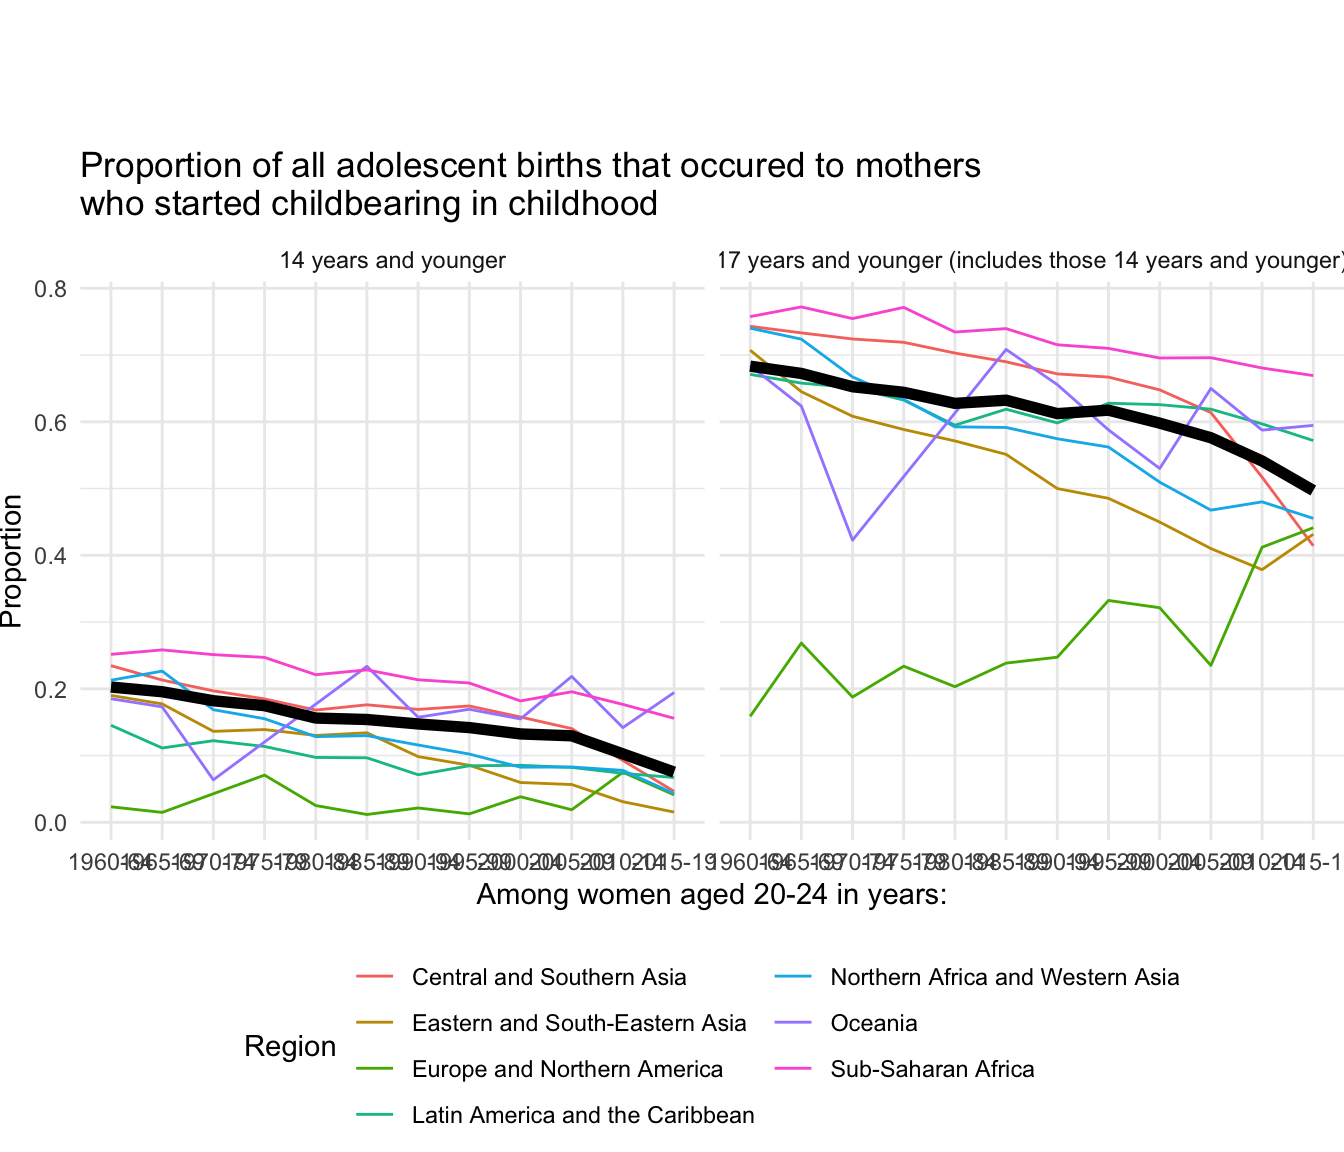
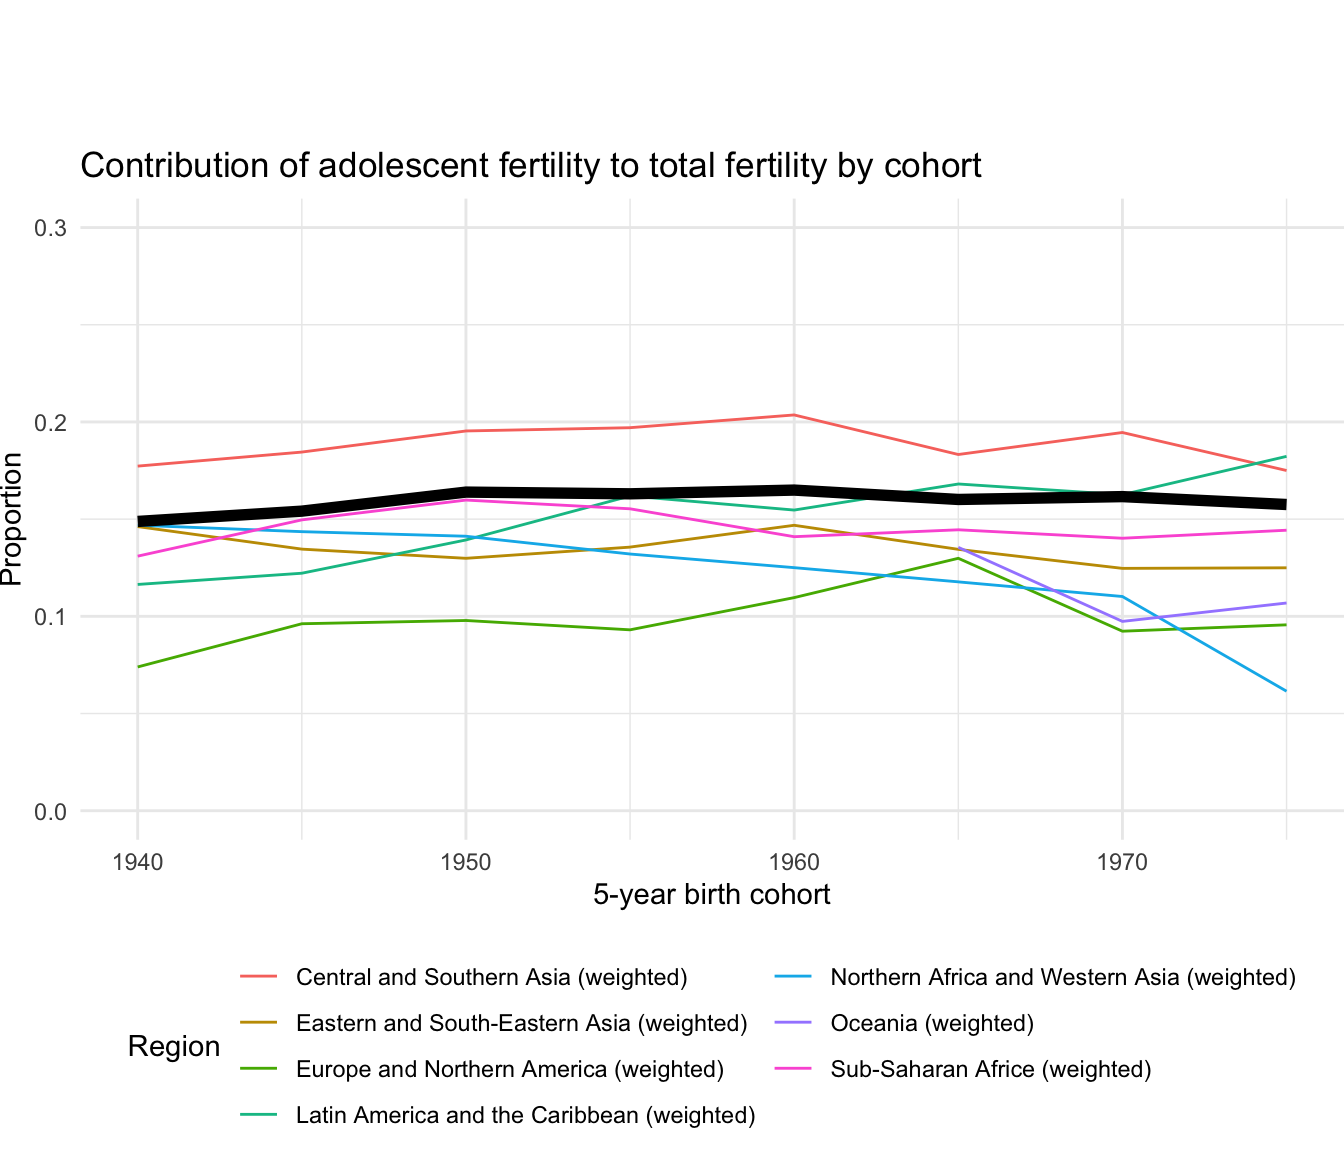
Contribution of adolescent fertility to total fertility by cohort
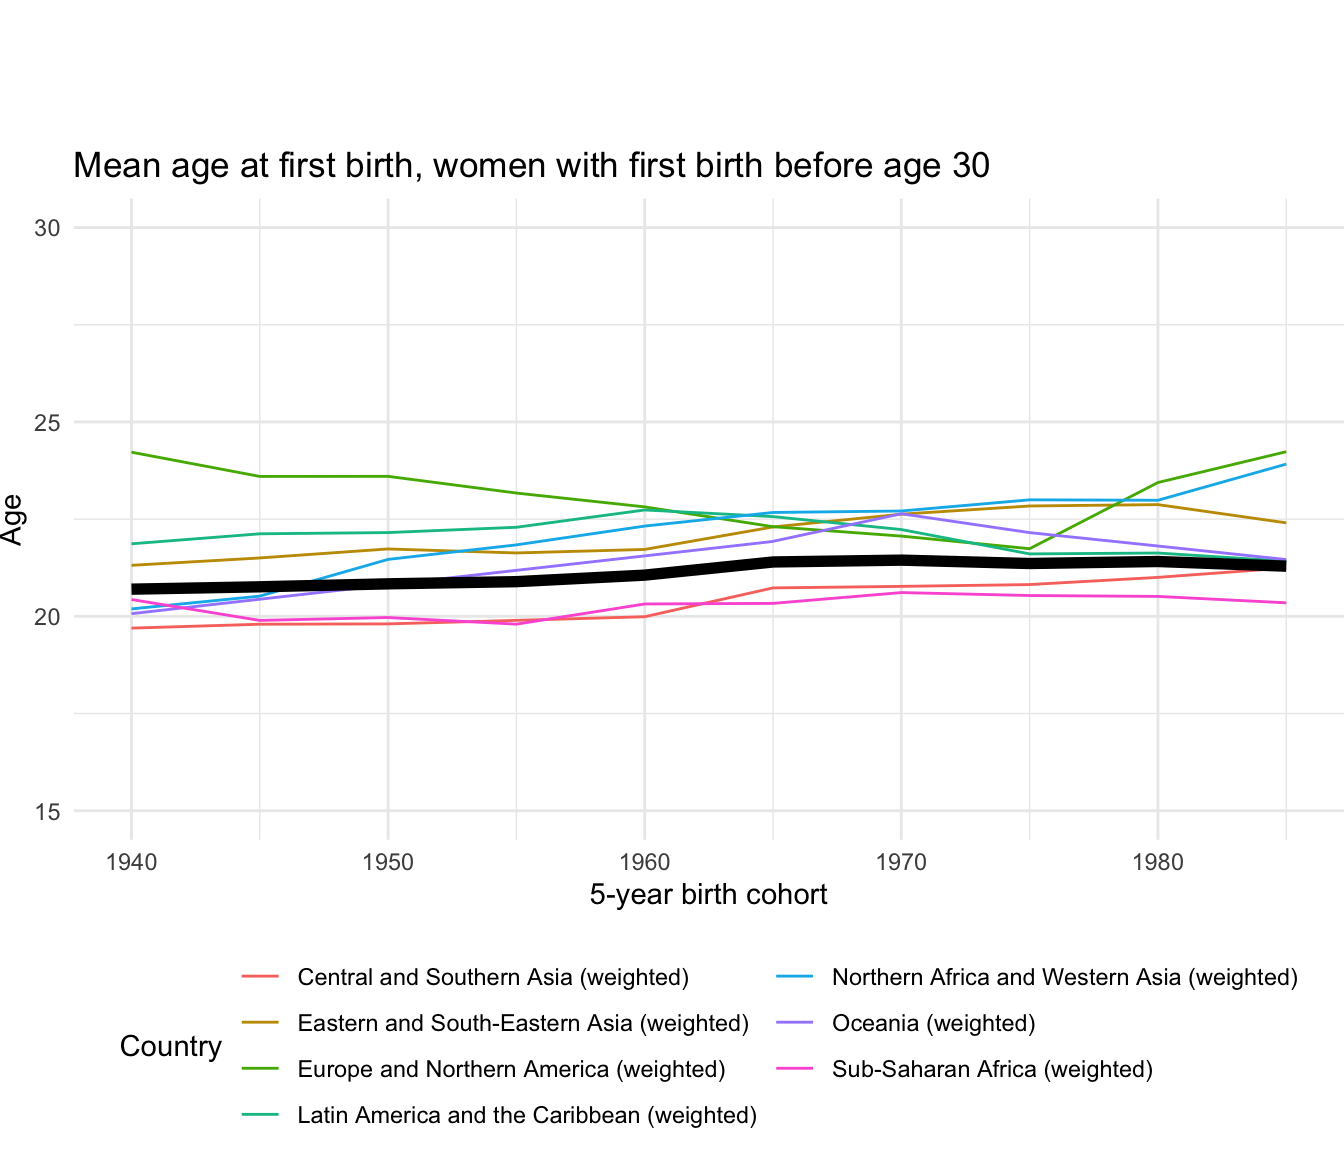
Mean age at first birth
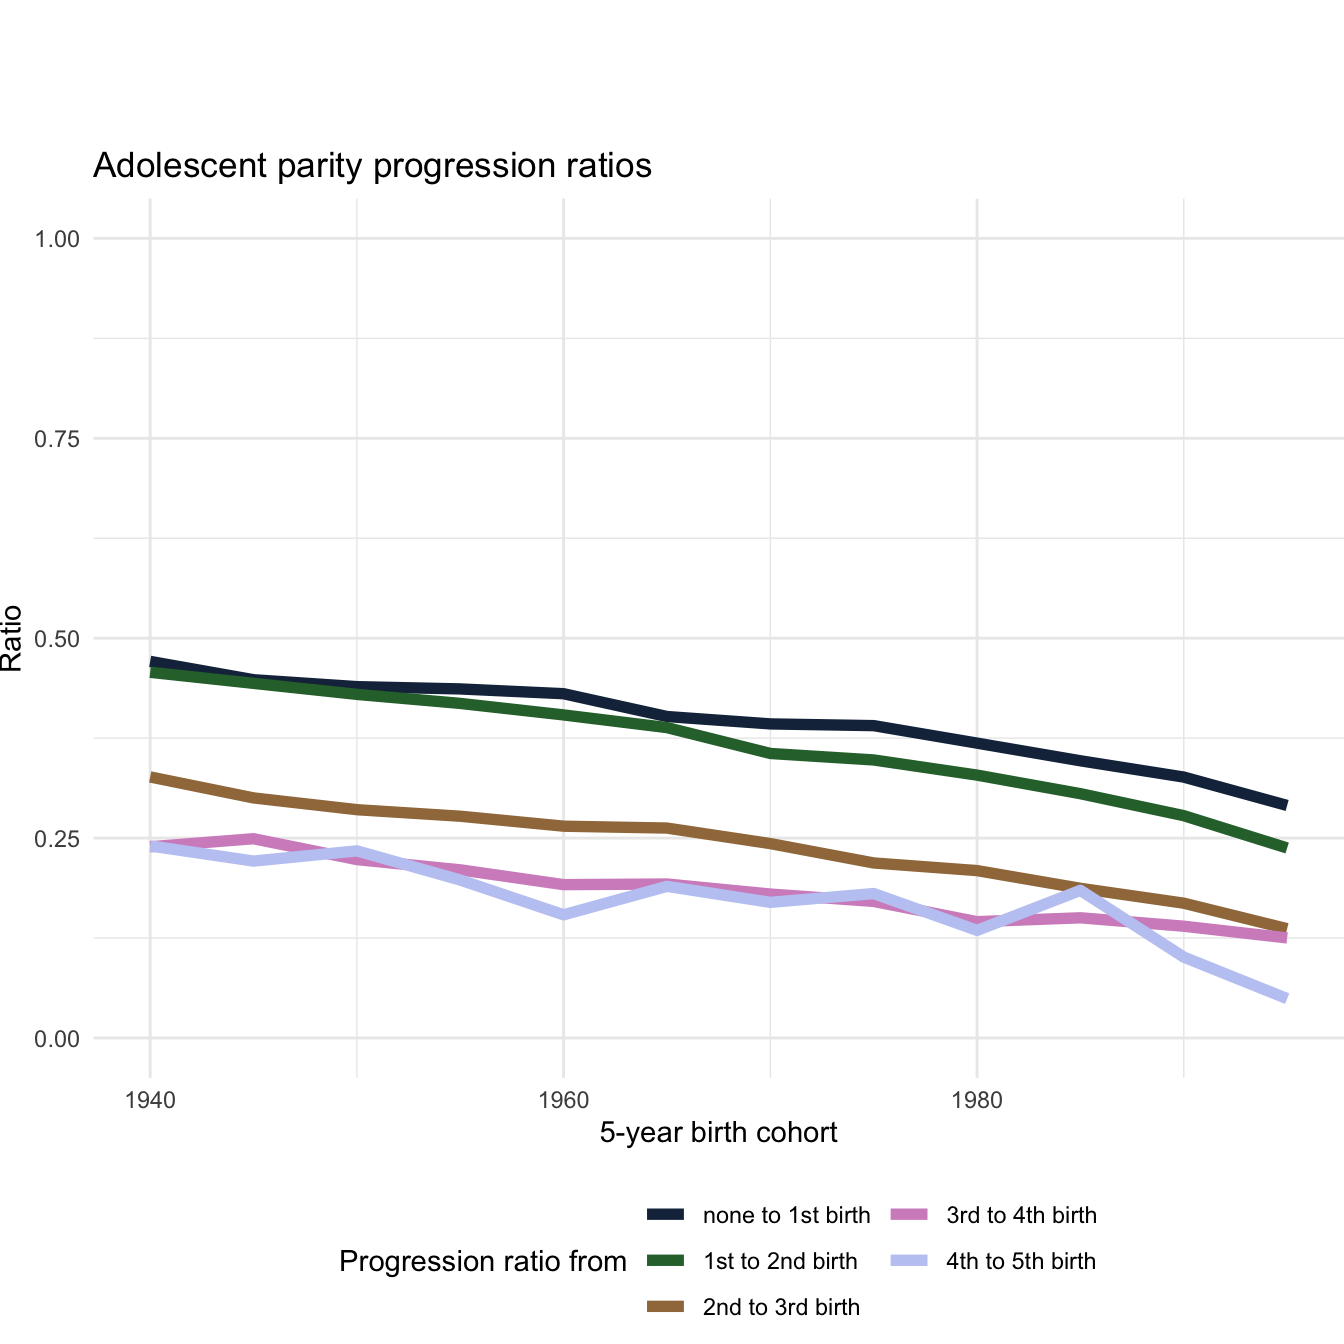
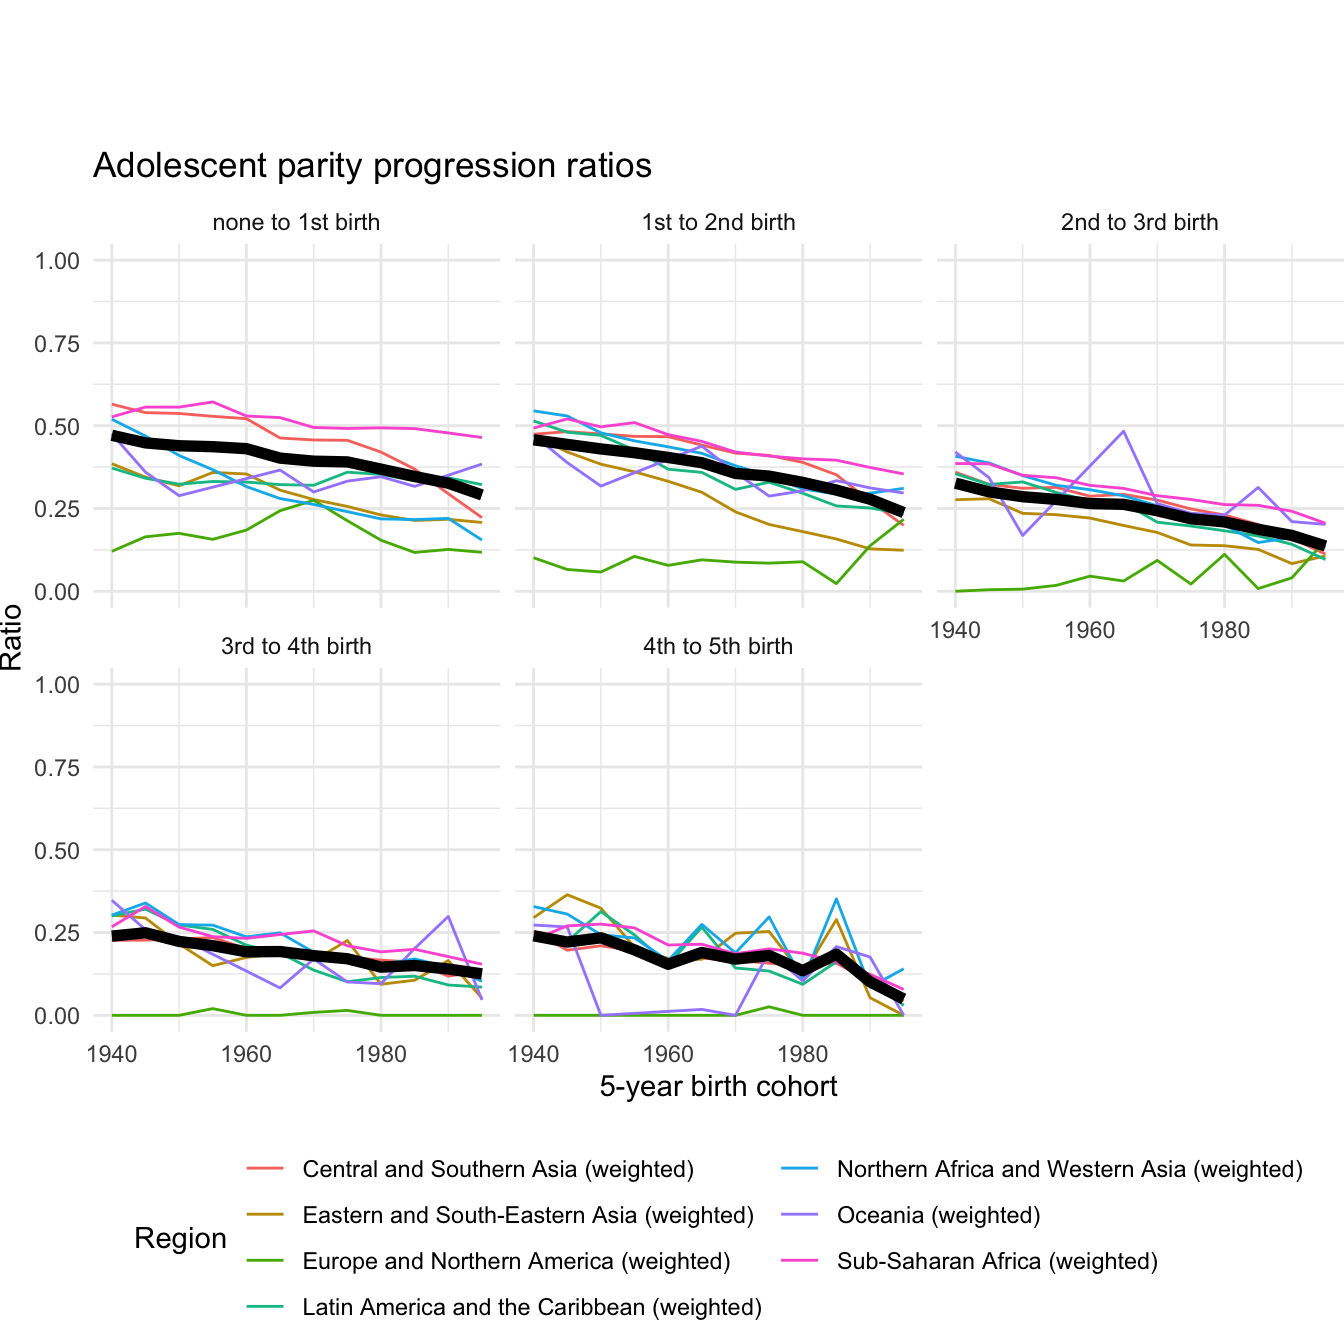
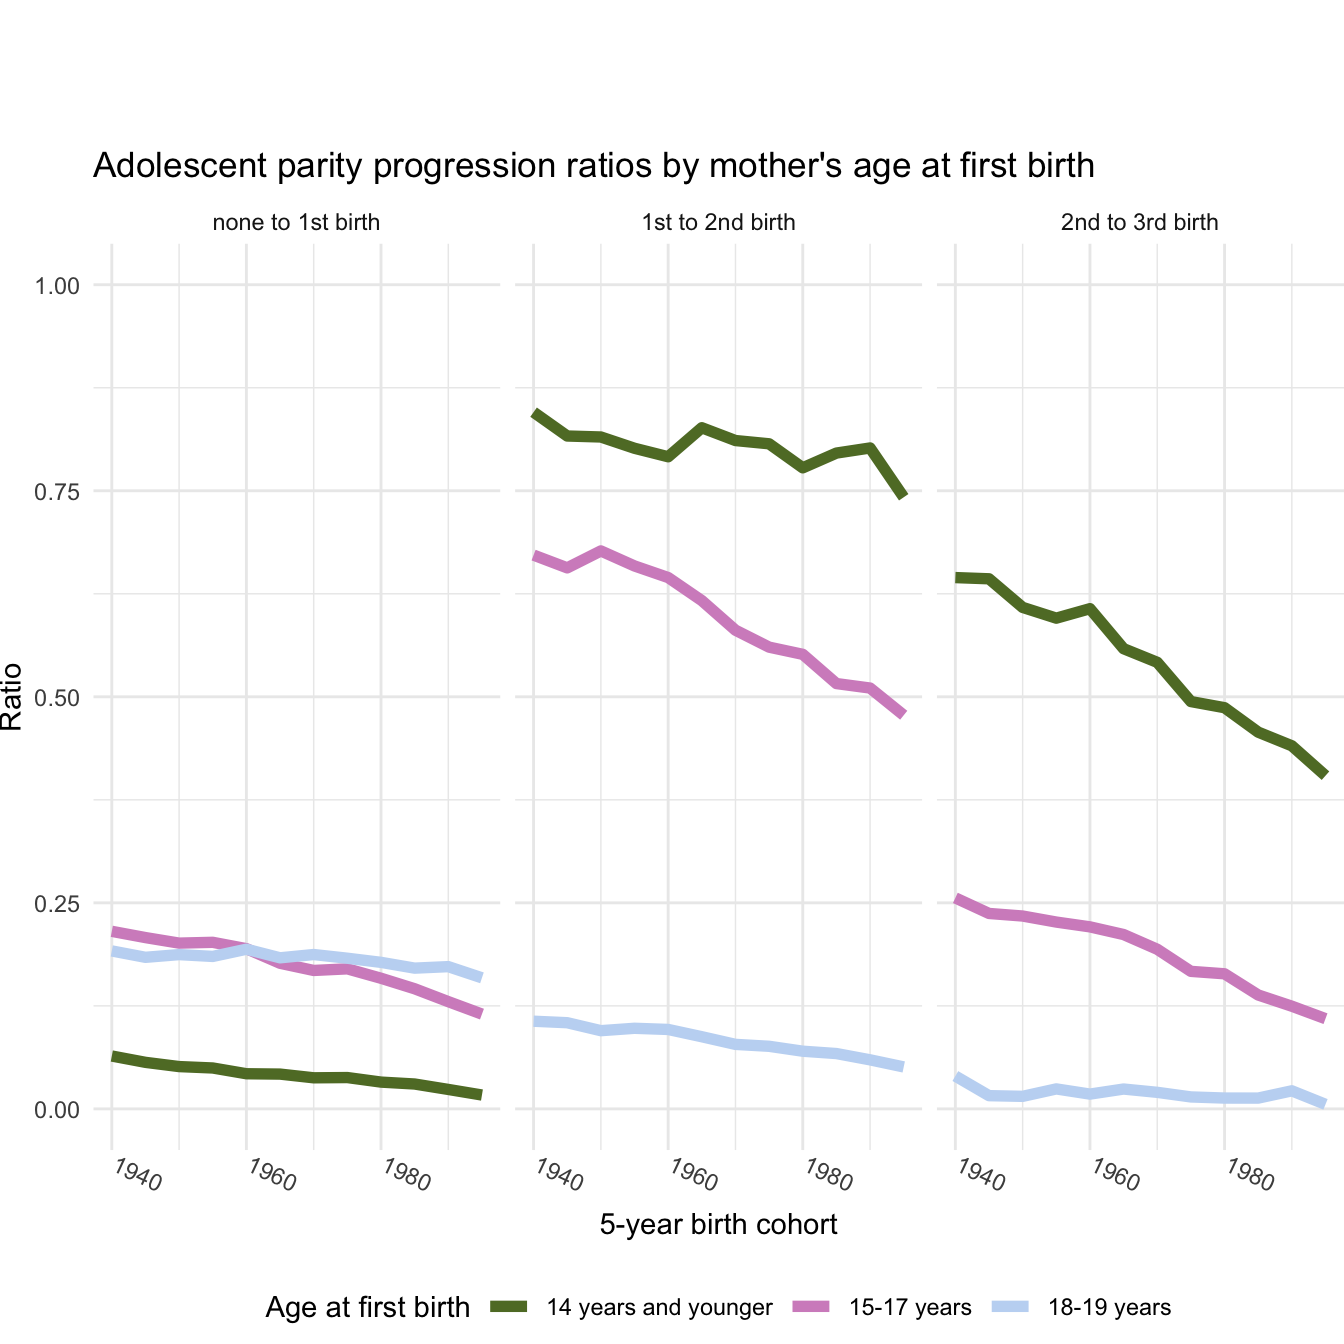
Adolescent parity progression ratios
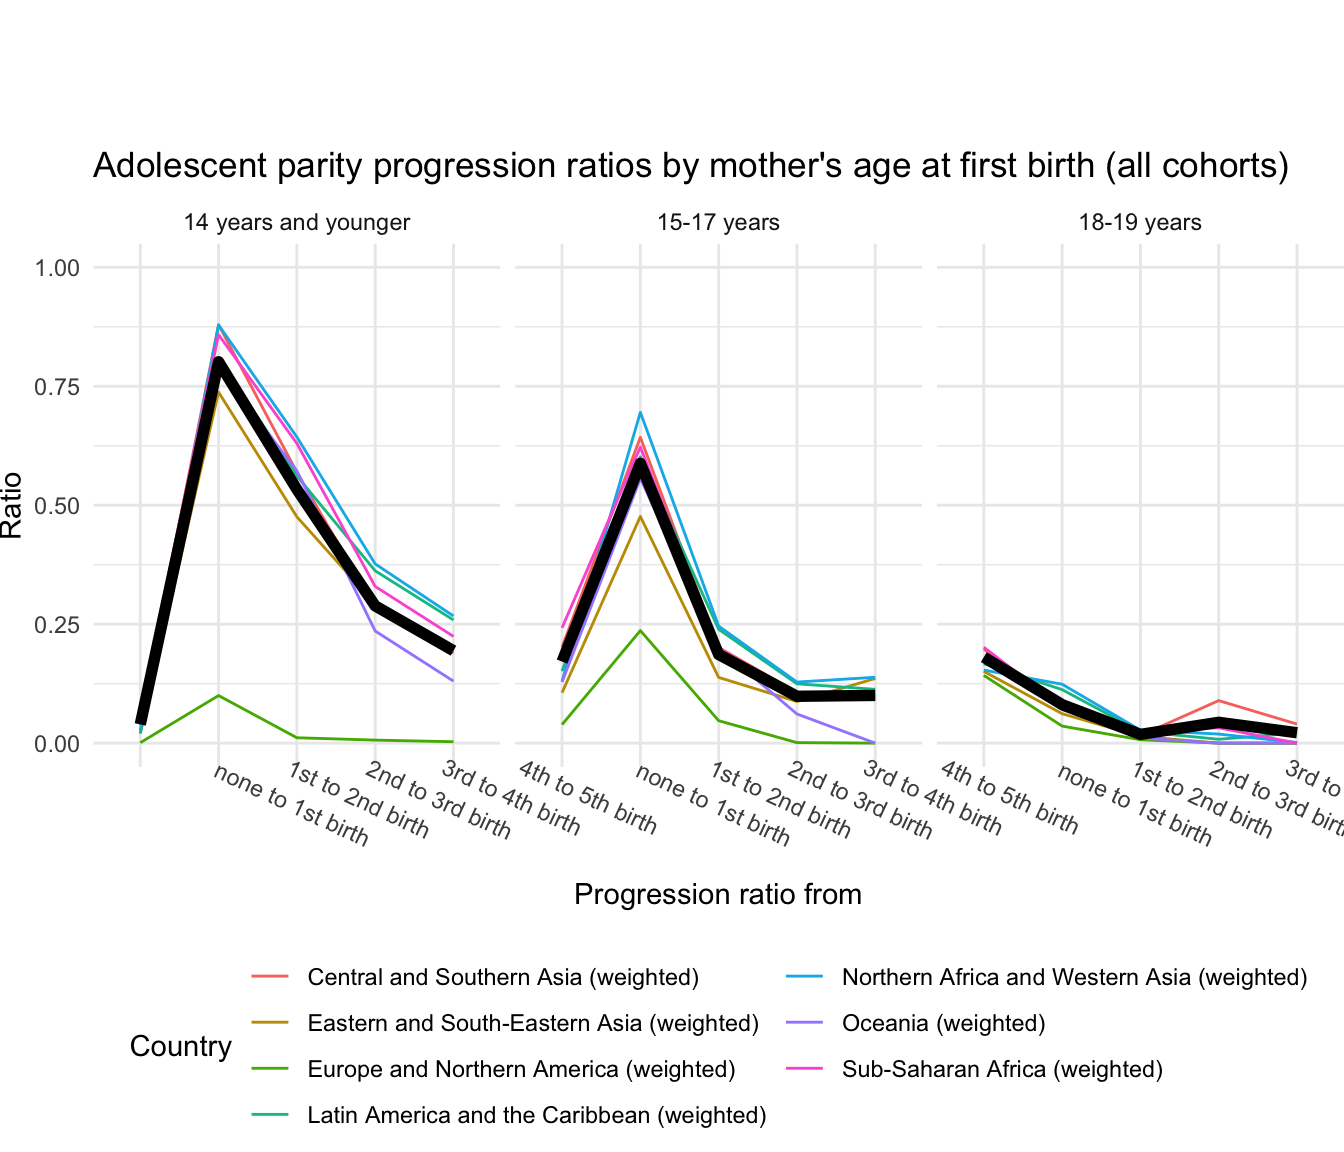
Adolescent parity progression ratios by age at first birth (all cohorts)
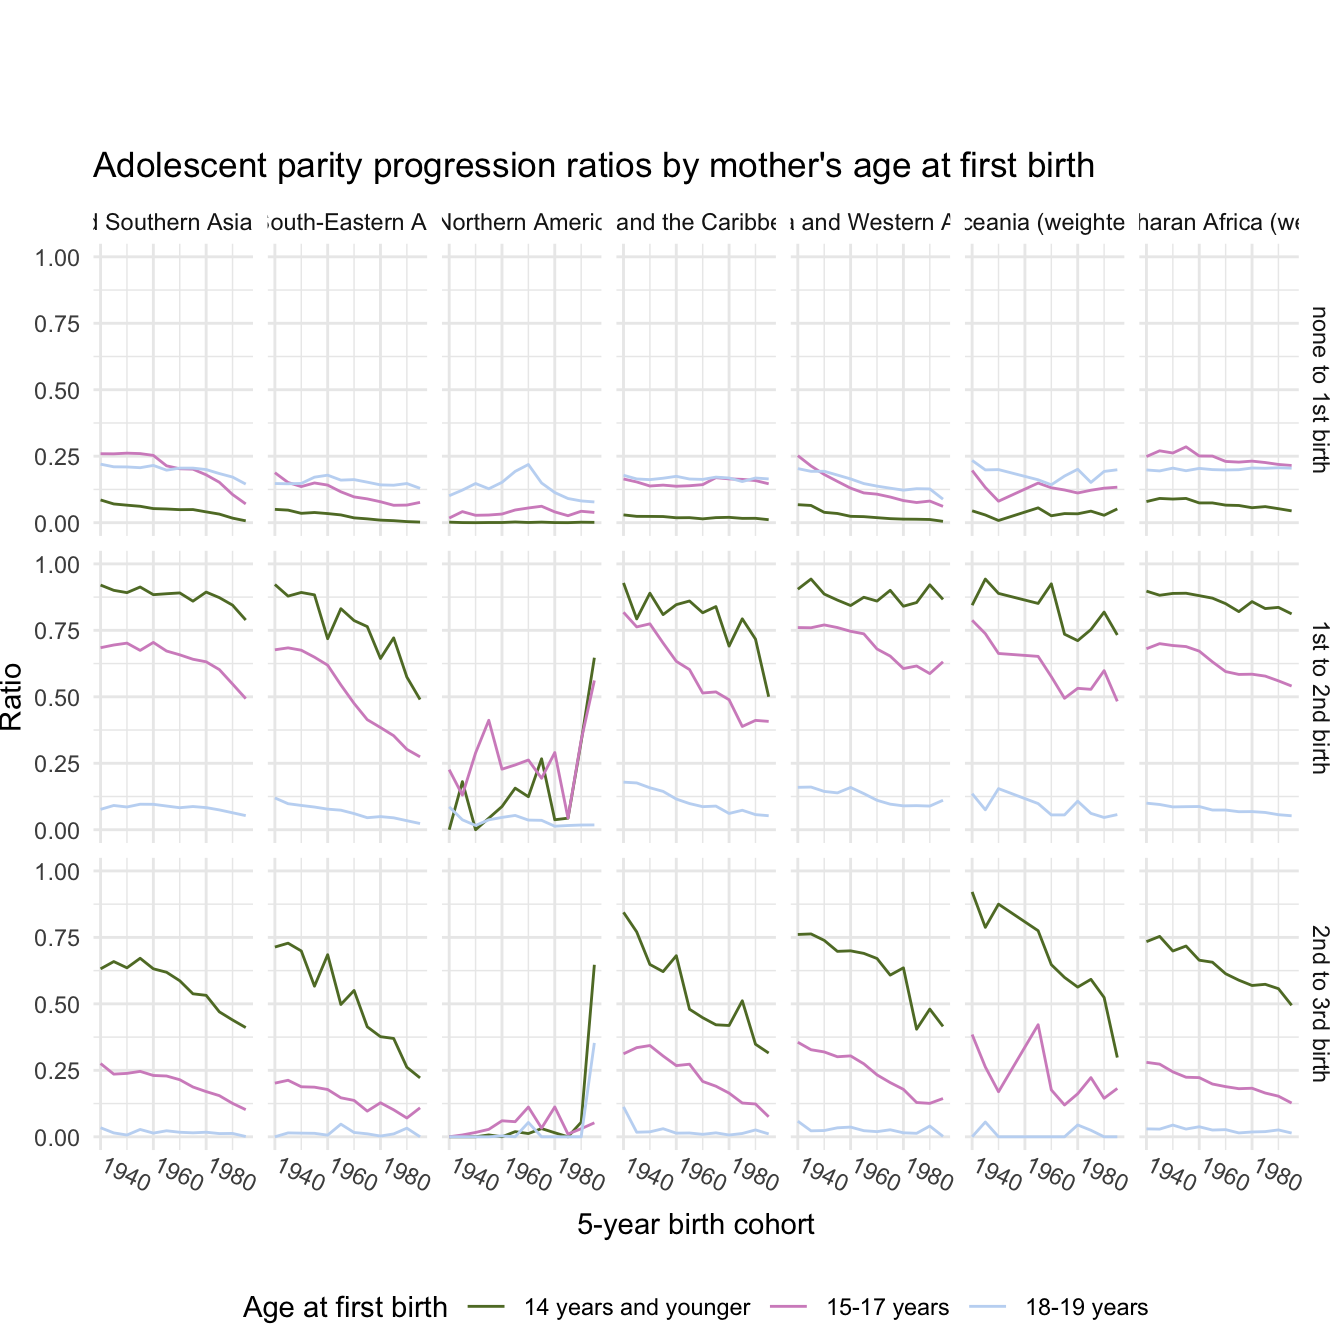
Adolescent parity progression ratios by age at first birth and cohort
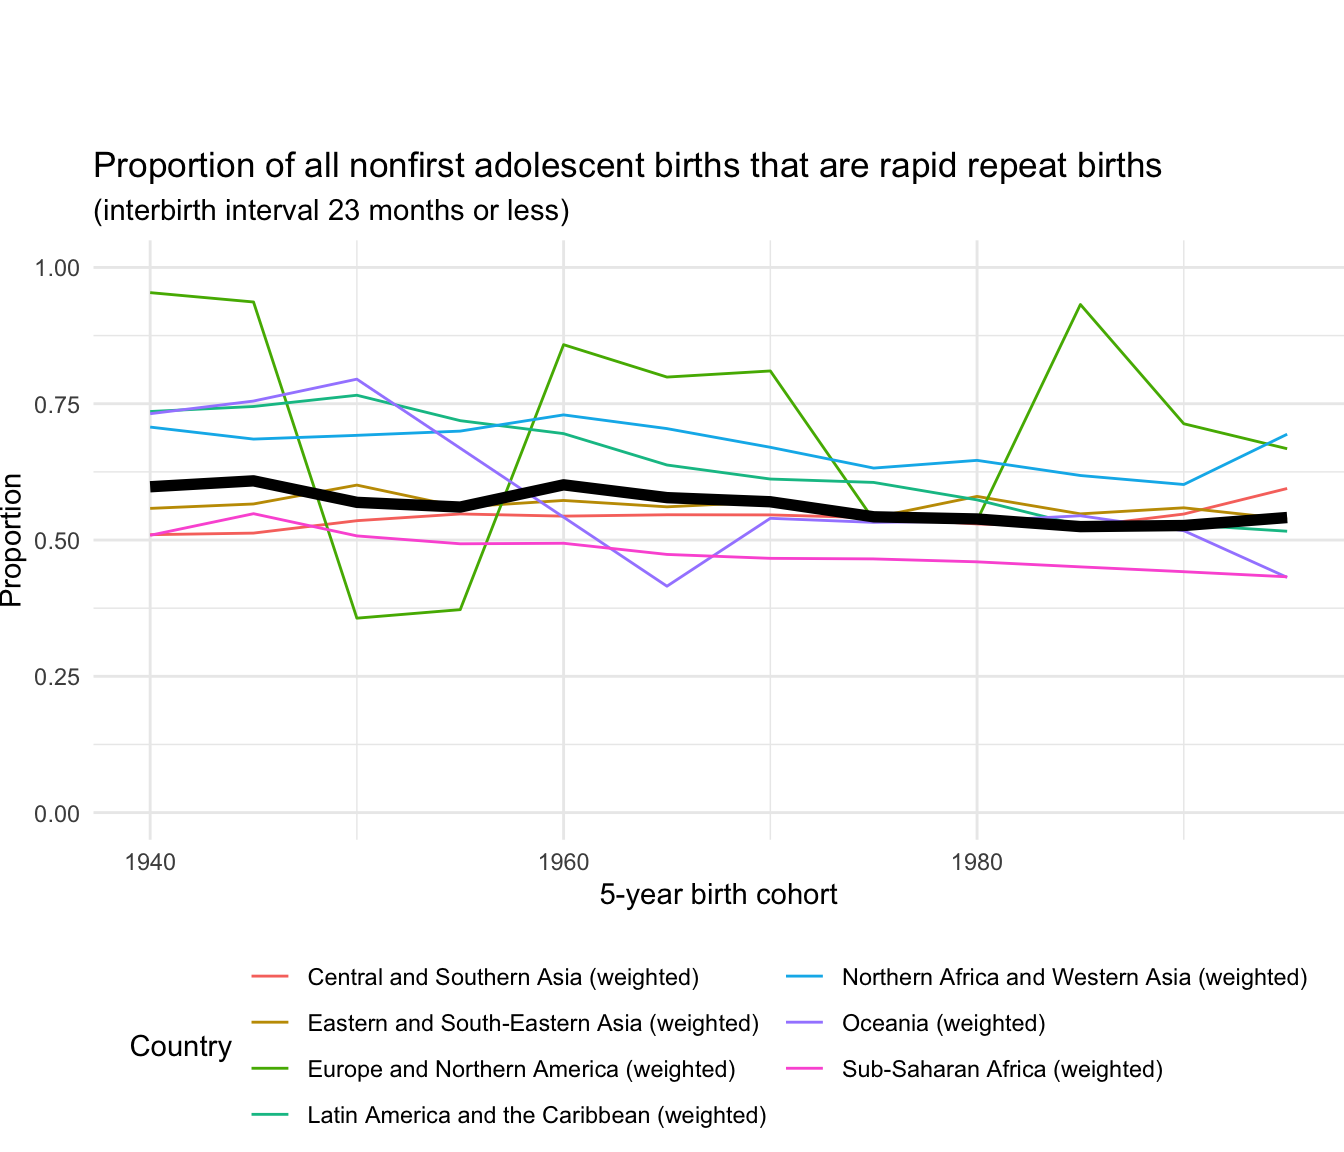
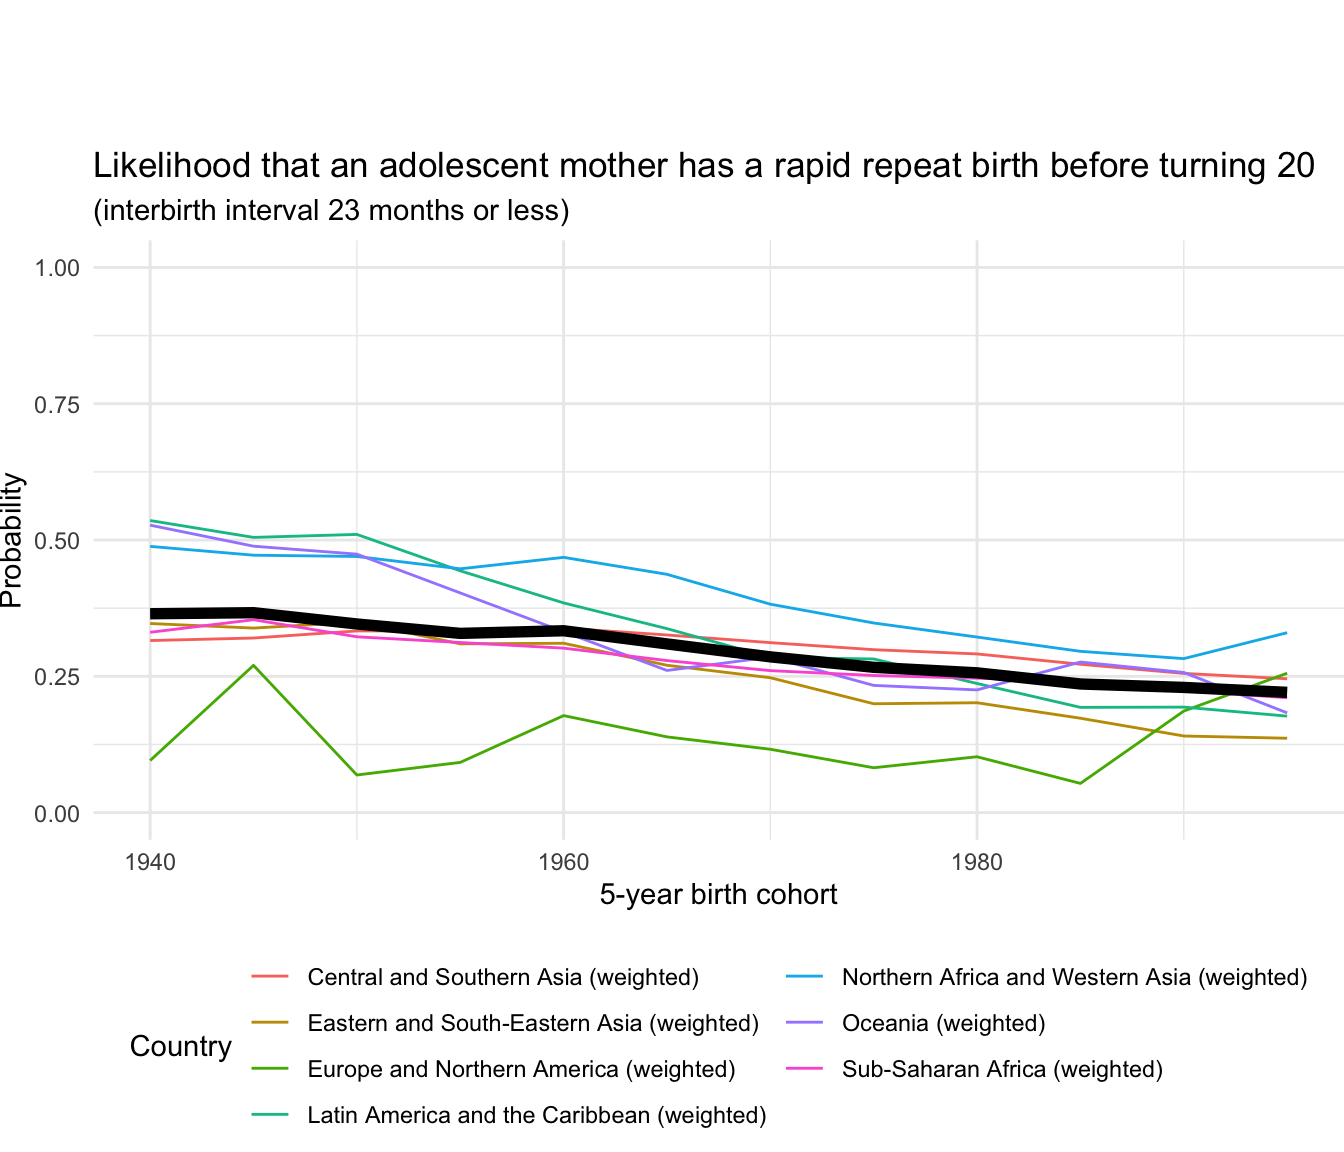
Rapid Repeat Birth probability
Rapid Repeat Birth proportion