8.11 Summary Europe and Northern America
Kosovo not included in UN world population data so also not included in regional summary.
Likewise, North Macedonia (Roma Settlements) and Kosovo (Roma, Ashkali, and Egyptian Communities) are not included in regional figures.
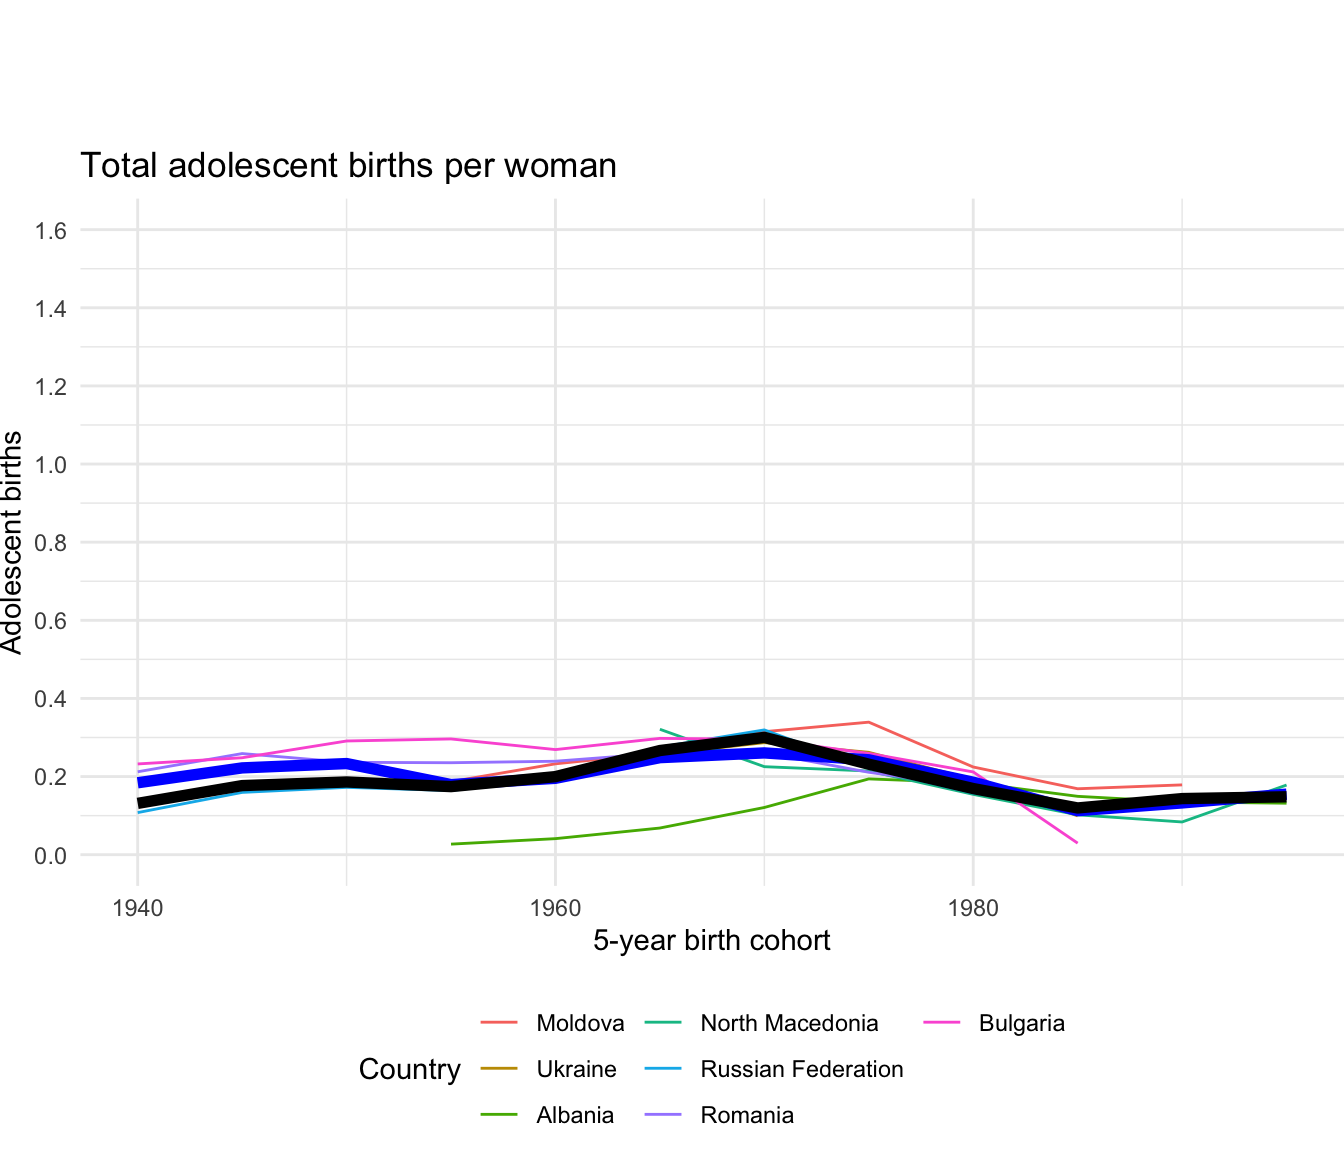
8.11.1 Total adolescent births
Region | 5-year birth cohort | Unweighted average | Weighted average | |
---|---|---|---|---|
|
|
|
| |
1 | Europe and Northern America | 1940 | 0.18 | 0.13 |
2 | Europe and Northern America | 1945 | 0.22 | 0.18 |
3 | Europe and Northern America | 1950 | 0.23 | 0.19 |
4 | Europe and Northern America | 1955 | 0.18 | 0.17 |
5 | Europe and Northern America | 1960 | 0.20 | 0.20 |
6 | Europe and Northern America | 1965 | 0.25 | 0.27 |
7 | Europe and Northern America | 1970 | 0.26 | 0.30 |
8 | Europe and Northern America | 1975 | 0.24 | 0.23 |
9 | Europe and Northern America | 1980 | 0.19 | 0.17 |
10 | Europe and Northern America | 1985 | 0.11 | 0.12 |
Showing 1 to 10 of 12 entries
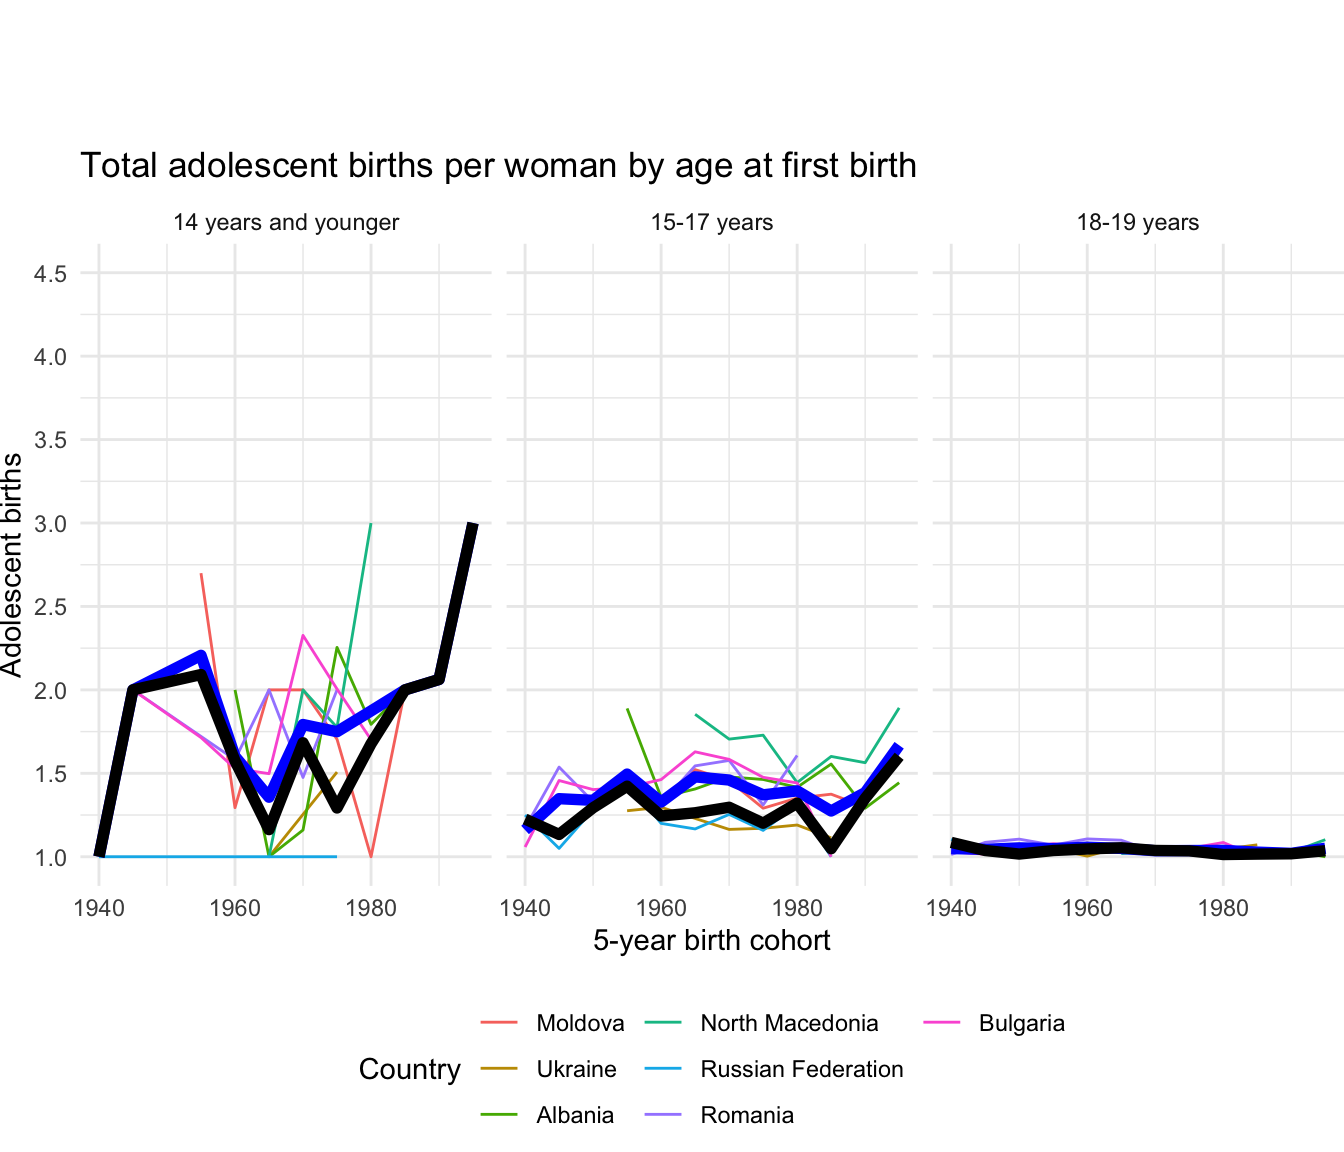
8.11.2 Total adolescent births by age at first birth
Region | 5-year birth cohort | Age at first birth | Unweighted average | Weighted average | |
---|---|---|---|---|---|
|
|
|
|
| |
1 | Europe and Northern America | 1940 | 14 years and younger | 1.00 | 1.00 |
2 | Europe and Northern America | 1940 | 15-17 years | 1.16 | 1.23 |
3 | Europe and Northern America | 1940 | 18-19 years | 1.05 | 1.09 |
4 | Europe and Northern America | 1945 | 14 years and younger | 2.00 | 2.00 |
5 | Europe and Northern America | 1945 | 15-17 years | 1.35 | 1.13 |
6 | Europe and Northern America | 1945 | 18-19 years | 1.04 | 1.04 |
7 | Europe and Northern America | 1950 | 15-17 years | 1.34 | 1.29 |
8 | Europe and Northern America | 1950 | 18-19 years | 1.05 | 1.02 |
9 | Europe and Northern America | 1955 | 14 years and younger | 2.21 | 2.09 |
10 | Europe and Northern America | 1955 | 15-17 years | 1.50 | 1.42 |
Showing 1 to 10 of 35 entries
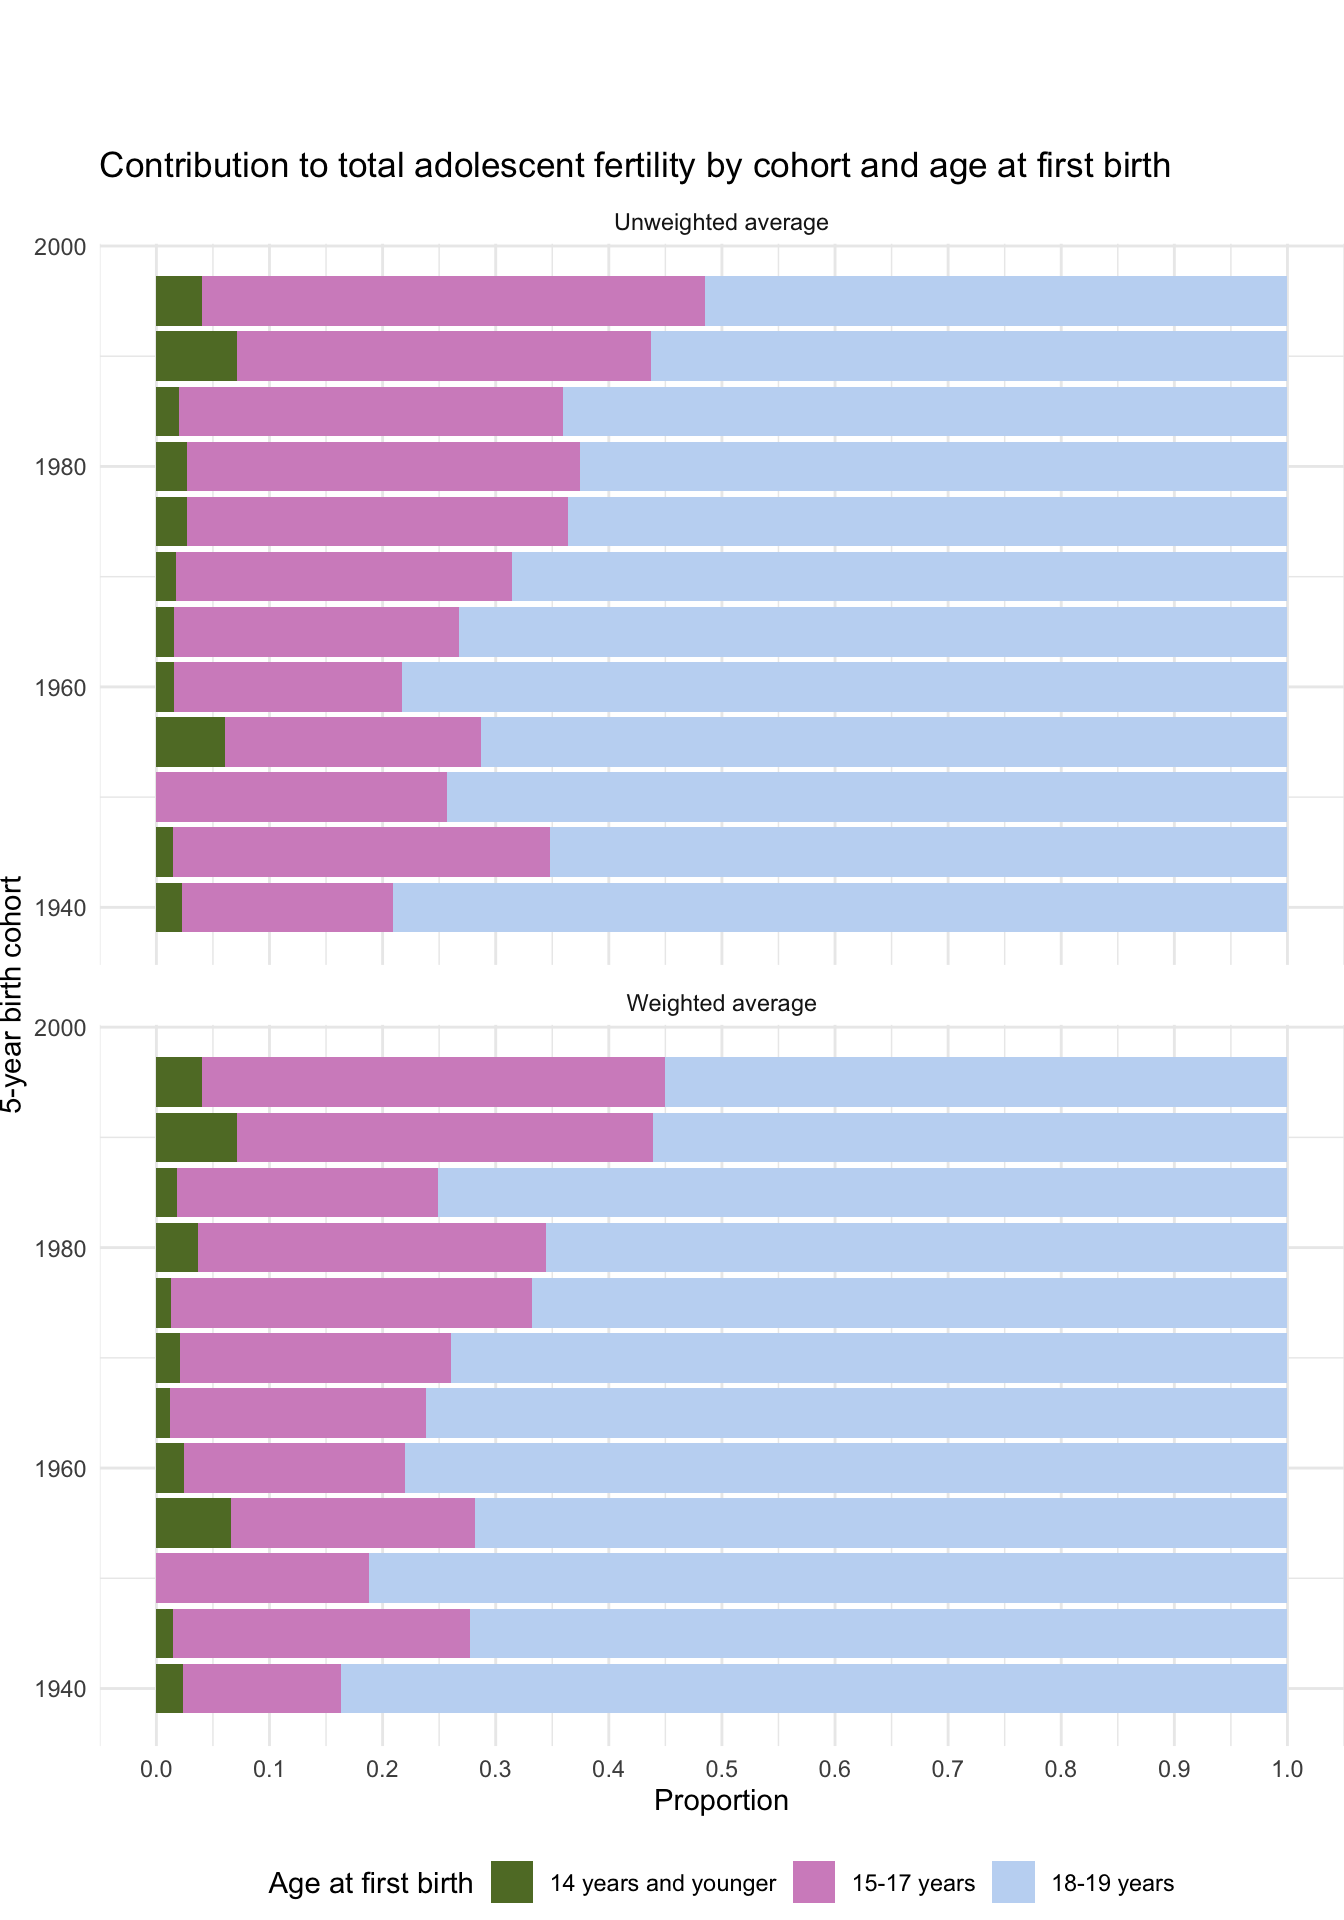
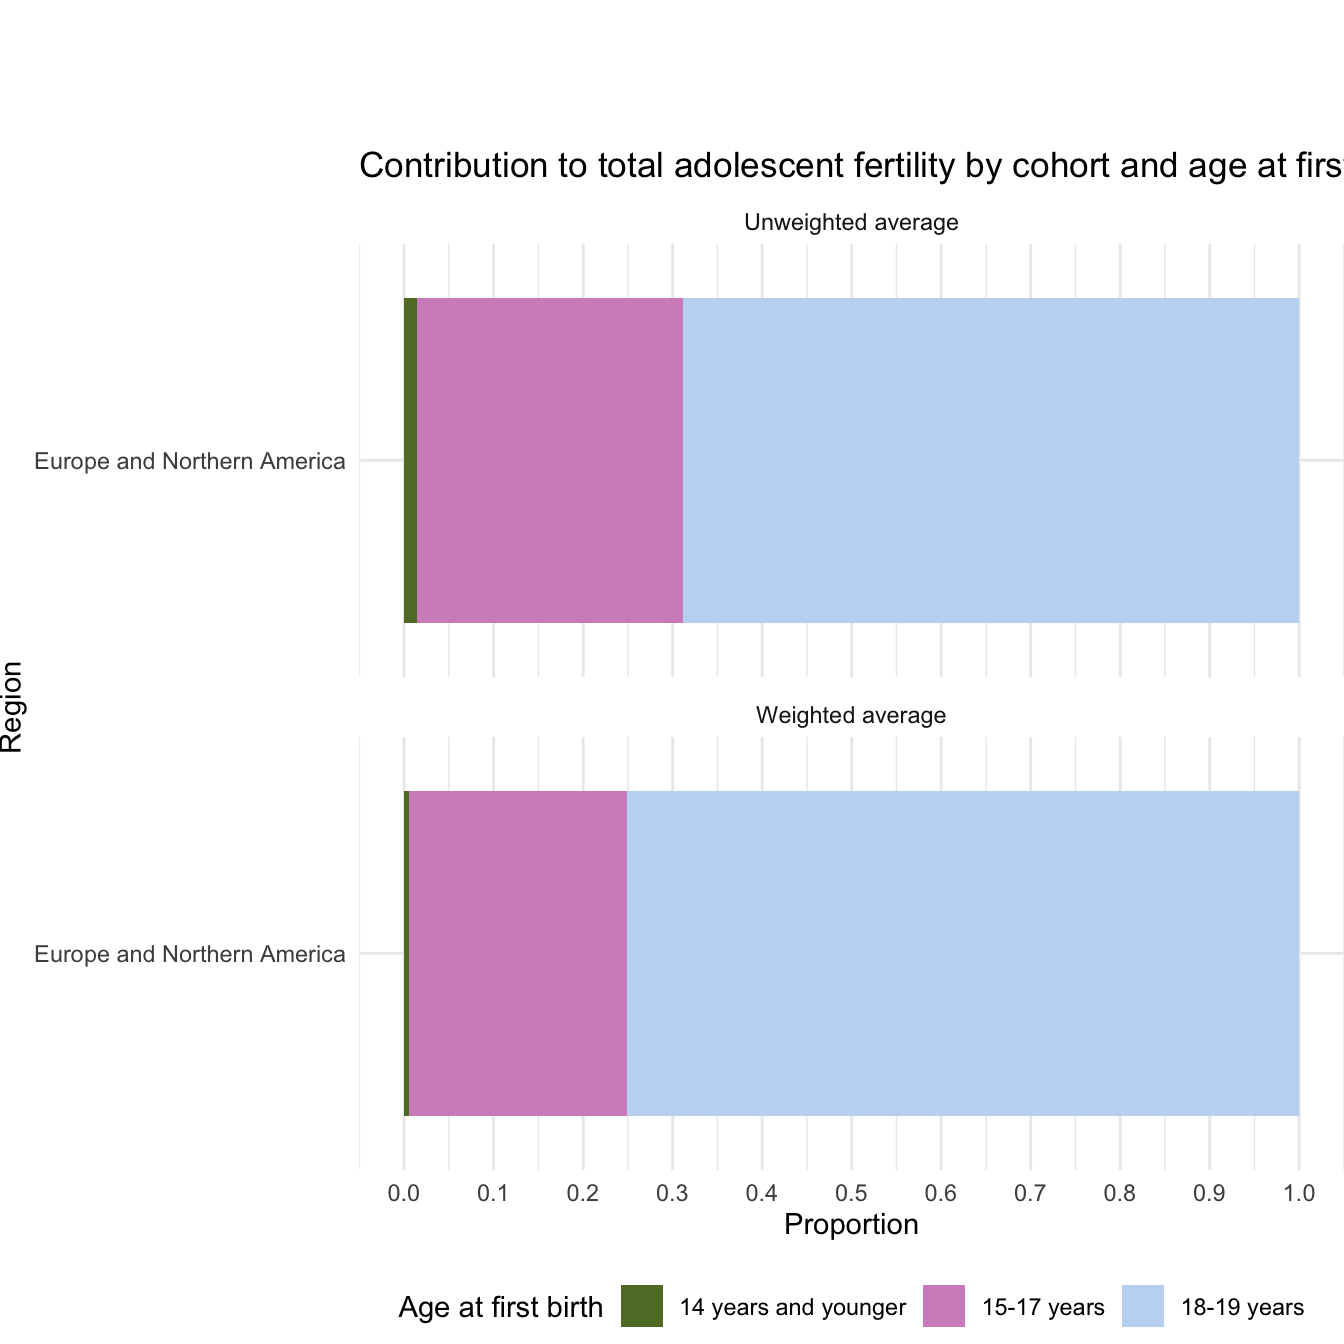
8.11.3 Contribution to total adolescent fertility by cohort and age at first birth
Region | 5-year birth cohort | Age at first birth | Unweighted average | Weighted average | |
---|---|---|---|---|---|
|
|
|
|
| |
1 | Europe and Northern America | 1940 | 14 years and younger | 0.02 | 0.02 |
2 | Europe and Northern America | 1940 | 15-17 years | 0.19 | 0.14 |
3 | Europe and Northern America | 1940 | 18-19 years | 0.79 | 0.84 |
4 | Europe and Northern America | 1945 | 14 years and younger | 0.02 | 0.01 |
5 | Europe and Northern America | 1945 | 15-17 years | 0.33 | 0.26 |
6 | Europe and Northern America | 1945 | 18-19 years | 0.65 | 0.72 |
7 | Europe and Northern America | 1950 | 15-17 years | 0.26 | 0.19 |
8 | Europe and Northern America | 1950 | 18-19 years | 0.74 | 0.81 |
9 | Europe and Northern America | 1955 | 14 years and younger | 0.06 | 0.07 |
10 | Europe and Northern America | 1955 | 15-17 years | 0.23 | 0.22 |
Showing 1 to 10 of 35 entries
8.11.4 Contribution to total adolescent fertility by age at first birth (all cohorts)
Region | Age at first birth | Unweighted average | Weighted average | |
---|---|---|---|---|
|
|
|
| |
1 | Europe and Northern America | 14 years and younger | 0.01 | 0.01 |
2 | Europe and Northern America | 15-17 years | 0.30 | 0.24 |
3 | Europe and Northern America | 18-19 years | 0.69 | 0.75 |
Showing 1 to 3 of 3 entries
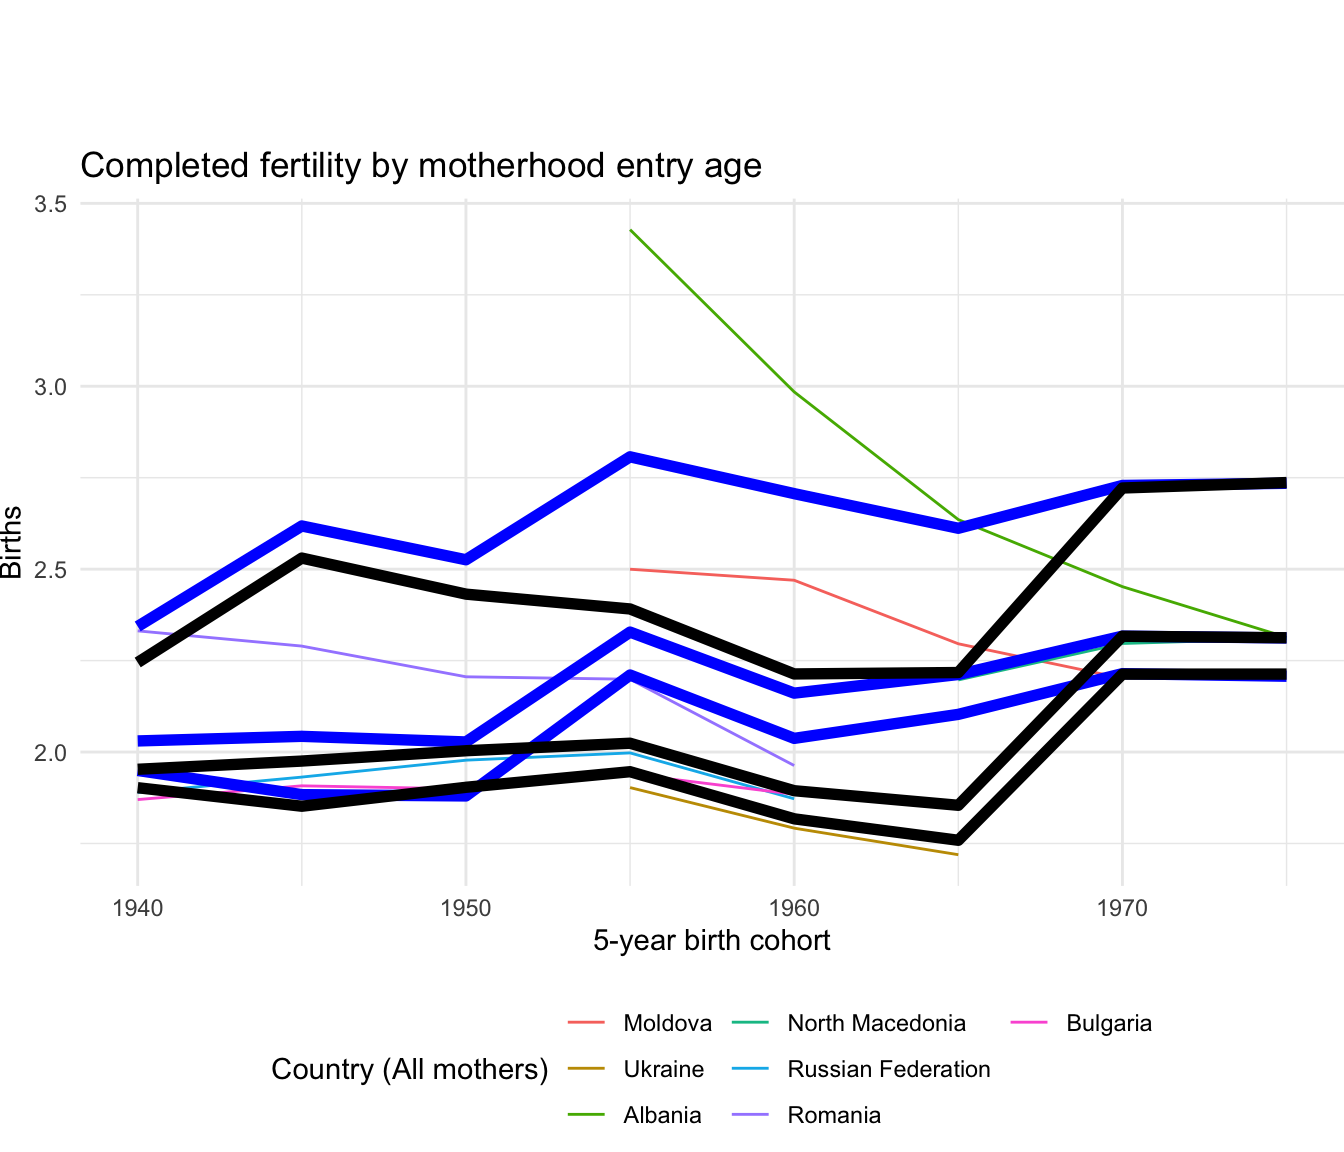
8.11.5 Completed fertility by motherhood entry age
Region | 5-year birth cohort | Age at first birth | Unweighted average | Weighted average | |
---|---|---|---|---|---|
|
|
|
|
| |
1 | Europe and Northern America | 1940 | All mothers | 2.03 | 1.95 |
2 | Europe and Northern America | 1940 | In adolescence | 2.34 | 2.24 |
3 | Europe and Northern America | 1940 | After adolescence | 1.95 | 1.90 |
4 | Europe and Northern America | 1945 | All mothers | 2.04 | 1.98 |
5 | Europe and Northern America | 1945 | In adolescence | 2.62 | 2.53 |
6 | Europe and Northern America | 1945 | After adolescence | 1.88 | 1.85 |
7 | Europe and Northern America | 1950 | All mothers | 2.03 | 2.00 |
8 | Europe and Northern America | 1950 | In adolescence | 2.53 | 2.43 |
9 | Europe and Northern America | 1950 | After adolescence | 1.88 | 1.90 |
10 | Europe and Northern America | 1955 | All mothers | 2.33 | 2.02 |
Showing 1 to 10 of 24 entries
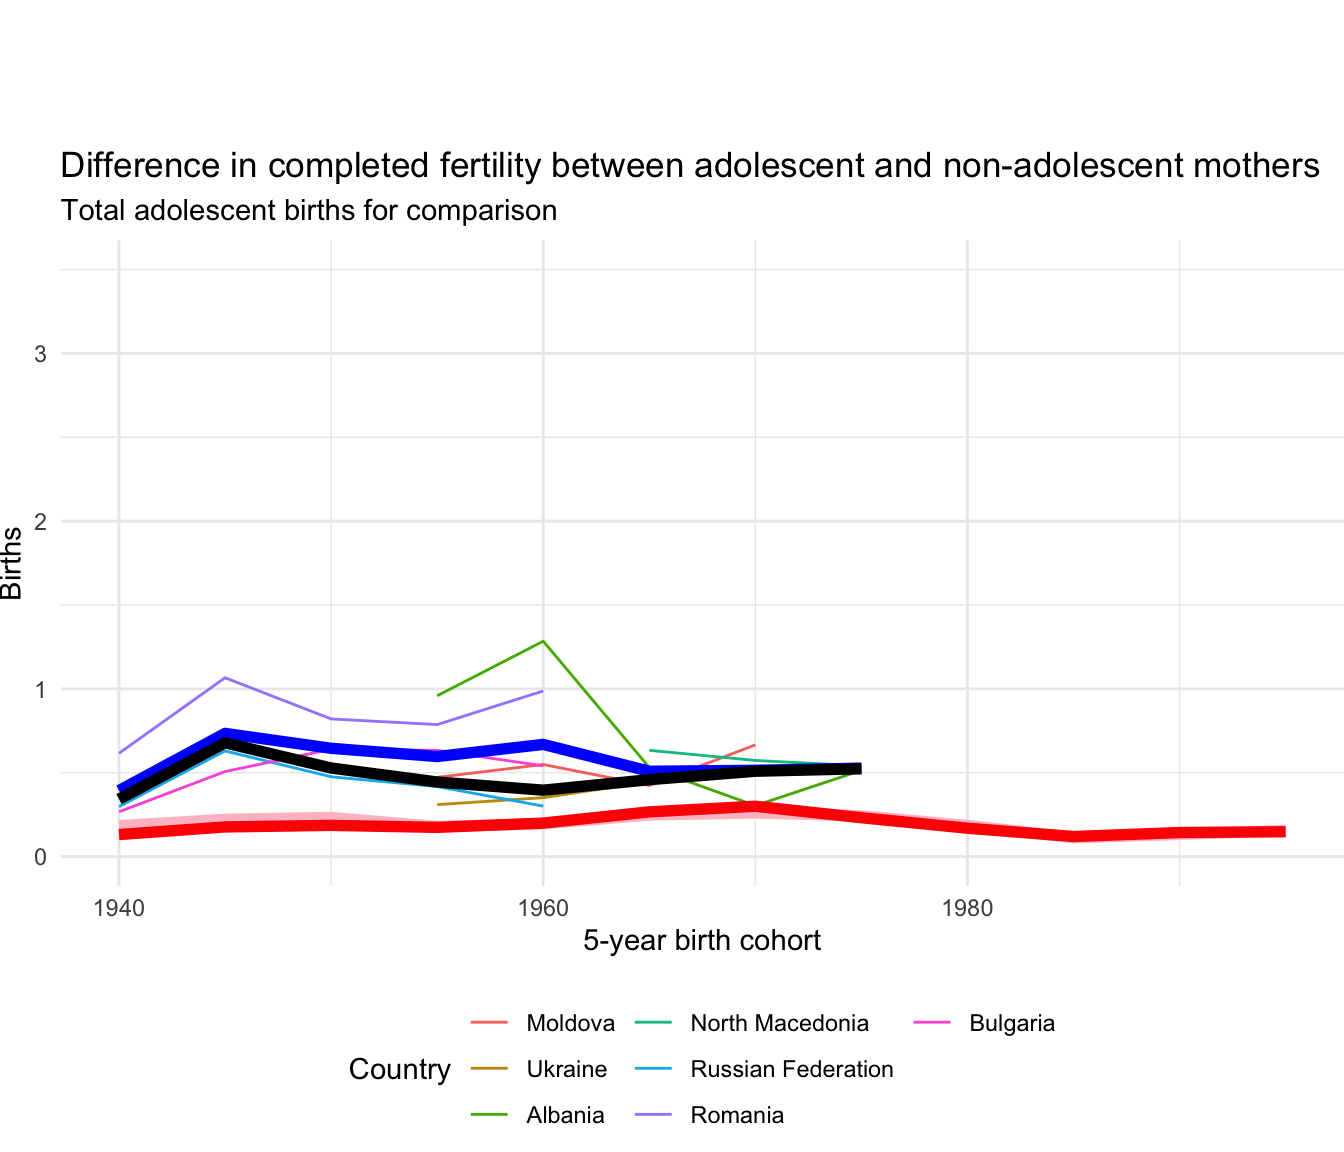
8.11.6 Difference in completed fertility between adolescent and non-adolescent mothers
Region | 5-year birth cohort | Unweighted average | Weighted average | |
---|---|---|---|---|
|
|
|
| |
1 | Europe and Northern America | 1940 | 0.39 | 0.34 |
2 | Europe and Northern America | 1945 | 0.73 | 0.68 |
3 | Europe and Northern America | 1950 | 0.65 | 0.53 |
4 | Europe and Northern America | 1955 | 0.60 | 0.44 |
5 | Europe and Northern America | 1960 | 0.67 | 0.40 |
6 | Europe and Northern America | 1965 | 0.51 | 0.46 |
7 | Europe and Northern America | 1970 | 0.51 | 0.51 |
8 | Europe and Northern America | 1975 | 0.53 | 0.52 |
Showing 1 to 8 of 8 entries
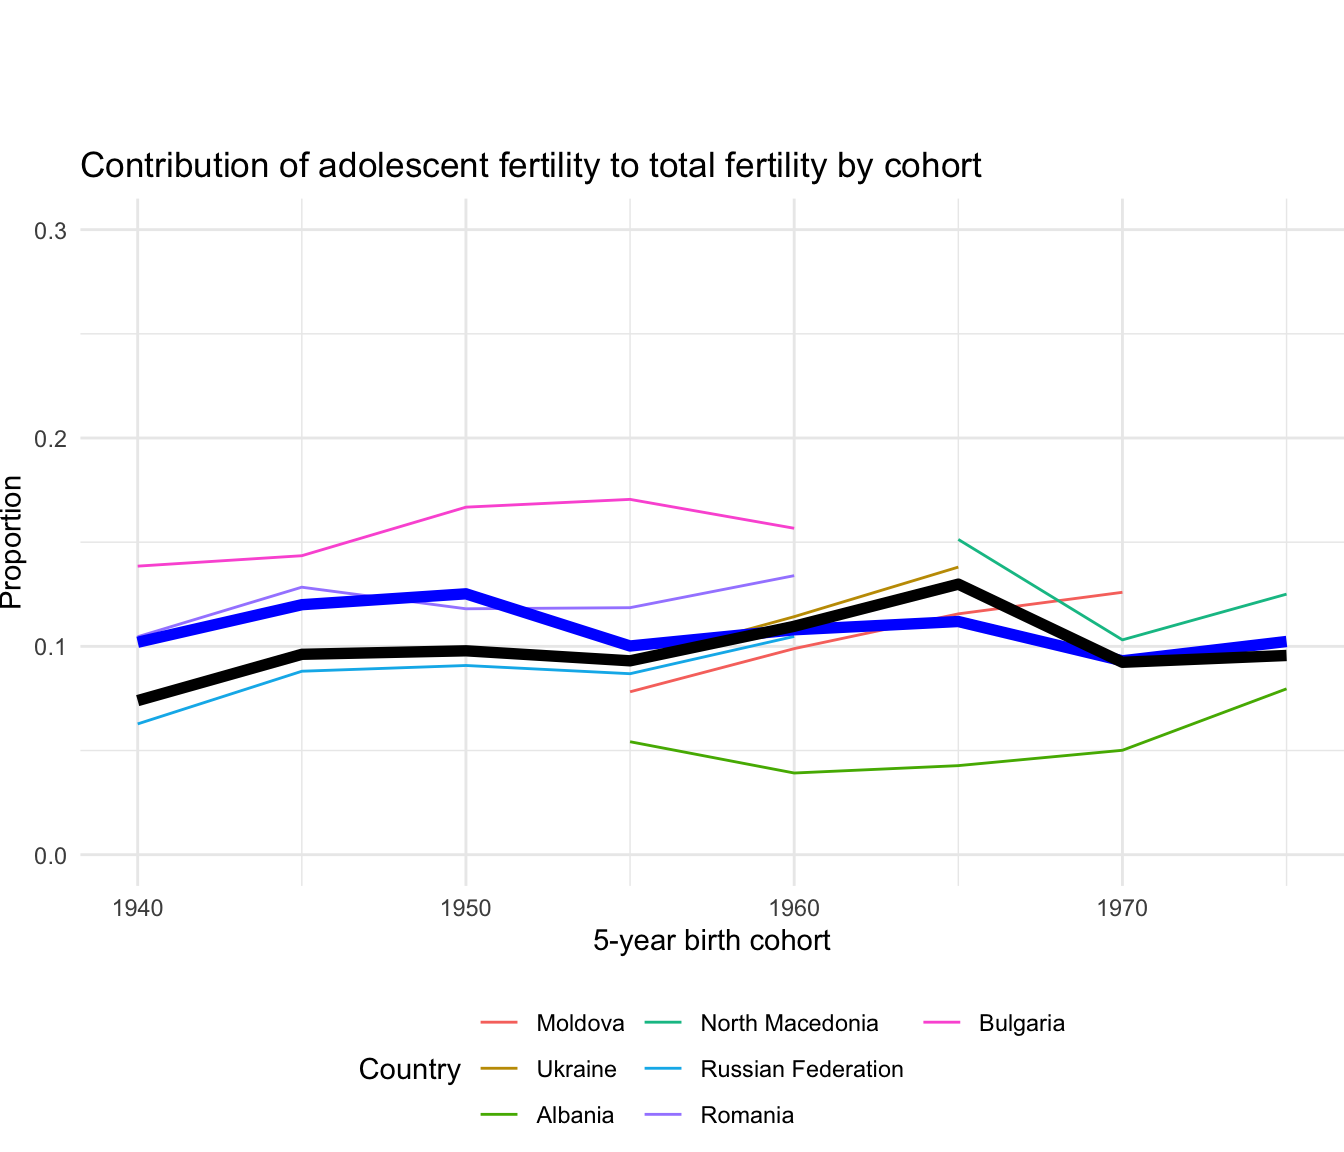
8.11.7 Contribution of adolescent fertility to total fertility by cohort
Region | 5-year birth cohort | Unweighted proportion | Weighted proportion | |
---|---|---|---|---|
|
|
|
| |
1 | Europe and Northern America | 1940 | 0.10 | 0.07 |
2 | Europe and Northern America | 1945 | 0.12 | 0.10 |
3 | Europe and Northern America | 1950 | 0.13 | 0.10 |
4 | Europe and Northern America | 1955 | 0.10 | 0.09 |
5 | Europe and Northern America | 1960 | 0.11 | 0.11 |
6 | Europe and Northern America | 1965 | 0.11 | 0.13 |
7 | Europe and Northern America | 1970 | 0.09 | 0.09 |
8 | Europe and Northern America | 1975 | 0.10 | 0.10 |
Showing 1 to 8 of 8 entries
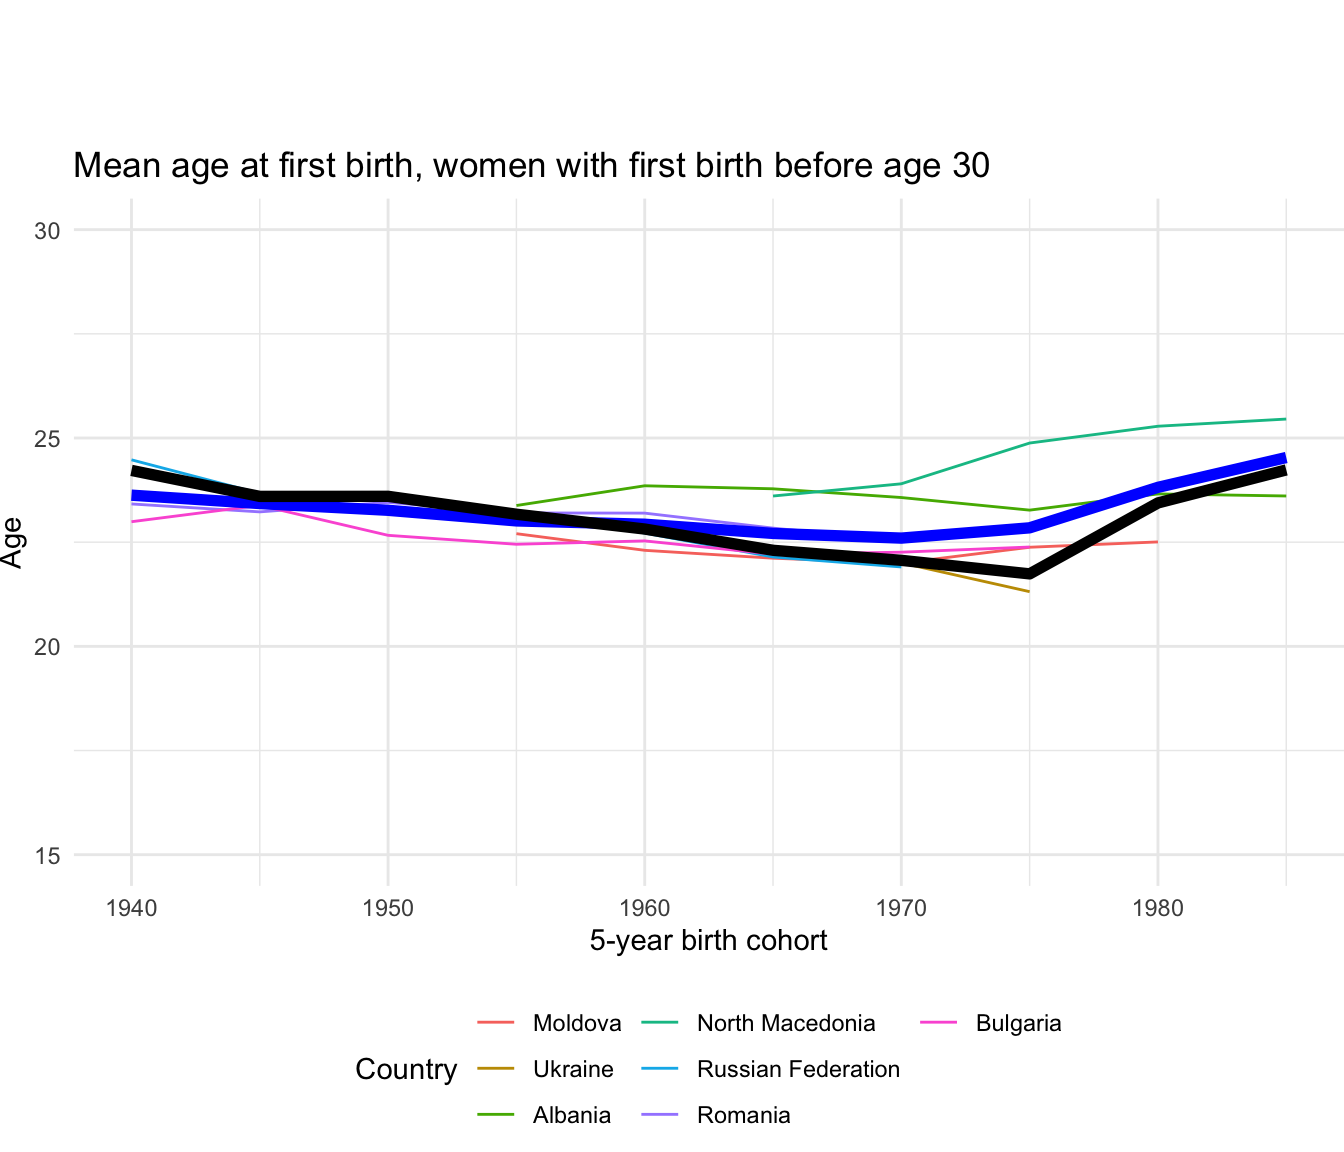
8.11.8 Mean age at first birth
Region | 5-year birth cohort | Unweighted average | Weighted average | |
---|---|---|---|---|
|
|
|
| |
1 | Europe and Northern America | 1940 | 23.6 | 24.2 |
2 | Europe and Northern America | 1945 | 23.4 | 23.6 |
3 | Europe and Northern America | 1950 | 23.3 | 23.6 |
4 | Europe and Northern America | 1955 | 23.0 | 23.2 |
5 | Europe and Northern America | 1960 | 22.9 | 22.8 |
6 | Europe and Northern America | 1965 | 22.7 | 22.3 |
7 | Europe and Northern America | 1970 | 22.6 | 22.1 |
8 | Europe and Northern America | 1975 | 22.8 | 21.7 |
9 | Europe and Northern America | 1980 | 23.8 | 23.4 |
10 | Europe and Northern America | 1985 | 24.5 | 24.2 |
Showing 1 to 10 of 10 entries
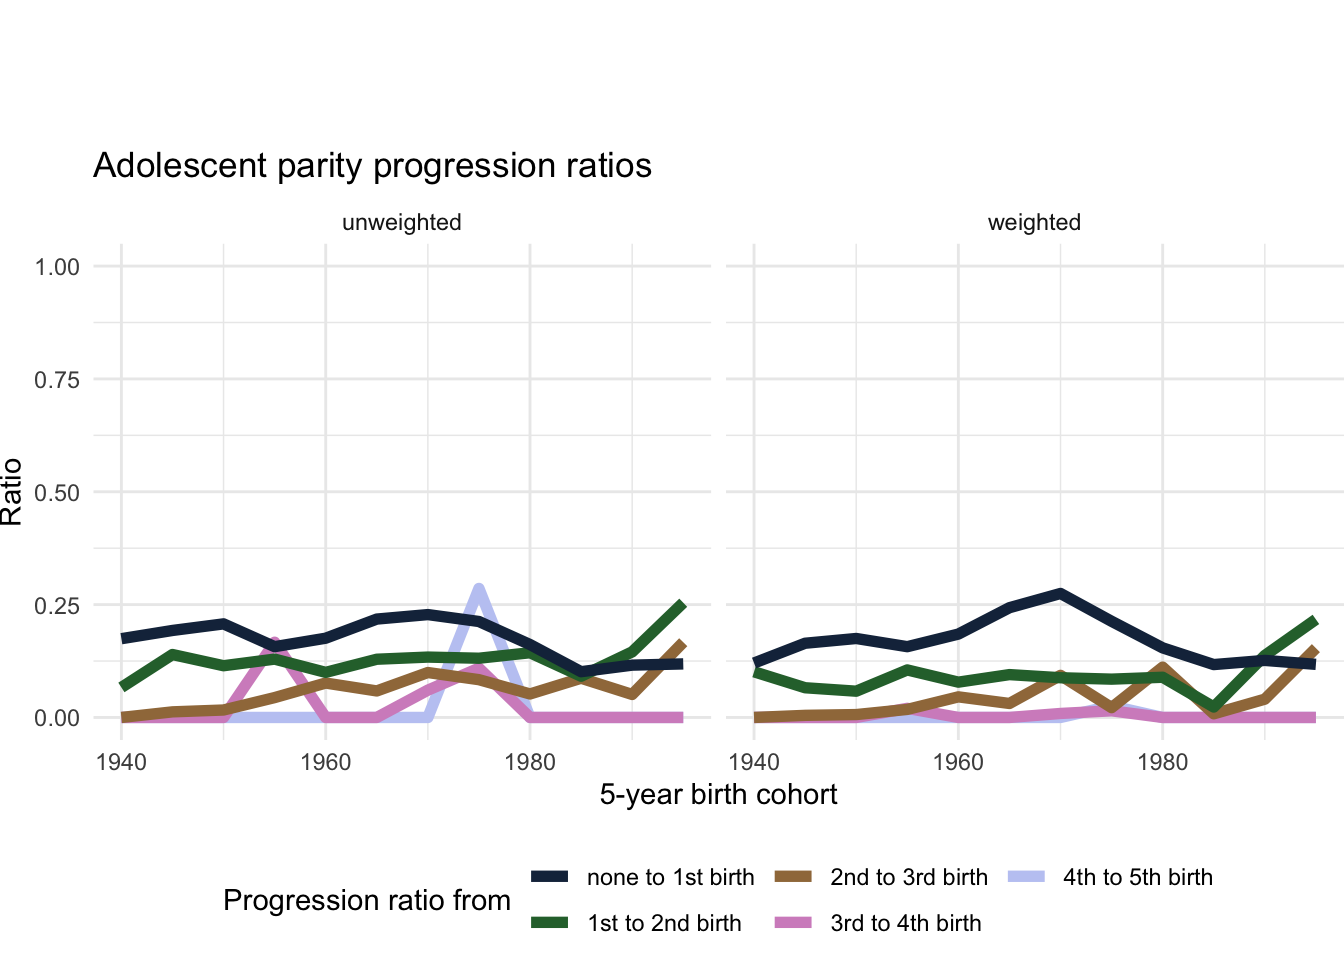
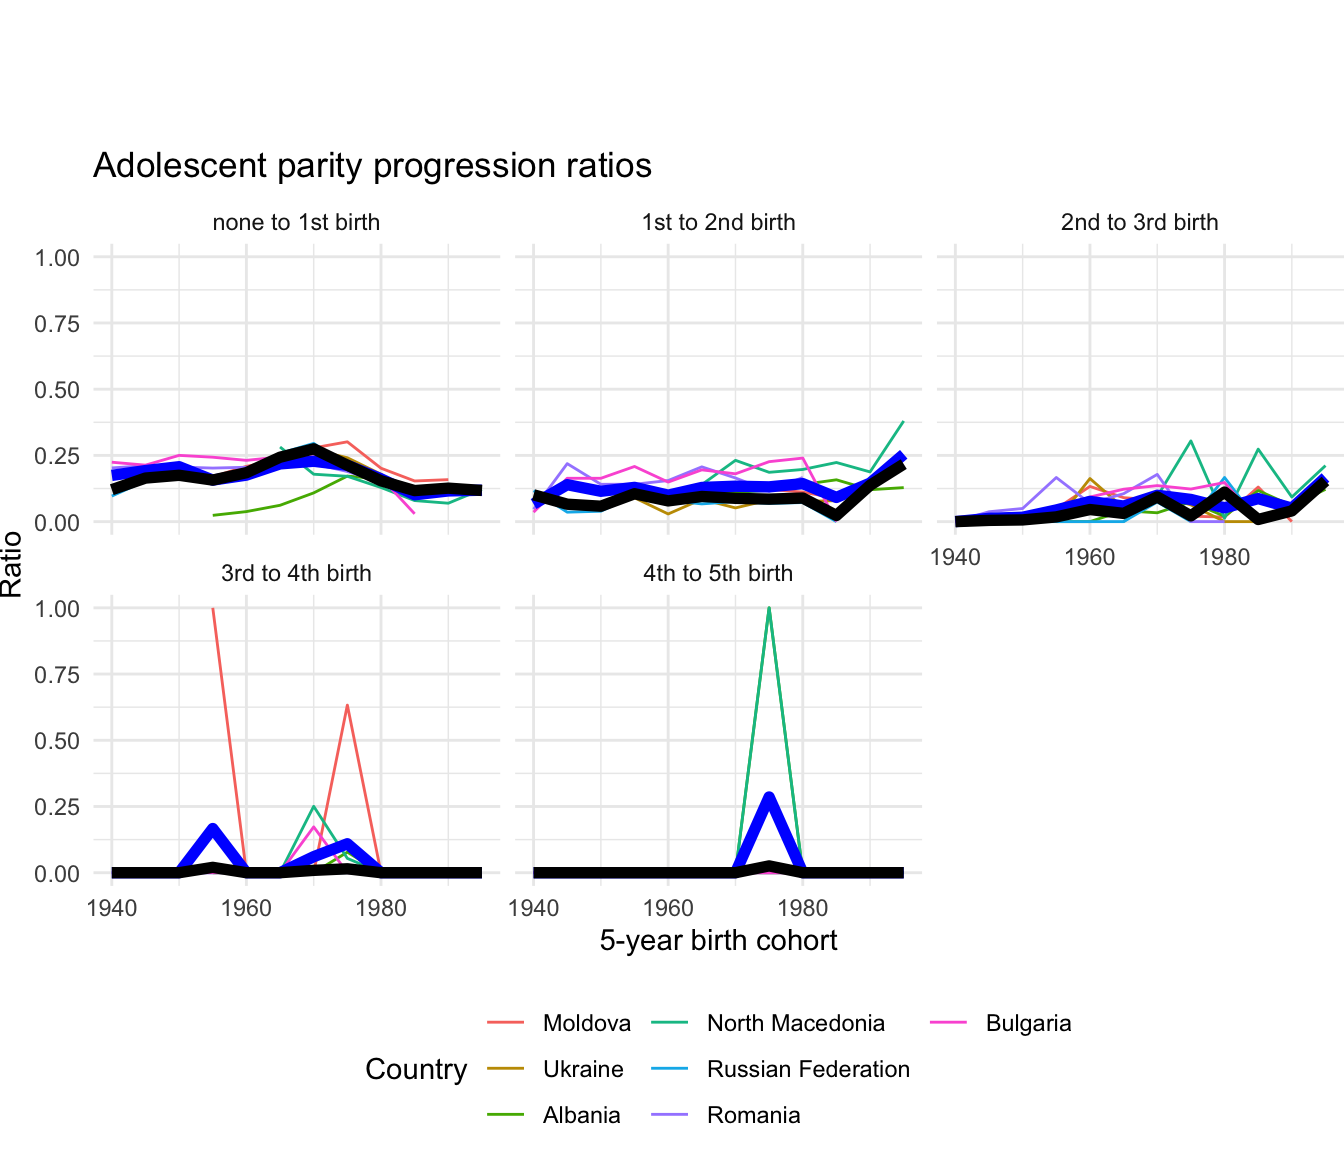
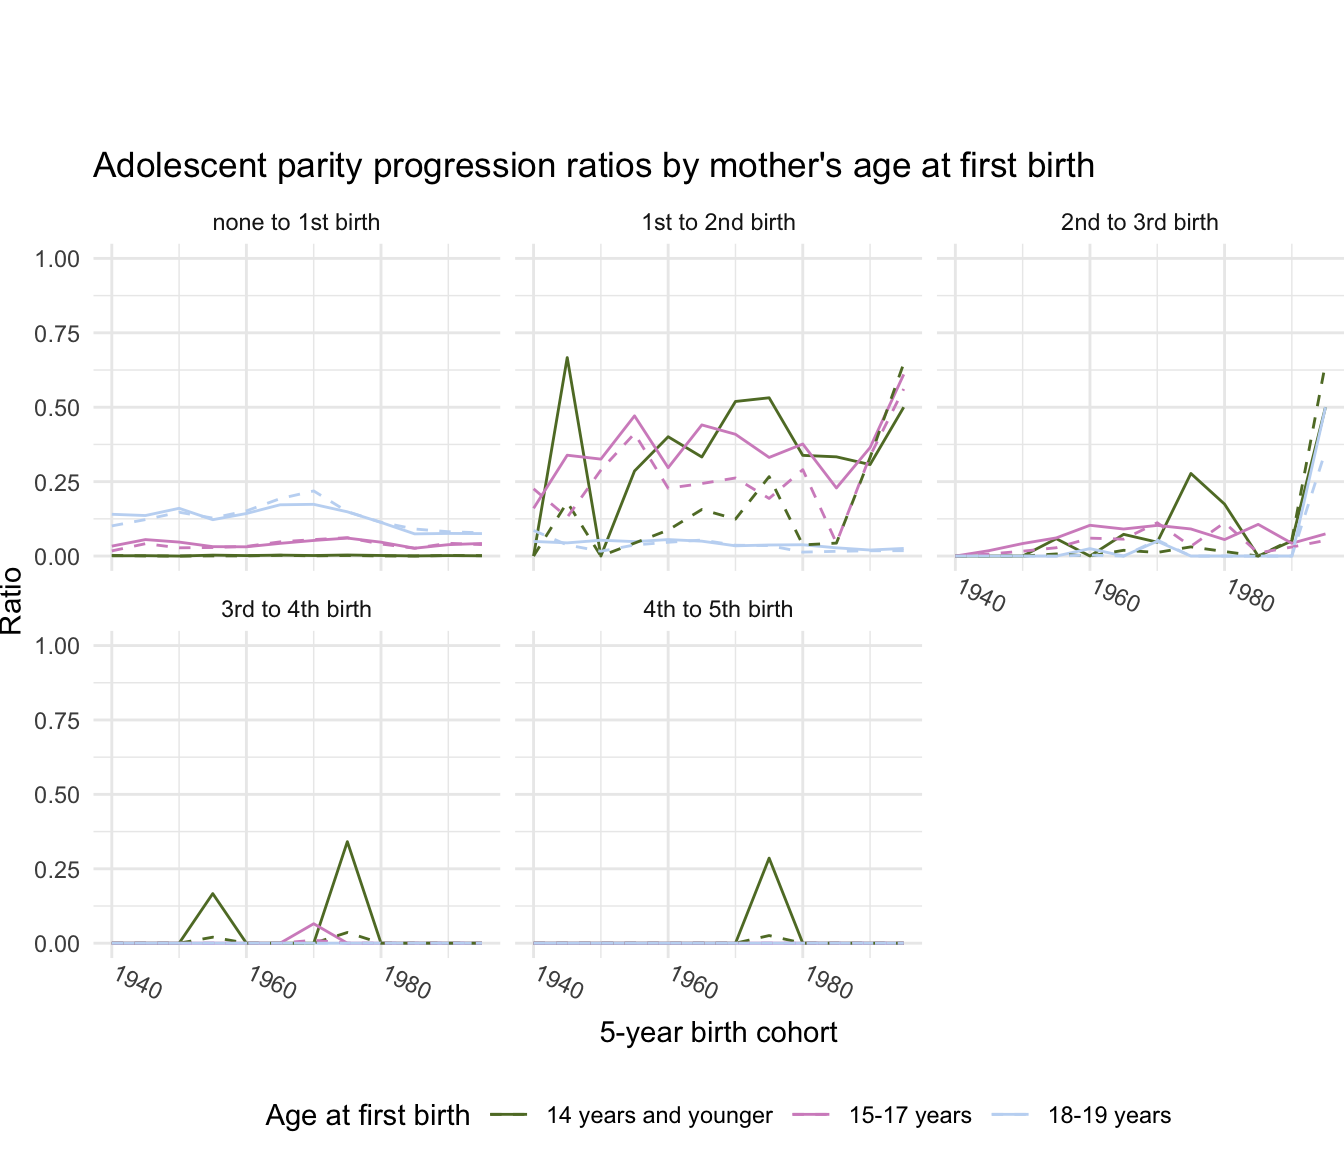
8.11.9 Adolescent parity progression ratios
Region | 5-year birth cohort | Progression ratio from | Unweighted average | Weighted average | |
---|---|---|---|---|---|
|
|
|
|
| |
1 | Europe and Northern America | 1940 | 4th to 5th birth | 0.00 | 0.00 |
2 | Europe and Northern America | 1940 | 3rd to 4th birth | 0.00 | 0.00 |
3 | Europe and Northern America | 1940 | 2nd to 3rd birth | 0.00 | 0.00 |
4 | Europe and Northern America | 1940 | 1st to 2nd birth | 0.07 | 0.10 |
5 | Europe and Northern America | 1940 | none to 1st birth | 0.17 | 0.12 |
6 | Europe and Northern America | 1945 | 4th to 5th birth | 0.00 | 0.00 |
7 | Europe and Northern America | 1945 | 3rd to 4th birth | 0.00 | 0.00 |
8 | Europe and Northern America | 1945 | 2nd to 3rd birth | 0.01 | 0.00 |
9 | Europe and Northern America | 1945 | 1st to 2nd birth | 0.14 | 0.07 |
10 | Europe and Northern America | 1945 | none to 1st birth | 0.19 | 0.16 |
Showing 1 to 10 of 60 entries
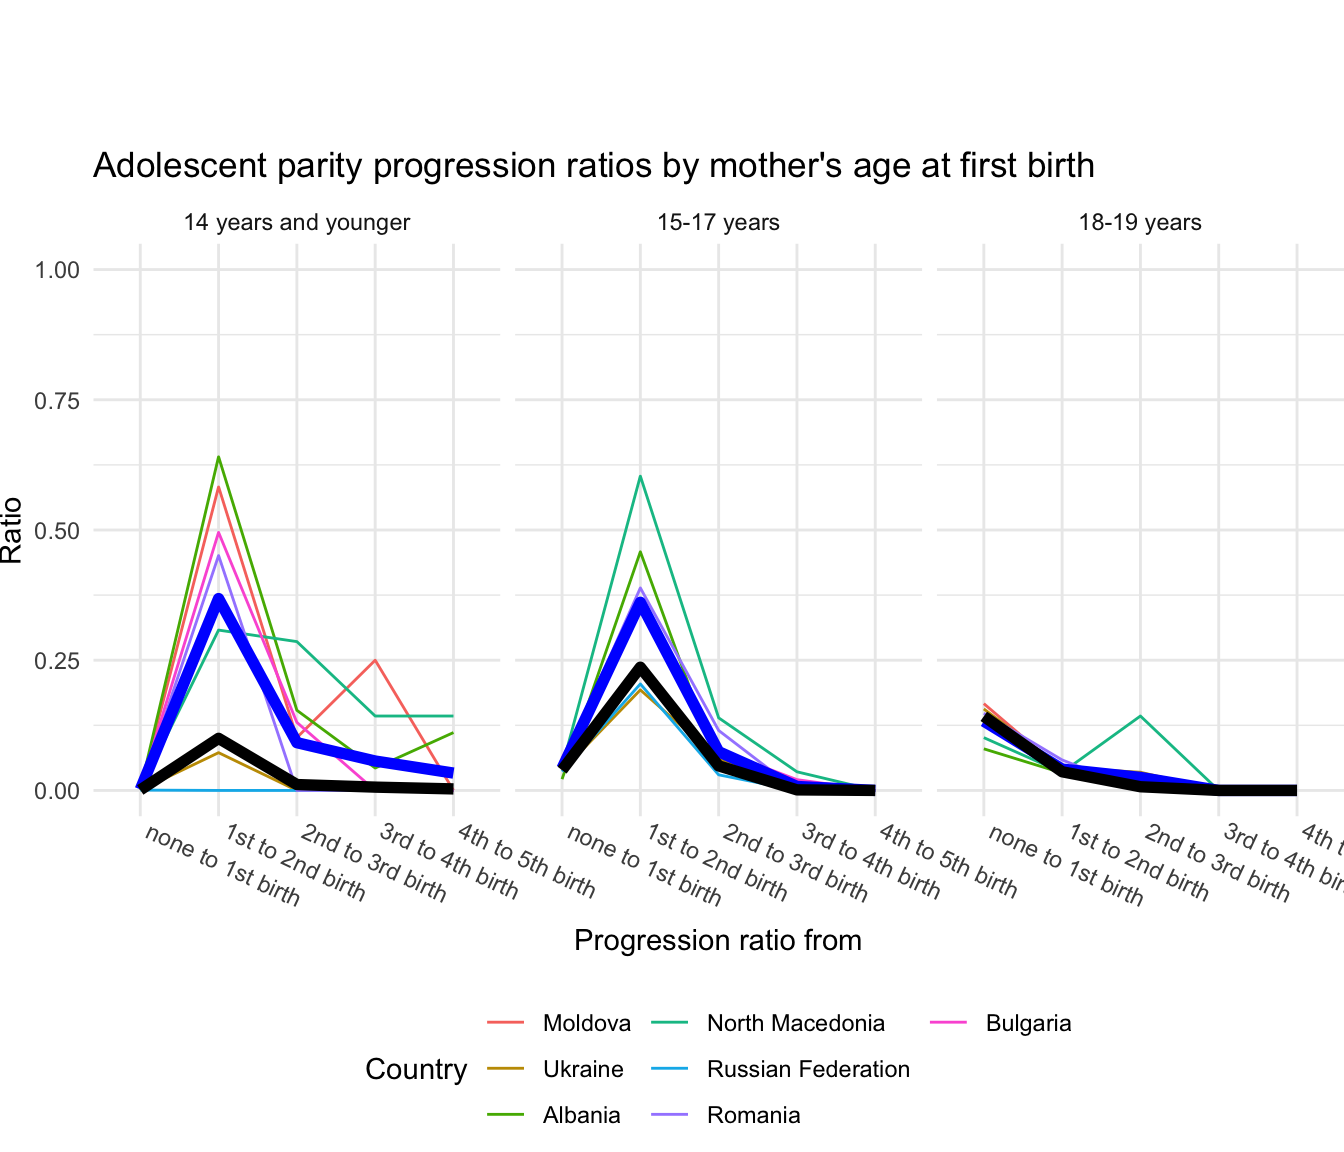
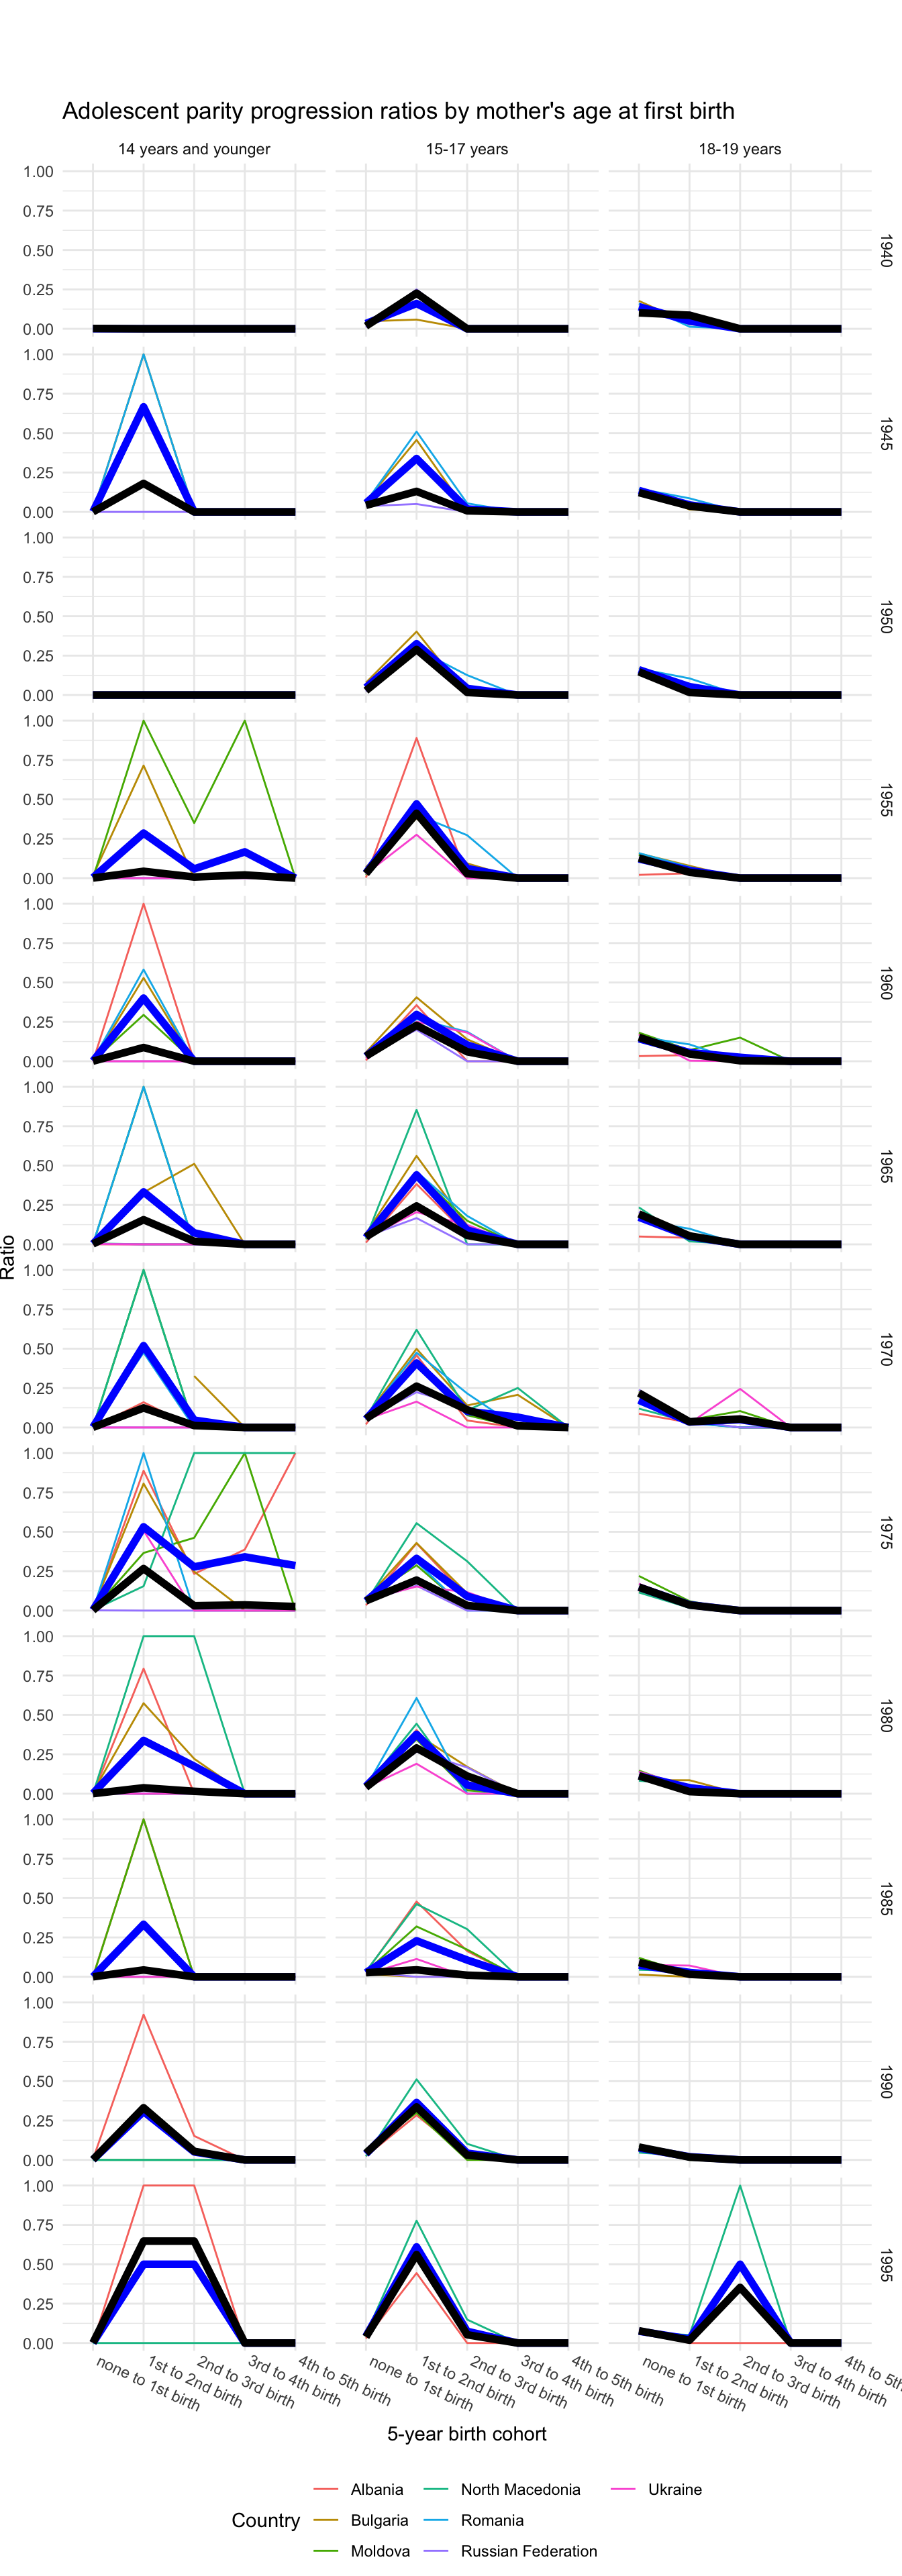
8.11.10 Adolescent parity progression ratios by age (all cohorts)
Do individual cohorts?
Region | Age at first birth | Progression ratio from | Unweighted average | Weighted average | |
---|---|---|---|---|---|
|
|
|
|
| |
1 | Europe and Northern America | 14 years and younger | none to 1st birth | 0.00 | 0.00 |
2 | Europe and Northern America | 15-17 years | none to 1st birth | 0.04 | 0.04 |
3 | Europe and Northern America | 18-19 years | none to 1st birth | 0.13 | 0.14 |
4 | Europe and Northern America | 14 years and younger | 1st to 2nd birth | 0.37 | 0.10 |
5 | Europe and Northern America | 15-17 years | 1st to 2nd birth | 0.36 | 0.24 |
6 | Europe and Northern America | 18-19 years | 1st to 2nd birth | 0.04 | 0.04 |
7 | Europe and Northern America | 14 years and younger | 2nd to 3rd birth | 0.09 | 0.01 |
8 | Europe and Northern America | 15-17 years | 2nd to 3rd birth | 0.07 | 0.05 |
9 | Europe and Northern America | 18-19 years | 2nd to 3rd birth | 0.02 | 0.01 |
10 | Europe and Northern America | 14 years and younger | 3rd to 4th birth | 0.06 | 0.01 |
Showing 1 to 10 of 15 entries
Region | Age at first birth | 5-yr birth cohort | Progression ratio from | Unweighted average | Weighted average | |
---|---|---|---|---|---|---|
|
|
|
|
|
| |
1 | Europe and Northern America | 14 years and younger | 1940 | none to 1st birth | 0.00 | 0.00 |
2 | Europe and Northern America | 15-17 years | 1940 | none to 1st birth | 0.03 | 0.02 |
3 | Europe and Northern America | 18-19 years | 1940 | none to 1st birth | 0.14 | 0.10 |
4 | Europe and Northern America | 14 years and younger | 1940 | 1st to 2nd birth | 0.00 | 0.00 |
5 | Europe and Northern America | 15-17 years | 1940 | 1st to 2nd birth | 0.16 | 0.23 |
6 | Europe and Northern America | 18-19 years | 1940 | 1st to 2nd birth | 0.05 | 0.09 |
7 | Europe and Northern America | 14 years and younger | 1940 | 2nd to 3rd birth | 0.00 | 0.00 |
8 | Europe and Northern America | 15-17 years | 1940 | 2nd to 3rd birth | 0.00 | 0.00 |
9 | Europe and Northern America | 18-19 years | 1940 | 2nd to 3rd birth | 0.00 | 0.00 |
10 | Europe and Northern America | 14 years and younger | 1940 | 3rd to 4th birth | 0.00 | 0.00 |
Showing 1 to 10 of 180 entries
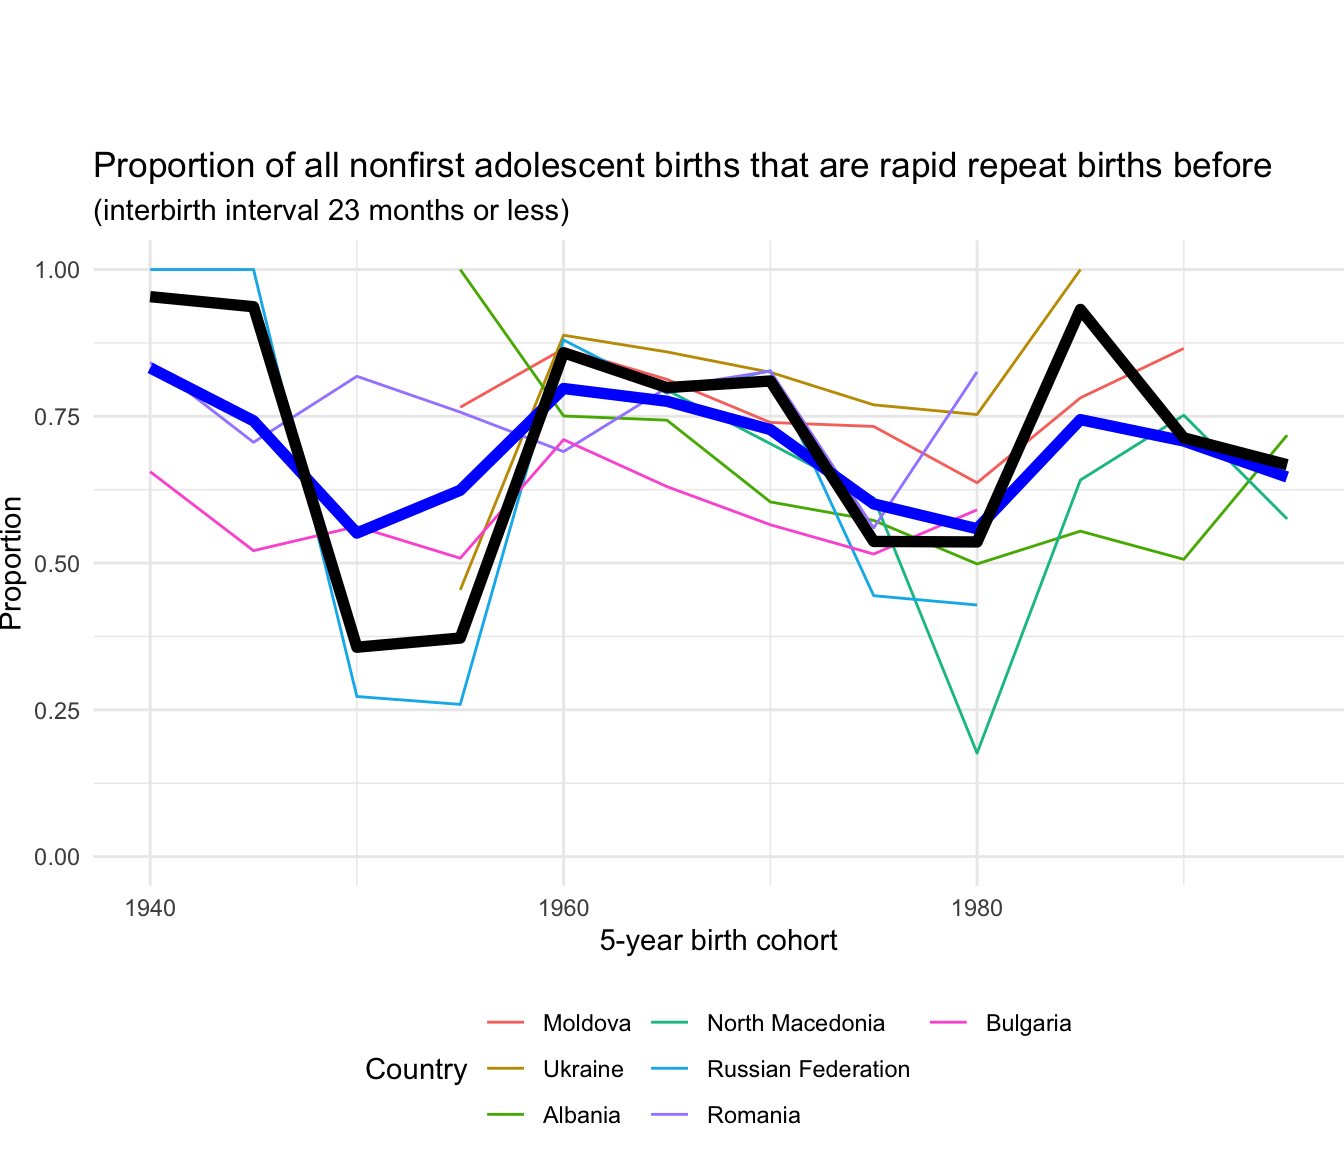
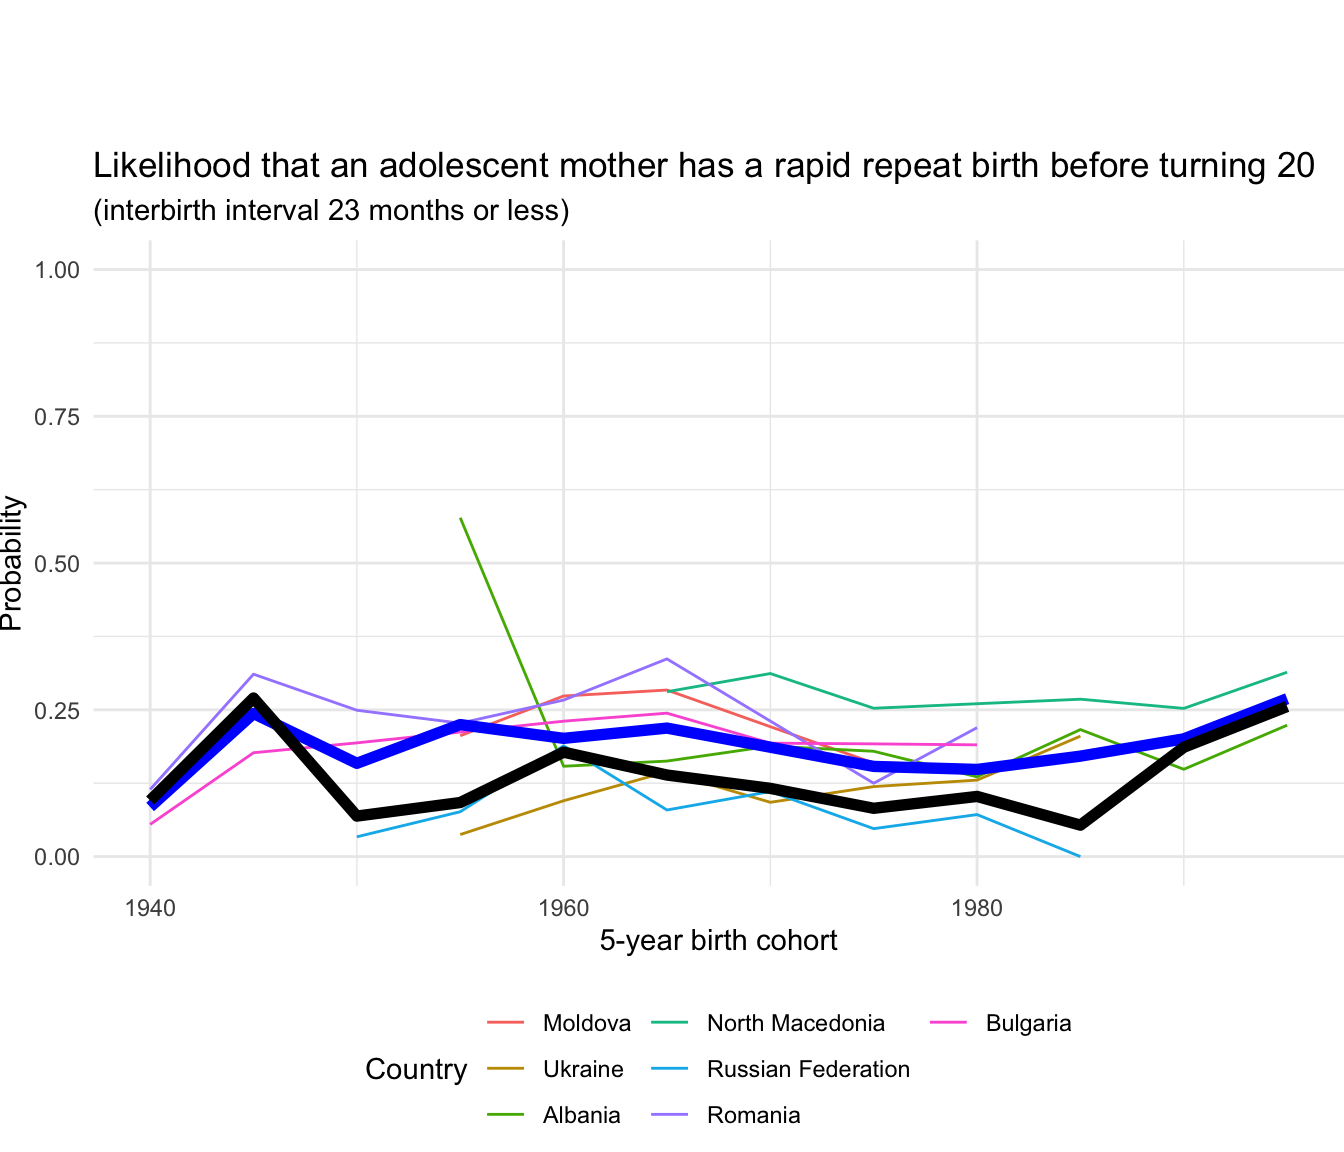
8.11.11 Rapid Repeat Birth probability
Region | 5-year birth cohort | Unweighted average | Weighted average | |
---|---|---|---|---|
|
|
|
| |
1 | Europe and Northern America | 1940 | 0.08 | 0.10 |
2 | Europe and Northern America | 1945 | 0.24 | 0.27 |
3 | Europe and Northern America | 1950 | 0.16 | 0.07 |
4 | Europe and Northern America | 1955 | 0.22 | 0.09 |
5 | Europe and Northern America | 1960 | 0.20 | 0.18 |
6 | Europe and Northern America | 1965 | 0.22 | 0.14 |
7 | Europe and Northern America | 1970 | 0.19 | 0.12 |
8 | Europe and Northern America | 1975 | 0.15 | 0.08 |
9 | Europe and Northern America | 1980 | 0.15 | 0.10 |
10 | Europe and Northern America | 1985 | 0.17 | 0.05 |
Showing 1 to 10 of 12 entries
8.11.12 Rapid Repeat Birth proportion
Region | 5-year birth cohort | Unweighted average | Weighted average | |
---|---|---|---|---|
|
|
|
| |
1 | Europe and Northern America | 1940 | 0.83 | 0.95 |
2 | Europe and Northern America | 1945 | 0.74 | 0.94 |
3 | Europe and Northern America | 1950 | 0.55 | 0.36 |
4 | Europe and Northern America | 1955 | 0.62 | 0.37 |
5 | Europe and Northern America | 1960 | 0.80 | 0.86 |
6 | Europe and Northern America | 1965 | 0.78 | 0.80 |
7 | Europe and Northern America | 1970 | 0.73 | 0.81 |
8 | Europe and Northern America | 1975 | 0.60 | 0.54 |
9 | Europe and Northern America | 1980 | 0.56 | 0.54 |
10 | Europe and Northern America | 1985 | 0.74 | 0.93 |
Showing 1 to 10 of 12 entries