25.4 Comparing odds: Confidence intervals
As noted, we rely on software to find the CI for the odds ratio, such as jamovi (Fig. 25.2) and the second table of the SPSS output (labelled Risk Estimate; Fig. 25.3). Both show that the sample OR is 5.94, and the (exact) 95% CI is from 1.35 to 26.1. (The SPSS output shows other information too, some of which will be useful later.)
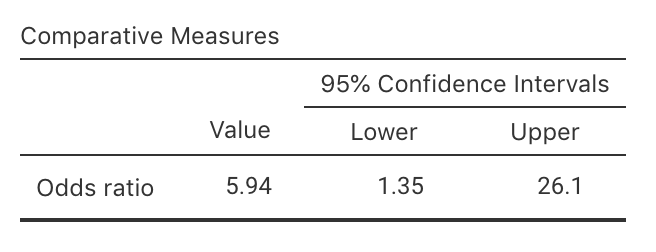
FIGURE 25.2: The jamovi output for computing a CI
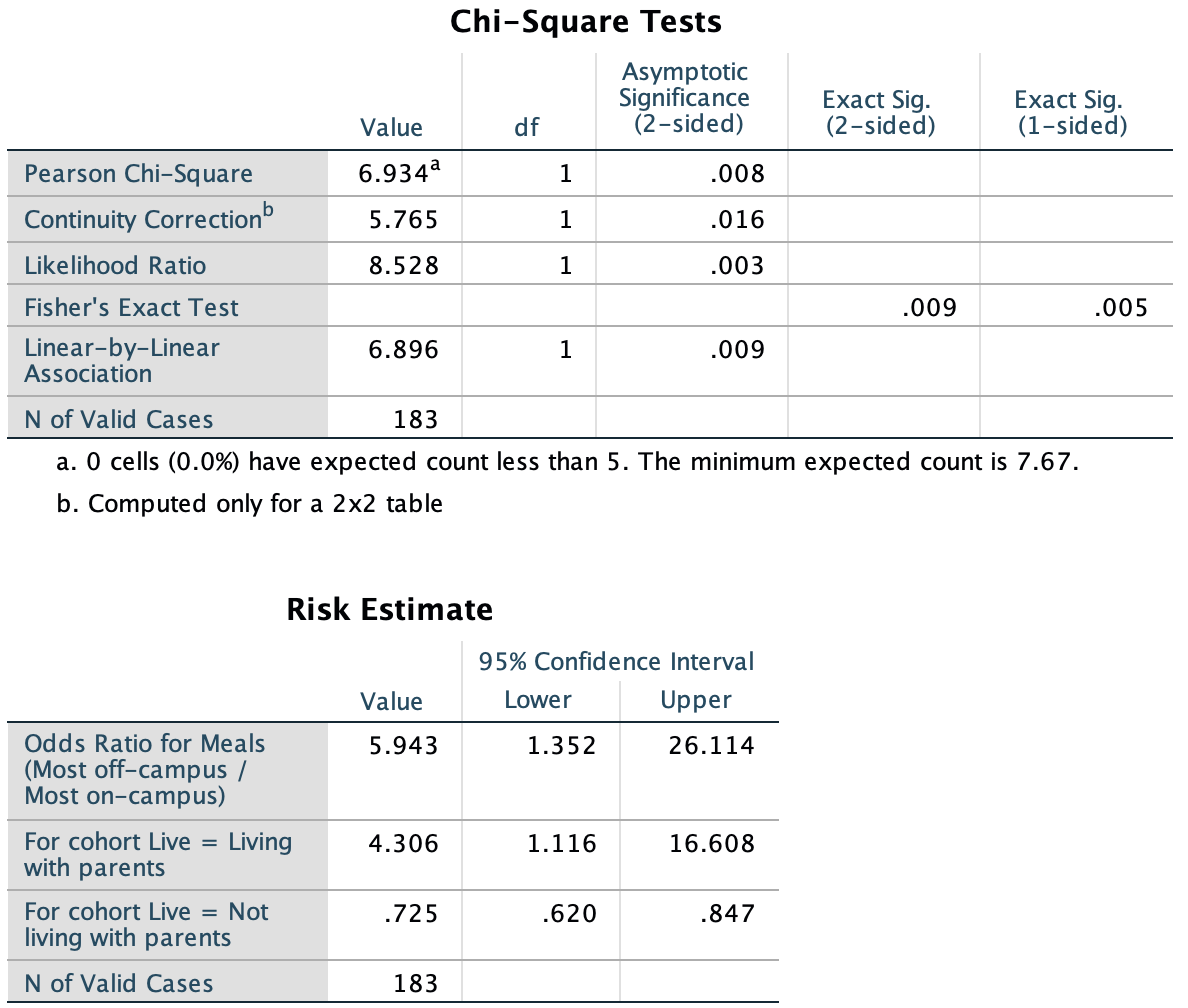
FIGURE 25.3: The SPSS output for computing a CI
Recall that jamovi and SPSS compute the odds ratio as either
- ‘Row 1 to Row 2, comparing Column 1 to Column 2,’ or
- ‘Column 1 to Column 2, comparing Row 1 to Row 2.’
We write:
Based on the sample, a 95% CI for the OR comparing the odds of eating most meals off-campus is from 1.35 to 26.1 (living with parents, compared to not living with parents).
This means there is a 95% chance that this CI straddles the population OR.
Notice that the meaning of the OR is explained in the conclusions: the odds of eating most meals off-campus, and comparing students living with parents to not living with parents.
The CI for an OR is not symmetrical, like the others we have seen9.
Example 25.1 (Crashes in China) A study of car crashes in a rural, mountainous county in western China (Wang et al. 2020) recorded the data in the table below.
| Type of crash | 2011 | 2015 |
|---|---|---|
| Involving pedestrians | 15 | 37 |
| Involving vehicles | 35 | 85 |
Clearly the number of crashes is larger in 2015. However, the interest is in comparing the odds (or percentage) of crashes involving pedestrians in 2011 and 2015. (Of course, comparing the odds (or percentages) involving vehicles is also possible.)
The data can be summarised as shown below.
| Year | Percentage involving pedestrians | Odds involving pedestrians | Sample size |
|---|---|---|---|
| In 2011 | 30.0 | 0.429 | 50 |
| In 2015 | 30.3 | 0.435 | 122 |
| Odds ratio: | 0.985 |
In this table, the odds are the odds that a crash involves a pedestrian.
The odds ratio is the odds of a crash involving pedestrians in 2011, compared to the odds of a crash involving pedestrians in 2015. In this situation, this is the parameter of interest.
Both the percentage and odds columns, and the odds ratio, suggest that the relative proportion of crashes involving pedestrians is very similar in 2011 and 2015.
The odds ratio is 0.986, but this value would change from sample to sample. From software, the 95% CI for the odds ratio is from 0.480 to 2.018. We would write
The population odds ratio for a crash involving pedestrians (comparing 2011 to 2015) has a 95% chance of being between 0.480 and 2.018.
References
This is because the OR has no upper limit, but the lower limit is zero. (The logarithm of the limits of the CI form a symmetric interval.)↩︎