31.12 Quick review questions

A study (Egbue et al. 2017) of the adoption of electric vehicle (EVs) by a certain group of professional Americans (Example 5.14) compiled the data in Table 31.11. Output from using jamovi is shown in Fig. 31.12.
| Yes | No | |
|---|---|---|
| No post-grad | 24 | 8 |
| Post-grad study | 51 | 29 |
- The \(\chi^2\) value is:
- The approximately-equivalent \(z\)-score (to two decimal places) is:
- Using the 68–95–99.5 rule, the \(P\)-value is:
- From the software output, the \(P\)-value is:
- The alternative hypothesis will be:
- True or false:
There is no evidence of a difference
in the odds of buying a car in the next 10 years,
between those with and without post-graduate study.
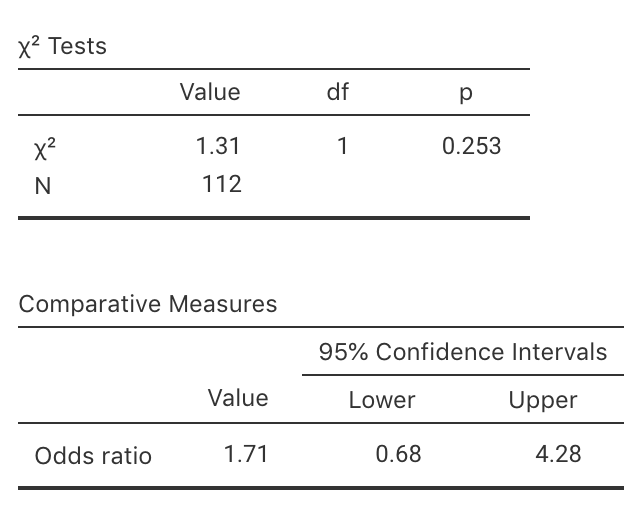
FIGURE 31.12: jamovi output for the EV study
References
Egbue O, Long S, Samaranayake VA. Mass deployment of sustainable transportation: Evaluation of factors that influence electric vehicle adoption. Clean Technologies and Environmental Policy. Springer; 2017;19(7):1927–39.