25.8 Quick review questions
A study (Egbue et al. 2017) of the adoption of electric vehicle (EVs) by a certain group of professional Americans (Example 5.14) compiled the data in Table 25.7. Output from using jamovi is shown in Fig. 25.11.
| Yes | No | |
|---|---|---|
| No post-grad | 24 | 8 |
| Post-grad study | 51 | 29 |
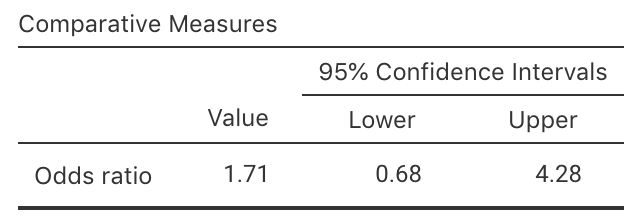
FIGURE 25.11: jamovi output for the EV study
- The percentage of people without post-grad study
who would buy an EV in the next 10 years is
(do not add the percentage symbol):
- The odds that a person without post-grad study
would buy an EV in the next 10 years is:
- Using the output, what is the OR of buying an electric vehicle in the next 10 years,
comparing those without post-grad study to those with post-grad study?
- True or false: The CI means that the sample OR is likely to be between 0.68 and 4.28.
- True or false: The analysis is likely to be statistically valid?
- The number without post-grad study: \(24+8 = 32\). The percentage of people without post-grad study who would buy an EV in the next 10 years is \(24/32=0.75\), or 75%.
- The people without post-grad study are in the top row. The odds of people without post-grad study who would buy an EV in the next 10 years is \(24/8 = 3\).
- The odds of people without post-grad study who would by an electric vehicle is \(24/8=3\).
The odds of people with post-grad study who would by an electric vehicle is \(51/29=1.7586\).
So the OR is \(3/1.7586=1.706\). - Not at all. We know exactly what the sample OR is (it is 1.706). CIs always give an interval in which the population parameter is likely to be within.
- The CI is statistically valid if all the expected counts exceed 5. So we don’t really know for sure from the given information. But the observed counts are all reasonably large, so it is very probably statistically valid.
References
Egbue O, Long S, Samaranayake VA. Mass deployment of sustainable transportation: Evaluation of factors that influence electric vehicle adoption. Clean Technologies and Environmental Policy. Springer; 2017;19(7):1927–39.