D.27 Answers: Tests for paired means
Answers to exercises in Sect. 29.12.
Answer to Exercise 29.1:
\(H_0\): \(\mu_d = 0\) and \(H_1\): \(\mu_d>0\):
differences are positive when the dip rating is better than the raw rating.
\(t = (5.2 - 0)/3.06 = 1.699\);
the approximate one-tailed \(P\)-value, from using the 68–95–99.7 rule, is somewhere
between 16% and 2.5%.
So we cannot be sure if the \(P\)-value is larger than 0.05… but it is likely that it is (since the calculated \(t\)-score is quite a long distance from \(z=1\)).
the evidence probably doesn’t support the alternative hypothesis.
Answer to Exercise 29.2:
1. Because it is the bloood pressure reduction,
and a reduction is what the drug is meant to produce,
so expect the reductions to be positive nunmbers.
2. Differences shown below.
3. Histogram of differences: Fig. D.7.
4. \(H_0\): \(\mu_d = 0\) and \(H_1\): \(\mu_d>0\) (because the differences are reductions).
5. \(t=8.12\).
6. \(P = 0.001\div 2 = 0.0005\) (one-tailed test).
7. Very strong evidence (\(P=0.0005\)) that the drug reduces
the average systolic blood pressure (mean reduction: 8.6 mm Hg) in the population.
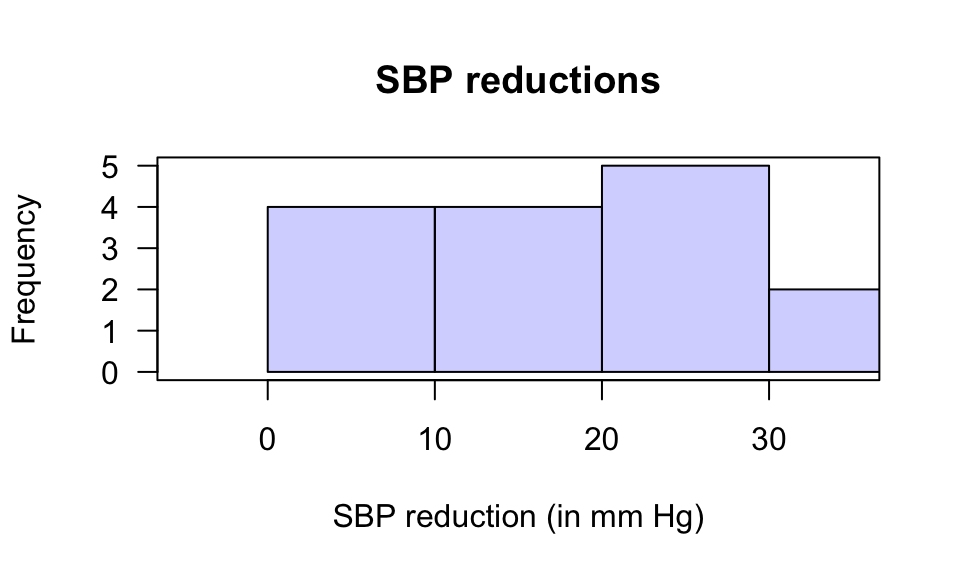
FIGURE D.7: A histogram of the systolic blood pressure reductions (in mm Hg)
Answer to Exercise 29.3:
\(H_0\): \(\mu_d = 0\) and \(H_1\): \(\mu_d>0\),
where differences are positive when the intention to smoke is reduced after exercise.
\(t = (0.66 - 0)/0.37 = 1.78\); \(P\)-value larger than 0.05:
the evidence doesn’t support the alternative hypothesis.
No evidence (\(P>0.05\)) that the mean ‘intention to smoke’ reduced after exercise in women
(mean change in intention to smoke: -0.66; std. error: 0.37).
Answer to Exercise 29.4:
\(H_0\): \(\mu_d = 0\) and \(H_1\): \(\mu_d>0\),
where differences refer to the reduction in ferritin.
\(\bar{d} = -424.25\) and \(s = 2092.693\) and \(n=20\),
so \(t = -0.90663\).
\(t\) is ‘small’; \(P>0.05\) (actually \(P=0.376\)):
the evidence doesn’t support the alternative hypothesis.
Since \(n<25\), the test may not be statistically valid
(the histogram of data (Fig. D.8)
suggests that the population might have a normal distribution),
though the \(P\)-value is very large so it probably makes little difference.
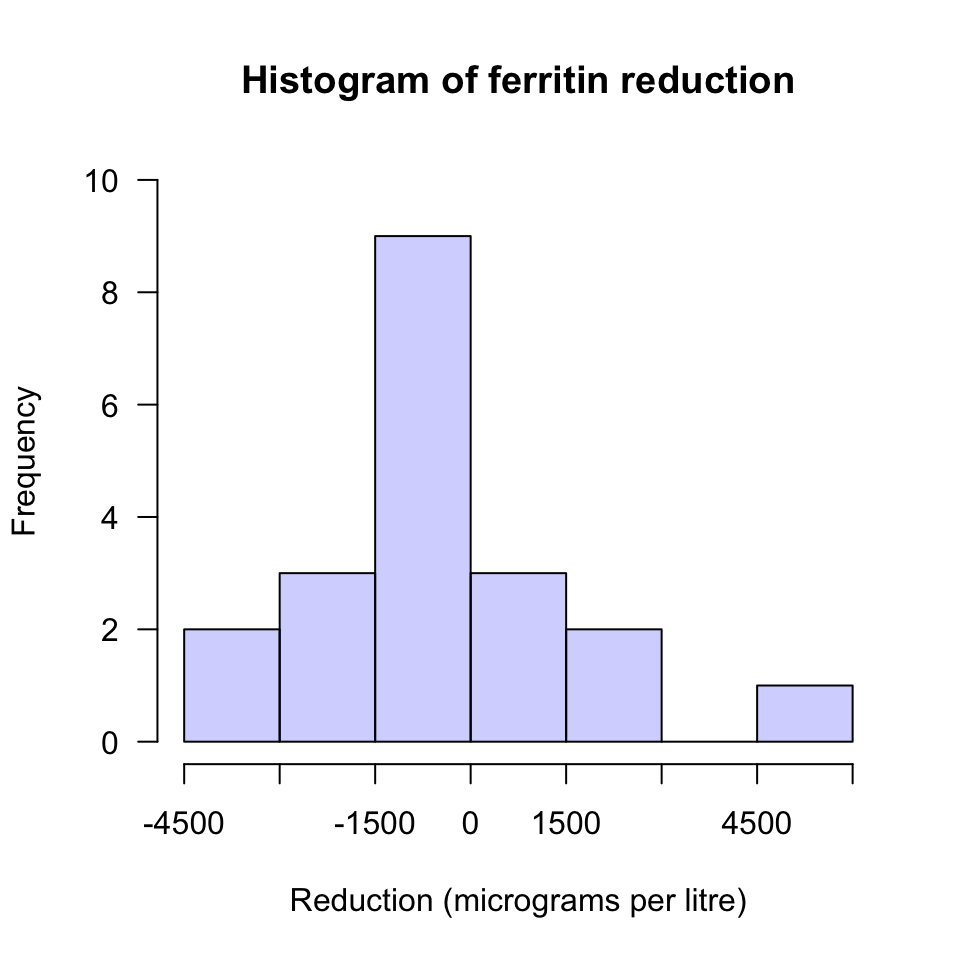
FIGURE D.8: A histogram of the change in ferritin concentration