34.8 Exercises
Selected answers are available in Sect. D.31.
Exercise 34.1 Draw a scatterplot with:
- A negative correlation coefficient, with the value of \(r\) very close to (but not equal to) \(-1\).
- A positive correlation coefficient, with the value of \(r\) very close to (but not equal to) \(+1\).
- A correlation coefficient very close to \(0\).
Exercise 34.2 A study (Myers (1990), p. 75) of American footballers measured the right-leg strengths \(x\) of 13 players (using a weight lifting test), and the distance \(y\) they punted a football (with their right leg) (Fig. 34.12).
- The value of the correlation coefficient is 0.881. Compute the value of \(R^2\), and explain what this means.
- jamovi was used to study the correlation (Fig. 34.13). Using this output, perform a hypothesis test to determine if a correlation exists between punting distance and right-leg strength.
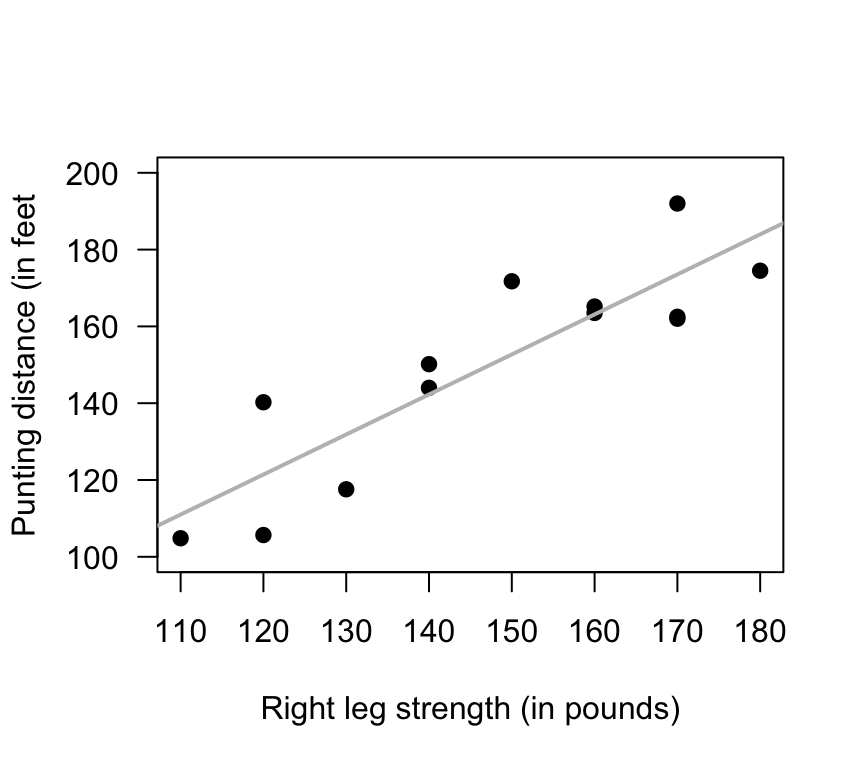
FIGURE 34.12: Punting distance and right leg strength
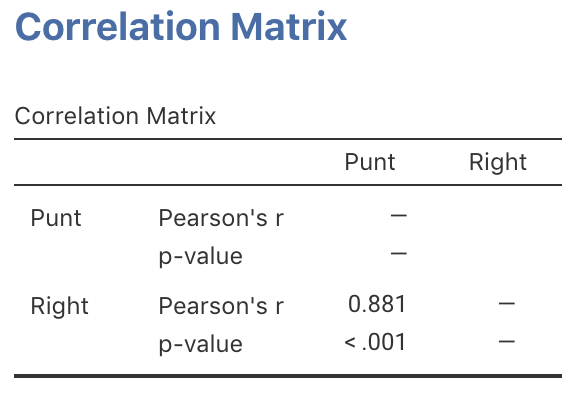
FIGURE 34.13: jamovi output for the punting data
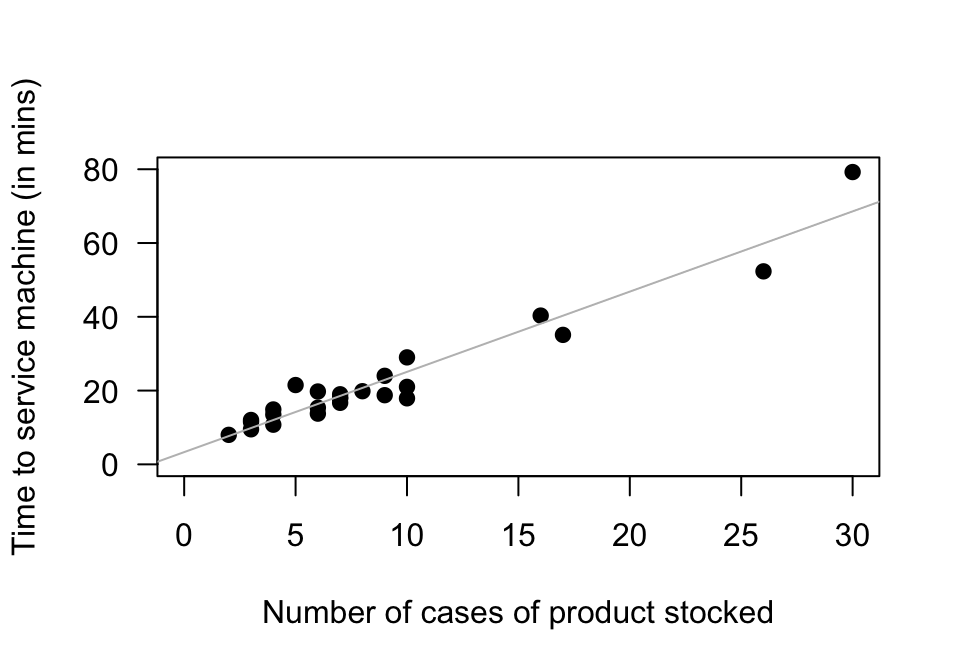
FIGURE 34.14: The time taken to deliver soft drinks to vending machines
Exercise 34.4 A study of hot mix asphalt (Panda et al. 2018) created \(n = 42\) samples of asphalt and measured the volume of air voids and the bitumen content by weight (Fig. 34.15).
- Using the plot, estimate the value of \(r\).
- The value of \(R^2\) is 99.29%. What is the value of \(r\)? (Hint: Be careful!)
- Would you expect the \(P\)-value testing \(H_0\): \(\rho=0\) to be small or large? Explain.
- Would the test be statistically valid?
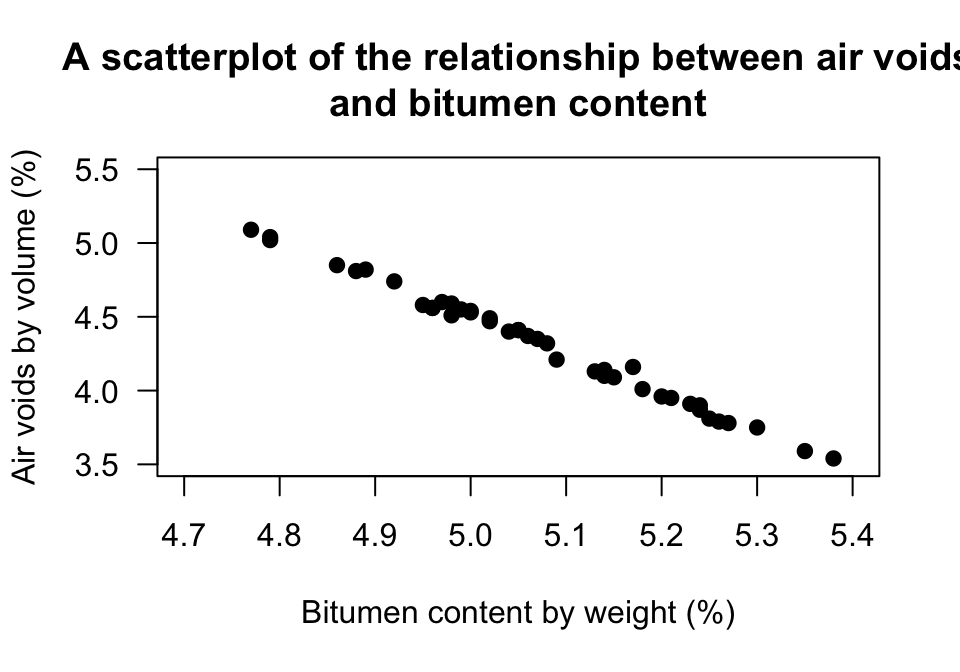
FIGURE 34.15: Air voids in bitumen samples
Exercise 34.5 The California Bearing Ratio (CBR) value is used to describe soil-sub grade for flexible pavements (such as in the design of air field runways).
One study (Talukdar 2014) examined the relationship between CBR and other properties of soil, including the plasticity index (PI, a measure of the plasticity of the soil).
The scatterplot from 16 different soil samples from Assam, India, is shown in Fig. 34.16.
- Using the plot, estimate the value of \(r\).
- The value of \(R^2\) is 67.07%. What is the value of \(r\)? (Hint: Be careful!)
- Would you expect the \(P\)-value testing \(H_0\): \(\rho=0\) to be small or large? Explain.
- Would the test be statistically valid?
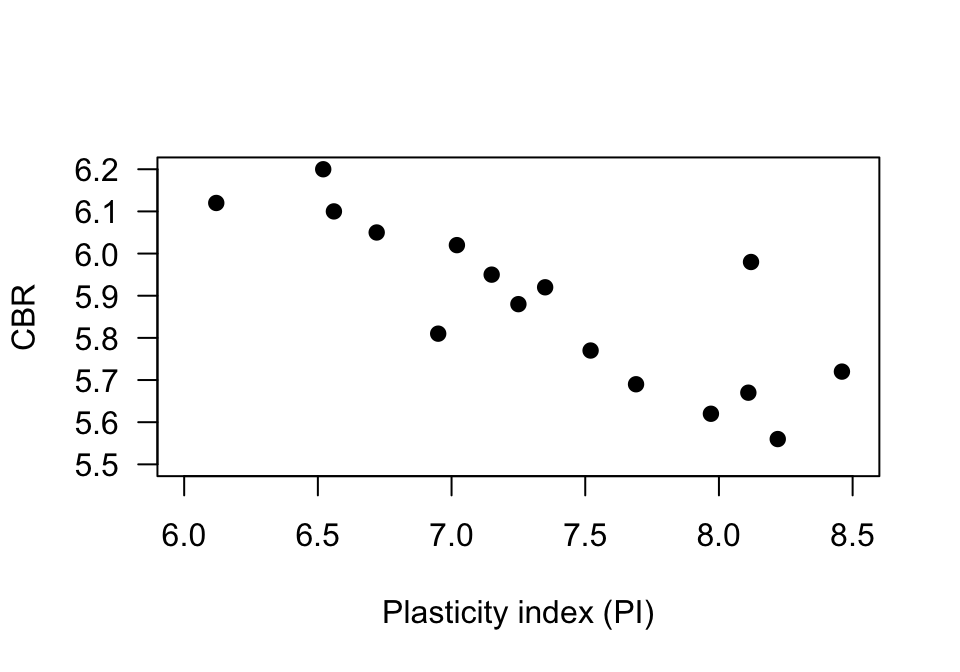
FIGURE 34.16: The relationship between CBR and PI in sixteen soil samples