17.4 Standardising (\(z\)-scores)
Since many statistics have a normal distribution (under certain circumstances), the 68–95–99.7 rule can be used to understand the distribution of sample statistics.
Recall that the 68–95–99.7 rule states that, for any normal distribution (Fig. 13.10):
- 68% of values lie within 1 standard deviation of the mean;
- 95% of values lie within 2 standard deviations of the mean; and
- 99.7% of values lie within 3 standard deviations of the mean.
These percentages only depend on how many standard deviations (\(\sigma\)) a value (\(x\)) is from the mean (\(\mu\)). This information can be used to learn about how values are distributed.
Example 17.1 (The 68–95–99.7 rule) Suppose heights of Australian adult males have a mean of \(\mu=175\)cm, and a standard deviation of \(\sigma=7\)cm, and (approximately) follow a normal distribution. Using this model, what proportion of Australian adult men are taller than 182cm?
Drawing the situation is helpful (Fig. 17.2). Notice that \(175 + 7 = 182\)cm is one standard deviation above the mean. We know that 68% of values are within one standard deviation of the mean, so that 32% are outside that range (smaller or larger) (Fig. 17.2). Hence, 16% are taller than one standard deviation above the mean, so the answer is about 16%. (Another 16% are less than one standard deviation below the mean, or less than \(175 - 7 = 168\)cm in height.)
Again, the percentages only depend on how many standard deviations (\(\sigma\)) the value (\(x\)) is from the mean (\(\mu\)), and not the actual values of \(\mu\) and \(\sigma\).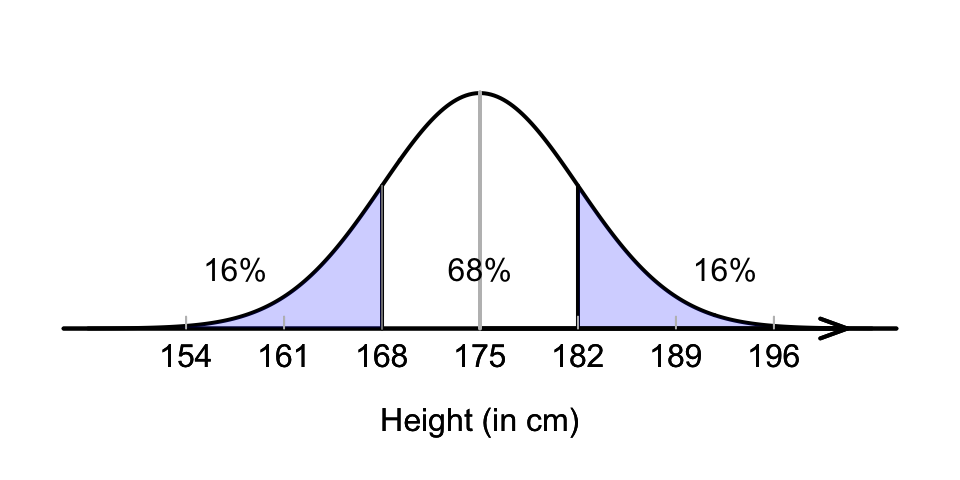
FIGURE 17.2: What proportion of Australian adult males are taller than 182cm?
Example 17.2 (The 68–95–99.7 rule) Suppose heights of Australian adult males have a mean of \(\mu=175\)cm, and a standard deviation of \(\sigma=7\)cm, and (approximately) follow a normal distribution. Using this model, what proportion are shorter than 161cm? Again, drawing the situation is helpful (Fig. 17.3).
Since \(175 - (2\times 7) = 161\), then 161cm is two standard deviation below the mean. Since 95% of values are within two standard deviation of the mean, 5% are outside that range (half smaller, half larger; see Fig. 17.3), so that 2.5% are shorter than 161cm. (Another 2.5% are taller than \(175 + 14 = 189\)cm.)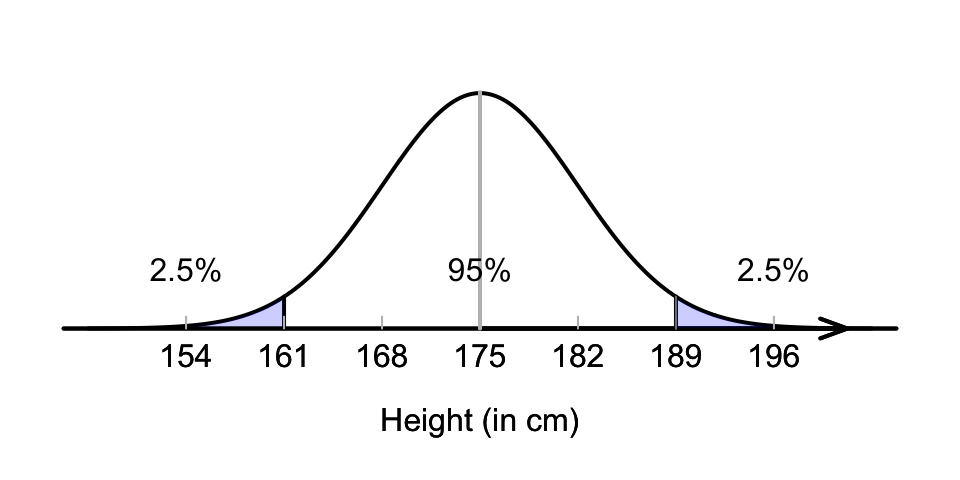
FIGURE 17.3: What proportion of Australian adult males are shorter than 161cm?
Again, the percentages only depend on how many standard deviations (\(\sigma\)) the value (\(x\)) is from the mean (\(\mu\)). The number of standard deviations that an observation is from the mean is called a \(z\)-score. A \(z\)-score is computed using
\[ z = \frac{ x - \mu}{\sigma}. \] Converting values to \(z\)-scores is called standardising.
Definition 17.1 (\(z\)-score) A \(z\)-score measures how many standard deviations a value is from the mean. In symbols:
\[\begin{equation} z = \frac{x - \mu}{\sigma}, \tag{17.1} \end{equation}\] where \(x\) is the value, \(\mu\) is the mean of the distribution, and \(\sigma\) is the standard deviation of the distribution.Example 17.3 (\(z\)-scores) In Example 17.1, the \(z\)-score for a height of 182cm is
\[ z = \frac{x-\mu}{\sigma} = \frac{182 - 175}{7} = 1, \] one standard deviation above the mean.
In Example 17.2, the \(z\)-score for a height of 161cm is
\[ z = \frac{x-\mu}{\sigma} = \frac{161 - 175}{7} = -2, \] two standard deviations below the mean (a negative \(z\)-score means the value is below the mean).The \(z\)-score is the number of standard deviations the observation is away from the mean. The \(z\)-score is also called the standardised value or standard score, and is calculated using Equation (17.1). Note that:
- \(z\)-scores are negative for observations below the mean, and positive for observations above the mean.
- \(z\)-scores are numbers without units (that is, it is not in kg, or cm, etc.).
Example 17.4 (The 68–95–99.7 rule) Consider the model for the heights of Australian adult males: a normal distribution, mean \(\mu=175\), standard deviation \(\sigma=7\) (Fig. 17.1).
Using this model:
- The mean is zero standard deviations from the mean: \(z=0\).
- 168cm and 182cm are one standard deviation from the mean: \(z=-1\) and \(z=1\) respectively.
- 161cm and 189cm are two standard deviations from the mean: \(z=-2\) and \(z=2\) respectively.
- 154cm and 196cm are three standard deviations from mean: \(z=-3\) and \(z=3\) respectively.