35.10 Example: Food digestibility
A study evaluated various food for sheep (Moir 1961). One combination of variables assessed is shown in Fig. 33.6.
The RQ is:
Does the digestible energy requirement of feed increase with dry matter digestibility percentage (and if so, what is the relationship)?
In this study, \(x\) is the dry matter weight digestibility percentage, and \(y\) is the digestible energy. The data are shown in Fig. 35.16. Using the software output (Fig. 35.17 (jamovi); Fig. 35.18 (SPSS)), the values of the slope and \(y\)-intercept in the sample are \(b_0 = -0.193\) and \(b_1 = 0.047\). The regression equation is
\[ \hat{y} = -0.193 + 0.047x. \]
FIGURE 35.16: The digestibility data set
The slope means that when the dry matter weight digestibility increases by 1 percentage point, the digestible energy increases, on average, by 0.047 Cal/gram.
Each sample will produce slightly different sample slopes, so we can test to see if the slope in the population is non-zero due to sampling variation, using a hypothesis test:
- \(H_0\): \(\beta_1 = 0\);
- \(H_1\): \(\beta_1 > 0\).
The parameter is \(\beta_1\), the population slope for the regression equation predicting digestible energy from dry matter weight.
The alternative hypothesis is one-tailed, based on the RQ.
From the software output, \(t = 39.322\), which is huge; the two-tailed \(P\)-value is \(P<0.001\). Since we have a one-tailed alternative hypothesis, the \(P\)-value is less than \(0.001/2 = 0.0005\). There is very strong evidence that the digestible energy increases as the dry matter weight digestibility increases.
The approximate 95% CI for the population slope \(\beta_1\) is
\[ 0.047 \pm (2\times 0.001), \] or from 0.045 to 0.049.
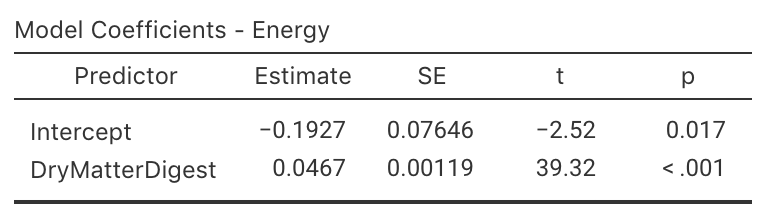
FIGURE 35.17: jamovi output for the sheep-feed data
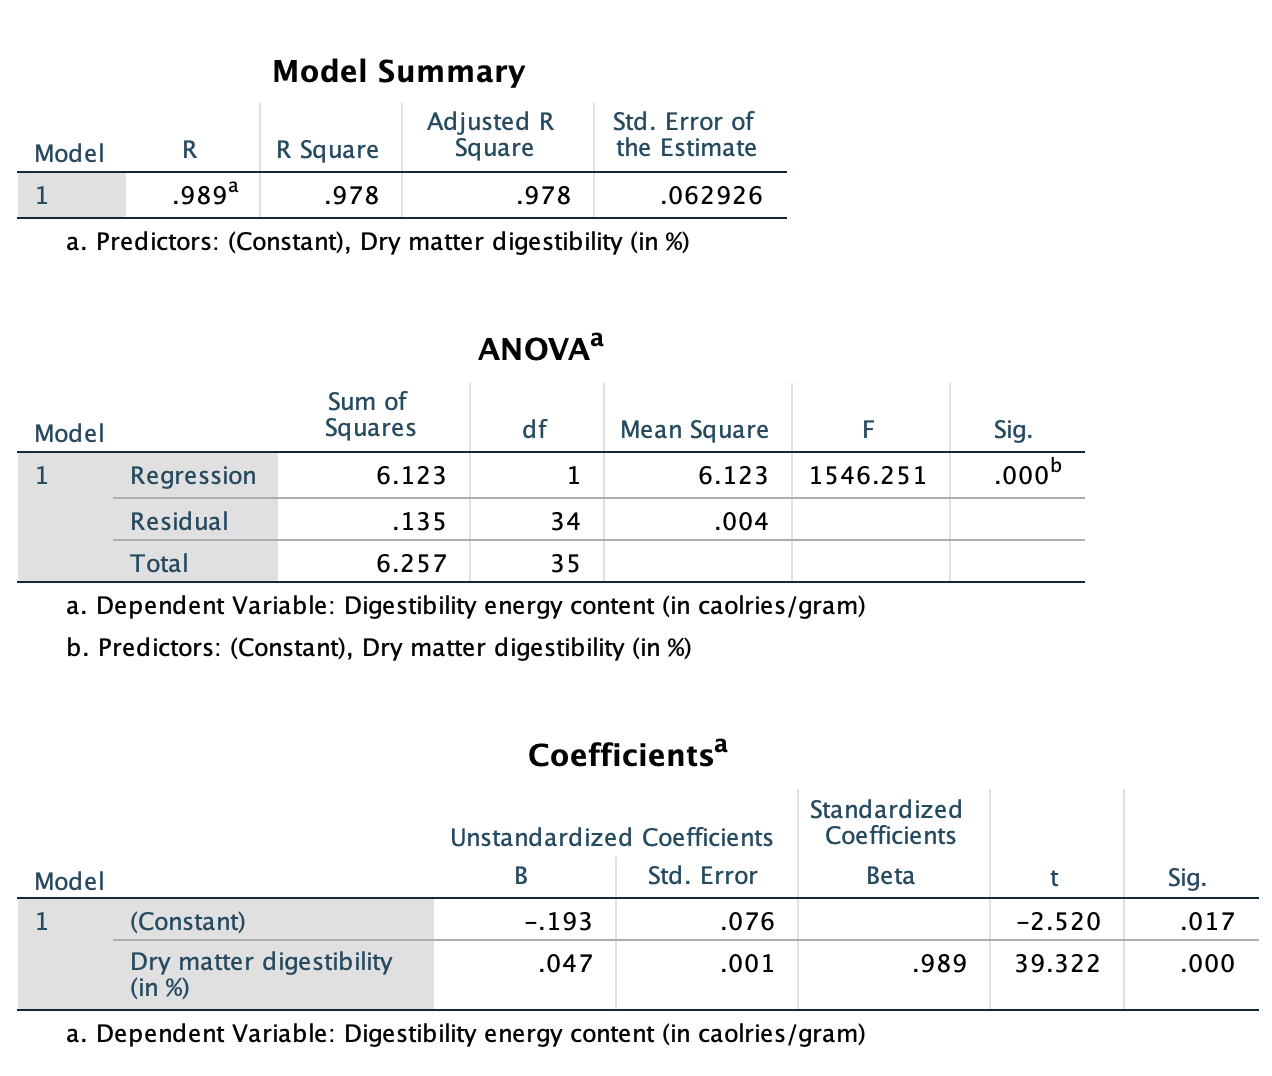
FIGURE 35.18: SPSS output for the sheep-feed data
The results are statistically valid. We write:
The sample presents very strong evidence (\(t = 39.322\); one-tailed \(P < 0.0005\)) of a relationship between dry matter weight digestibility and the digestible energy (slope: \(0.047\); \(n = 36\); 95% CI from \(-0.045\) to \(-0.049\)) in the population.
Click on the hotspots in the following image, to see what the areas under the normal curve mean.