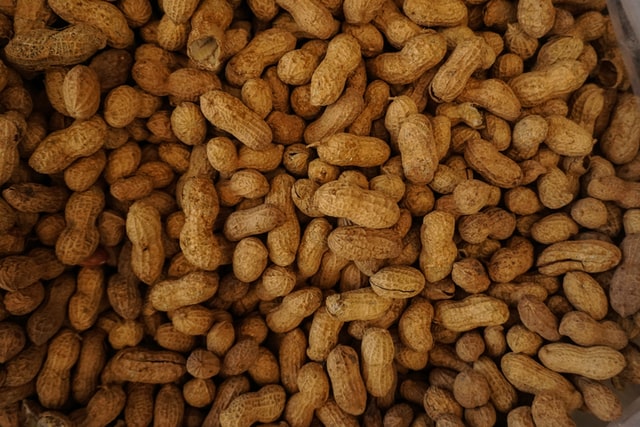
22.6 Example: Cadmium in peanuts

A study of peanuts from the United States (Blair and Lamb 2017) found the sample mean cadmium concentration was 0.0768 ppm with a standard deviation of 0.0460 ppm, from a sample of size 290 peanuts gathered from a variety of regions at various times (attempting to find a representative sample).
The parameter is \(\mu\), the population mean cadmium concentration in peanuts.
Every sample of \(n = 290\) peanuts is likely to produce a different sample mean; that is, the sample means show sampling variation. The sampling variation can be measured using the standard error:
\[ \text{s.e.}(\bar{x}) = \frac{s}{\sqrt{n}} = \frac{0.0460}{\sqrt{290}} = 0.002701\text{ ppm}. \] The approximate 95% CI is \[ 0.0768 \pm (2 \times 0.002701), \] or \(0.0768 \pm 0.00540\), which is from 0.0714 to 0.0822 ppm. (The margin of error is 0.00540.)
If we repeatedly took samples of size 290 from this population, about 95% of the 95% CIs would contain the population mean (but this CI may or may not contain the value of \(\mu\)).
The plausible values of \(\mu\) that could have produced \(\bar{x} = 0.0768\) are between 0.0714 and 0.0822ppm. Alternatively, we are about 95% confident that the CI of 0.0714 to 0.0822 ppm straddles the population mean.
Since the sample size is larger than \(25\), the CI is statistically valid.