35.9 Example: Obstructive sleep apnoea
In a study of obstructive sleep apnoea (OSA) in adults with Down Syndrome (de Carvalho et al. 2020), \(n = 60\) adults underwent a sleep study and had various data recorded. The main response variable of interest was OSA severity (measured using the Respiratory Event Index, REI). REI means the average number of episodes of sleep disruption (according to specific criteria) per hour of sleep.
One research question is
Among Down Syndrome adults, is there a relationship between the REI and neck size?
Here, \(x\) is the neck size (in cm), and \(y\) is the REI value.
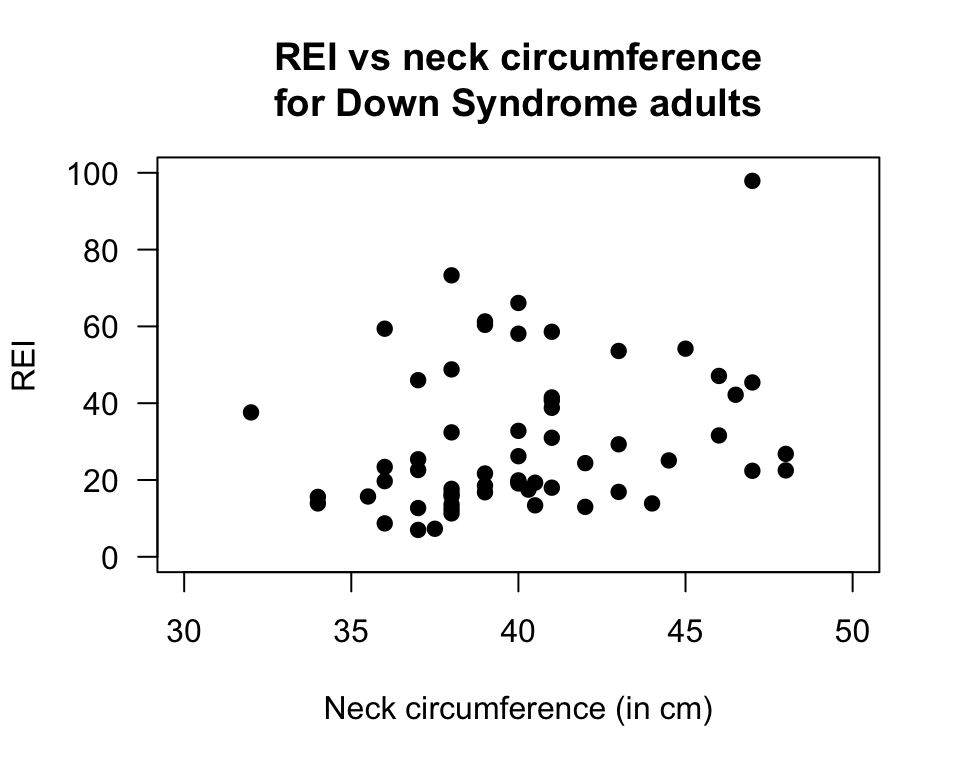
The data are shown in Fig. 35.13.
FIGURE 35.13: The Obstructive sleep apnoea data set

FIGURE 35.14: Scatterplot of the neck circumference vs REI for Down Syndrome adults
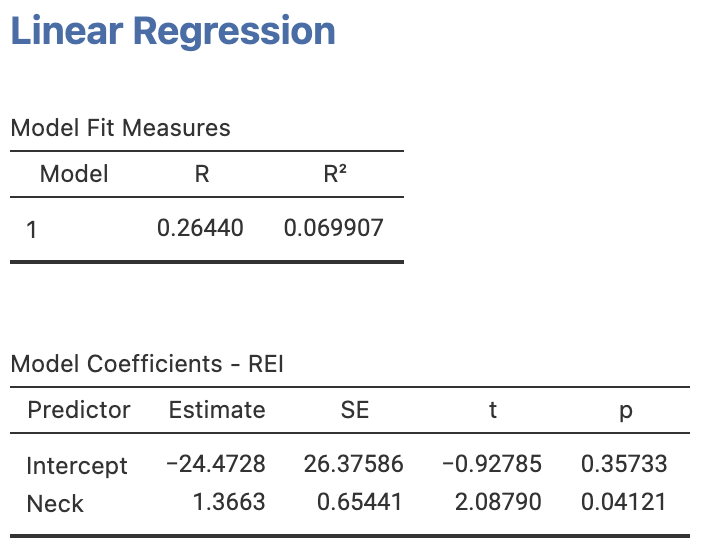
Using the jamovi output (Fig. 35.15) the value of the slope and \(y\)-intercept in the sample are \(b_0 = -0.193\) and \(b_1 = 0.047\).

FIGURE 35.15: jamovi output for the Obstructive sleep apnoea data
The values of the slope and \(y\)-intercept in the sample are \(b_0 = -24.47\) and \(b_1 = 1.36\). The regression equation is
\[ \hat{y} = -24.47 + 1.36x. \]
The slope means that for each one centimetre increase in neck circumference, the number of sleep disruptions per hour increase (on average) by about 1.36.
Each sample will produce slightly different sample slopes, so we can test to see if the slope in the population is non-zero due to sampling variation, using a hypothesis test:
- \(H_0\): \(\beta_1 = 0\);
- \(H_1\): \(\beta_1 \ne 0\) (that is, two-tailed).
The parameter is \(\beta_1\). From the software output, \(t = 2.09\) and the two-tailed \(P\)-value is \(P = 0.041\). This means there moderate evidence that the neck circumference is associated with greater REI.
The approximate 95% CI for the population slope \(\beta_1\) is
\[ 1.3663 \pm (2\times 0.65441), \] or from 0.057 to 2.68.
From the scatterplot (Fig. 35.14) the results appear statistically valid. We write:
The sample presents moderate evidence (\(t = 2.09\); two-tailed \(P = 0.041\)) of a relationship between neck circumference and REI (slope: \(1.36\); \(n = 60\); 95% CI from \(0.057\) to \(2.68\)) in the population.