22.2 Sales Funnel
22.2.1 Example 1
This example is based on Sergey Bryl
\[ Awareness \to Interest \to Desire \to Action \]
Step in the funnel:
- 0 step (necessary condition) – customer visits a site for the first time
- 1st step (awareness) – visits two site’s pages
- 2nd step (interest) – reviews a product page
- 3rd step (desire) – adds a product to the shopping cart
- 4th step (action) – completes purchase
Simulate data
library(tidyverse)
library(purrrlyr)
library(reshape2)

##### simulating the "real" data #####
set.seed(454)
df_raw <-
  data.frame(
    customer_id = paste0('id', sample(c(1:5000), replace = TRUE)),
    date = as.POSIXct(
      rbeta(10000, 0.7, 10) * 10000000,
      origin = '2017-01-01',
      tz = "UTC"
    ),
    channel = paste0('channel_', sample(
      c(0:7),
      10000,
      replace = TRUE,
      prob = c(0.2, 0.12, 0.03, 0.07, 0.15, 0.25, 0.1, 0.08)
    )),
    site_visit = 1
  ) %>%

  mutate(
    two_pages_visit = sample(c(0, 1), 10000, replace = TRUE, prob = c(0.8, 0.2)),
    product_page_visit = ifelse(
      two_pages_visit == 1,
      sample(
        c(0, 1),
        length(two_pages_visit[which(two_pages_visit == 1)]),
        replace = TRUE,
        prob = c(0.75, 0.25)
      ),
      0
    ),
    add_to_cart = ifelse(
      product_page_visit == 1,
      sample(
        c(0, 1),
        length(product_page_visit[which(product_page_visit == 1)]),
        replace = TRUE,
        prob = c(0.1, 0.9)
      ),
      0
    ),
    purchase = ifelse(add_to_cart == 1,
                      sample(
                        c(0, 1),
                        length(add_to_cart[which(add_to_cart == 1)]),
                        replace = TRUE,
                        prob = c(0.02, 0.98)
                      ),
                      0)
  ) %>%
  dmap_at(c('customer_id', 'channel'), as.character) %>%
  arrange(date) %>%
  mutate(session_id = row_number()) %>%
  arrange(customer_id, session_id)
df_raw <-
  reshape2::melt(
    df_raw,
    id.vars = c('customer_id', 'date', 'channel', 'session_id'),
    value.name = "trigger",
    variable.name = 'event'
  ) %>%
  filter(trigger == 1) %>%
  select(-trigger) %>%
  arrange(customer_id, date)
Preprocessing
### removing not first events ###
df_customers <- df_raw %>%
  group_by(customer_id, event) %>%
  filter(date == min(date)) %>%
  ungroup()
Assumption: all customers are first-time buyers. Hence, every next purchase as an event will be removed with the above code.
Calculate channel probability
### Sales Funnel probabilities ###
sf_probs <- df_customers %>%

    group_by(event) %>%
    summarise(customers_on_step = n()) %>%
    ungroup() %>%

    mutate(
        sf_probs = round(customers_on_step / customers_on_step[event == 'site_visit'], 3),
        sf_probs_step = round(customers_on_step / lag(customers_on_step), 3),
        sf_probs_step = ifelse(is.na(sf_probs_step) == TRUE, 1, sf_probs_step),
        sf_importance = 1 - sf_probs_step,
        sf_importance_weighted = sf_importance / sum(sf_importance)
    )
Visualization
### Sales Funnel visualization ###
df_customers_plot <- df_customers %>%

    group_by(event) %>%
    arrange(channel) %>%
    mutate(pl = row_number()) %>%
    ungroup() %>%

    mutate(
        pl_new = case_when(
            event == 'two_pages_visit' ~ round((max(pl[event == 'site_visit']) - max(pl[event == 'two_pages_visit'])) / 2),
            event == 'product_page_visit' ~ round((max(pl[event == 'site_visit']) - max(pl[event == 'product_page_visit'])) / 2),
            event == 'add_to_cart' ~ round((max(pl[event == 'site_visit']) - max(pl[event == 'add_to_cart'])) / 2),
            event == 'purchase' ~ round((max(pl[event == 'site_visit']) - max(pl[event == 'purchase'])) / 2),
            TRUE ~ 0
        ),
        pl = pl + pl_new
    )

df_customers_plot$event <-
    factor(
        df_customers_plot$event,
        levels = c(
            'purchase',
            'add_to_cart',
            'product_page_visit',
            'two_pages_visit',
            'site_visit'
        )
    )

# color palette
cols <- c(
    '#4e79a7',
    '#f28e2b',
    '#e15759',
    '#76b7b2',
    '#59a14f',
    '#edc948',
    '#b07aa1',
    '#ff9da7',
    '#9c755f',
    '#bab0ac'
)

ggplot(df_customers_plot, aes(x = event, y = pl)) +
    theme_minimal() +
    scale_colour_manual(values = cols) +
    coord_flip() +
    geom_line(aes(group = customer_id, color = as.factor(channel)), size = 0.05) +
    geom_text(
        data = sf_probs,
        aes(
            x = event,
            y = 1,
            label = paste0(sf_probs * 100, '%')
        ),
        size = 4,
        fontface = 'bold'
    ) +
    guides(color = guide_legend(override.aes = list(size = 2))) +
    theme(
        legend.position = 'bottom',
        legend.direction = "horizontal",
        panel.grid.major.x = element_blank(),
        panel.grid.minor = element_blank(),
        plot.title = element_text(
            size = 20,
            face = "bold",
            vjust = 2,
            color = 'black',
            lineheight = 0.8
        ),
        axis.title.y = element_text(size = 16, face = "bold"),
        axis.title.x = element_blank(),
        axis.text.x = element_blank(),
        axis.text.y = element_text(
            size = 8,
            angle = 90,
            hjust = 0.5,
            vjust = 0.5,
            face = "plain"
        )
    ) +
    ggtitle("Sales Funnel visualization - all customers journeys")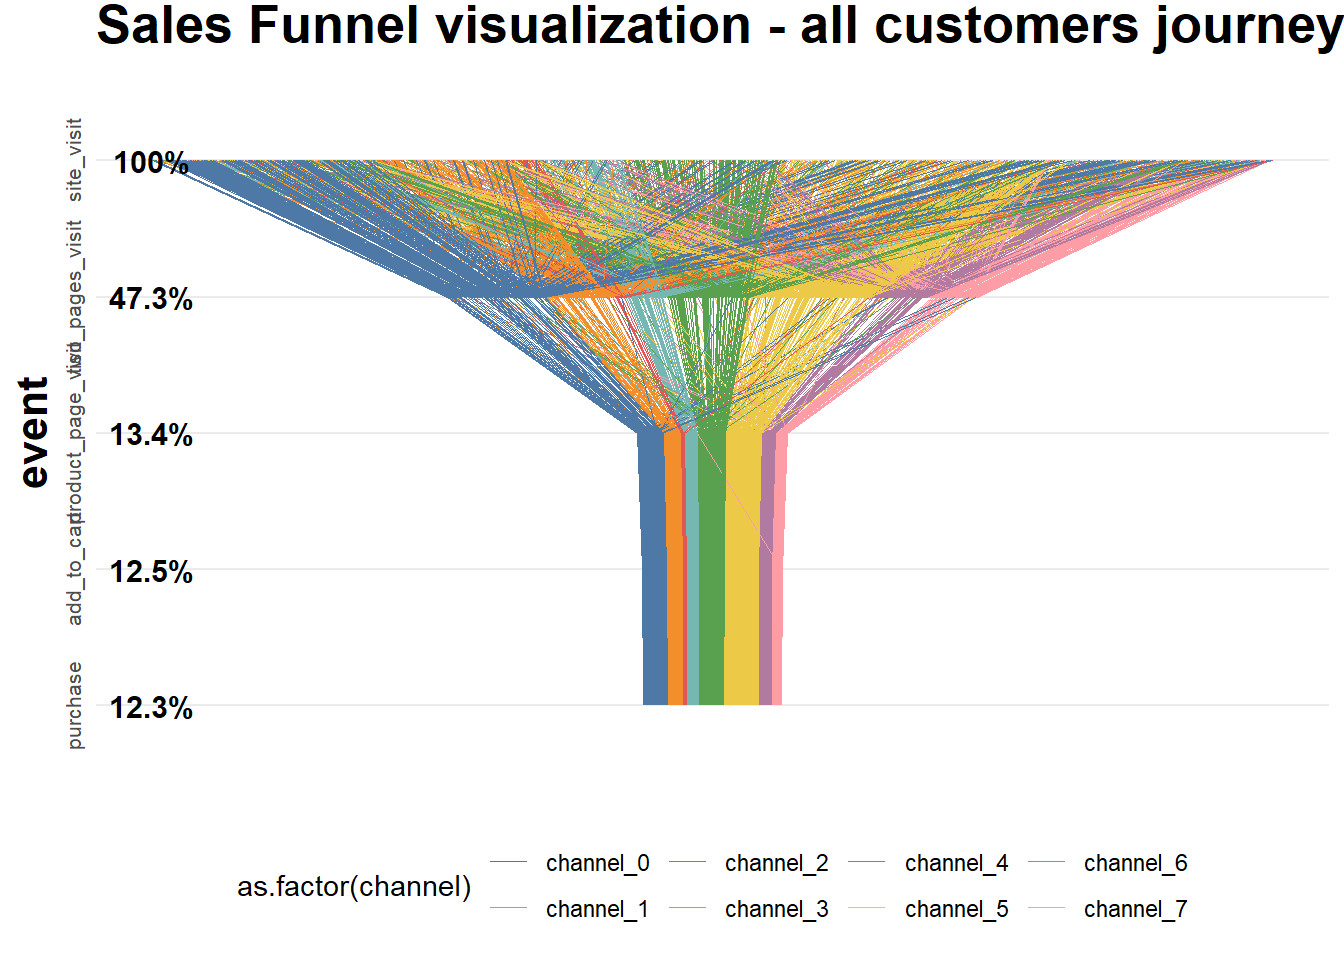
Calculate attribution
### computing attribution ###
df_attrib <- df_customers %>%
# removing customers without purchase
group_by(customer_id) %>%
filter(any(as.character(event) == 'purchase')) %>%
ungroup() %>%
# joining step's importances
left_join(., sf_probs %>% select(event, sf_importance_weighted), by = 'event') %>%
group_by(channel) %>%
summarise(tot_attribution = sum(sf_importance_weighted)) %>%
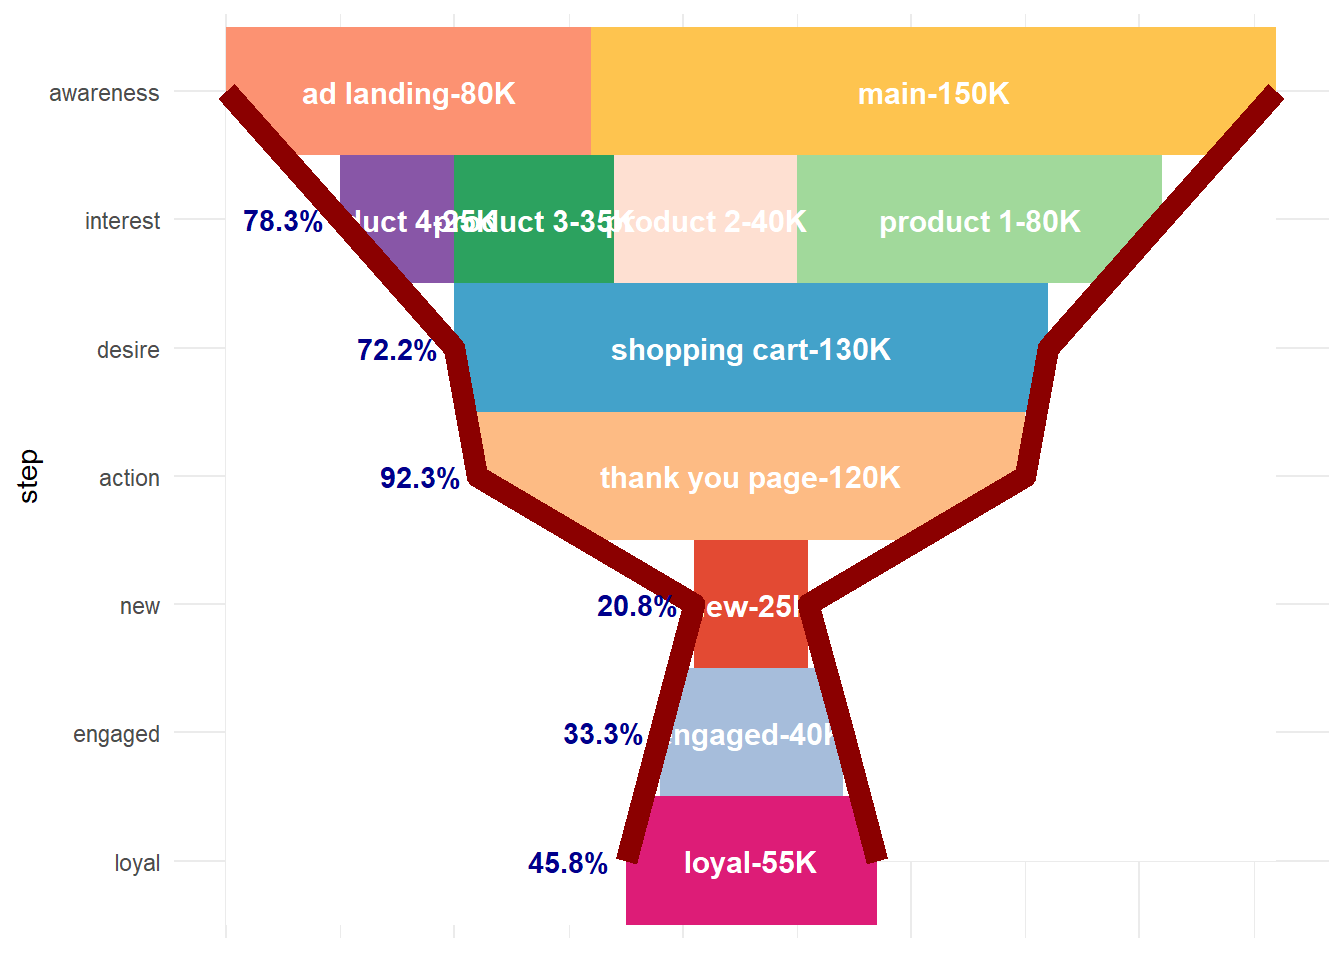
ungroup()22.2.2 Example 2
Code from Sergey Bryl
library(dplyr)
library(ggplot2)
library(reshape2)

# creating a data samples
# content
df.content <- data.frame(
    content = c(
        'main',
        'ad landing',
        'product 1',
        'product 2',
        'product 3',
        'product 4',
        'shopping cart',
        'thank you page'
    ),
    step = c(
        'awareness',
        'awareness',
        'interest',
        'interest',
        'interest',
        'interest',
        'desire',
        'action'
    ),
    number = c(150000, 80000,
               80000, 40000, 35000, 25000,
               130000,
               120000)
)
# customers
df.customers <- data.frame(
    content = c('new', 'engaged', 'loyal'),
    step = c('new', 'engaged', 'loyal'),
    number = c(25000, 40000, 55000)
)
# combining two data sets
df.all <- rbind(df.content, df.customers)

# calculating dummies, max and min values of X for plotting
df.all <- df.all %>%
    group_by(step) %>%
    mutate(totnum = sum(number)) %>%
    ungroup() %>%
    mutate(dum = (max(totnum) - totnum) / 2,
           maxx = totnum + dum,
           minx = dum)

# data frame for plotting funnel lines
df.lines <- df.all %>%
    distinct(step, maxx, minx)

# data frame with dummies
df.dum <- df.all %>%
    distinct(step, dum) %>%
    mutate(content = 'dummy',
           number = dum) %>%
    select(content, step, number)

# data frame with rates
conv <- df.all$totnum[df.all$step == 'action']

df.rates <- df.all %>%
    distinct(step, totnum) %>%
    mutate(
        prevnum = lag(totnum),
        rate = ifelse(
            step == 'new' | step == 'engaged' | step == 'loyal',
            round(totnum / conv, 3),
            round(totnum / prevnum, 3)
        )
    ) %>%
    select(step, rate)
df.rates <- na.omit(df.rates)

# creting final data frame
df.all <- df.all %>%
    select(content, step, number)

df.all <- rbind(df.all, df.dum)

# defining order of steps
df.all$step <-
    factor(
        df.all$step,
        levels = c(
            'loyal',
            'engaged',
            'new',
            'action',
            'desire',
            'interest',
            'awareness'
        )
    )
df.all <- df.all %>%
    arrange(desc(step))
list1 <- df.all %>% distinct(content) %>%
    filter(content != 'dummy')
df.all$content <-
    factor(df.all$content, levels = c(as.character(list1$content), 'dummy'))

# calculating position of labels
df.all <- df.all %>%
    arrange(step, desc(content)) %>%
    group_by(step) %>%
    mutate(pos = cumsum(number) - 0.5 * number) %>%
    ungroup()

# creating custom palette with 'white' color for dummies
cols <- c(
    "#fec44f",
    "#fc9272",
    "#a1d99b",
    "#fee0d2",
    "#2ca25f",
    "#8856a7",
    "#43a2ca",
    "#fdbb84",
    "#e34a33",
    "#a6bddb",
    "#dd1c77",
    "#ffffff"
)

# plotting chart
ggplot() +
    theme_minimal() +
    coord_flip() +
    scale_fill_manual(values = cols) +
    geom_bar(
        data = df.all,
        aes(x = step, y = number, fill = content),
        stat = "identity",
        width = 1
    ) +
    geom_text(
        data = df.all[df.all$content != 'dummy',],
        aes(
            x = step,
            y = pos,
            label = paste0(content, '-', number / 1000, 'K')
        ),
        size = 4,
        color = 'white',
        fontface = "bold"
    ) +
    geom_ribbon(data = df.lines,
                aes(
                    x = step,
                    ymax = max(maxx),
                    ymin = maxx,
                    group = 1
                ),
                fill = 'white') +
    geom_line(
        data = df.lines,
        aes(x = step, y = maxx, group = 1),
        color = 'darkred',
        size = 4
    ) +
    geom_ribbon(data = df.lines,
                aes(
                    x = step,
                    ymax = minx,
                    ymin = min(minx),
                    group = 1
                ),
                fill = 'white') +
    geom_line(
        data = df.lines,
        aes(x = step, y = minx, group = 1),
        color = 'darkred',
        size = 4
    ) +
    geom_text(
        data = df.rates,
        aes(
            x = step,
            y = (df.lines$minx[-1]),
            label = paste0(rate * 100, '%')
        ),
        hjust = 1.2,
        color = 'darkblue',
        fontface = "bold"
    ) +
    theme(
        legend.position = 'none',
        axis.ticks = element_blank(),
        axis.text.x = element_blank(),
        axis.title.x = element_blank()
    )