29 Surveys
Chandon, Morwitz, and Reinartz (2005) posits that “self-generated validity” can obscure the link between purchase intentions and purchase behavior. On average, the link between latent intentions and purchase behavior is 58% stronger among survey consumers that that of nonsurveyed consumers.
Sheppard, Hartwick, and Warshaw (1988) found that the link between intentions and behavior is about 0.53
A little more improvement can be achieved in predictive power if we use segmentation before forecasting sales based on historical purchases and purchase intention Morwitz and Schmittlein (1992)
| Sampling | Interviews | Data environment | |
|---|---|---|---|
| 1st era | area probability | face-to-face | stand-alone |
| 2nd ear | random digital dial probability | telephone | stand-alone |
| 3rd era | non-probability | computer-administered | linked |
Total survey error framework (Groves and Lyberg 2010)
Insight:
- Errors can come from bias or variance
- Total survey error = Measurement error + representation error
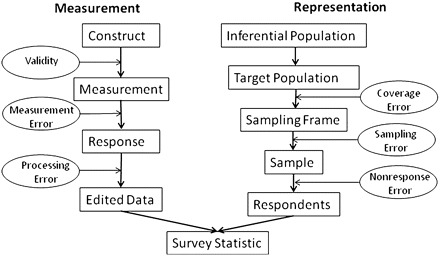
\[@Groves_2010, Fig. 3\]
Probability and Non-probability Sampling
- Probability sample: every unit from a frame population has a known and non-zero probability of inclusion
- With weighting, we can recover bias in your sampling.
- Non-response problem
Horvitz-Thompson estimator (or bias estimator):
\[ \hat{\bar{y}} = \frac{\sum_{i \in s}y_i / \pi_i}{N} \]
where \(\pi_i\) = person i’s probability of inclusion (we have to estimate)
- Create a survey that leverages the power of people
Mass Collaboration
-
Human Computation: Train People -> Train Lots of People -> Train Machine
Cleaning
De-biasing
Combining
-
Open Call:
solutions are easier to check than generate
required specialized skills
-
Distributed Data Collection:
People go out and collect data
quality check
29.1 Anchoring Vignettes
Problem of interpersonal incomparability
-
Resources:
-
Help with 2 questions:
Different respondents understand the same question differently: Incomparaability in Survey Responses (“DIF”). Agreement on theoretical concept is almost nearly impossible.
How can we measure concepts that can only be defined by examples
Measure like usually, then subtract the incomparable portion. (i.e., using the assessment from the same respondents for a particular example/case to correct/adjust for the self-assessment).
Varying vignette assessments give us DIF (i.e., differential item functioning)
Since we created the anchors (i.e., examples), we know the true vignette assessments are fixed over respondents
29.1.1 Nonparametric method
Code the relative ranking of self-assessment in accordance to vignettes.
Inconsistencies would be considered ties.
Measurement Assumptions:
Response consistency: Each responder approaches the self-assessment and vignette categories in a same manner across questions.
Vignette Equivalence: For every vignette, the real level is the same for all respondents.
Used Ordered Probit to estimate.