1.6 Approximating probabilities - a brief introduction to simulation
Here’s a seemingly simple problem. Flip a fair coin four times and record the results in order. For the recorded sequence, compute the proportion of the flips which immediately follow a H that result in H. What value do you expect for this proportion? (If there are no flips which immediately follow a H, i.e. the outcome is either TTTT or TTTH, discard the sequence and try again with four more flips.)
For example, the sequence HHTT means the the first and second flips are heads and the third and fourth flips are tails. For this sequence there are two flips which immediately followed heads, the second and the third, of which one (the second) was heads. So the proportion in question for this sequence is 1/2.
So what value do you expect for this proportion? We think it’s safe to say that most people would answer 1/2. After all, it shouldn’t matter if a flip follows heads or not, right? We would expect half of the flips to land on heads regardless of whether the flip follows H, right? We’ll see there are some subtleties lurking behind these questions.
To get an idea of what we would expect for this proportion, we could conduct a simulation: flip a coin 4 times and see what happens. Table Table 1.3 displays the results of a few repetitions; each repetition consists of an ordered sequence of 4 coin flips for which the proportion in question is measured. (Flips which immediately follow H are in bold.)
| Repetition | Outcome | Flips that follow H | H that follow H | Proportion of H following H |
|---|---|---|---|---|
| 1 | HHTT | 2 | 1 | 0.5 |
| 2 | HTTH | 1 | 0 | 0 |
| discarded | TTTH | 0 | NA | try again |
| 3 | HTHT | 2 | 0 | 0 |
| 4 | THHH | 2 | 2 | 1 |
| 5 | HHTT | 2 | 1 | 0.5 |
| 6 | HHHT | 3 | 2 | 0.667 |
| 7 | HTTH | 1 | 0 | 0 |
| 8 | THHT | 2 | 1 | 0.5 |
| 9 | THTT | 1 | 0 | 0 |
| 10 | HHHH | 3 | 3 | 1 |
The table and plot below summarize the results of these 10 repetitions of the simulation.
| Proportion of H following H | Frequency | Relative frequency |
|---|---|---|
| 0.0000 | 4 | 0.4 |
| 0.5000 | 3 | 0.3 |
| 0.6667 | 1 | 0.1 |
| 1.0000 | 2 | 0.2 |
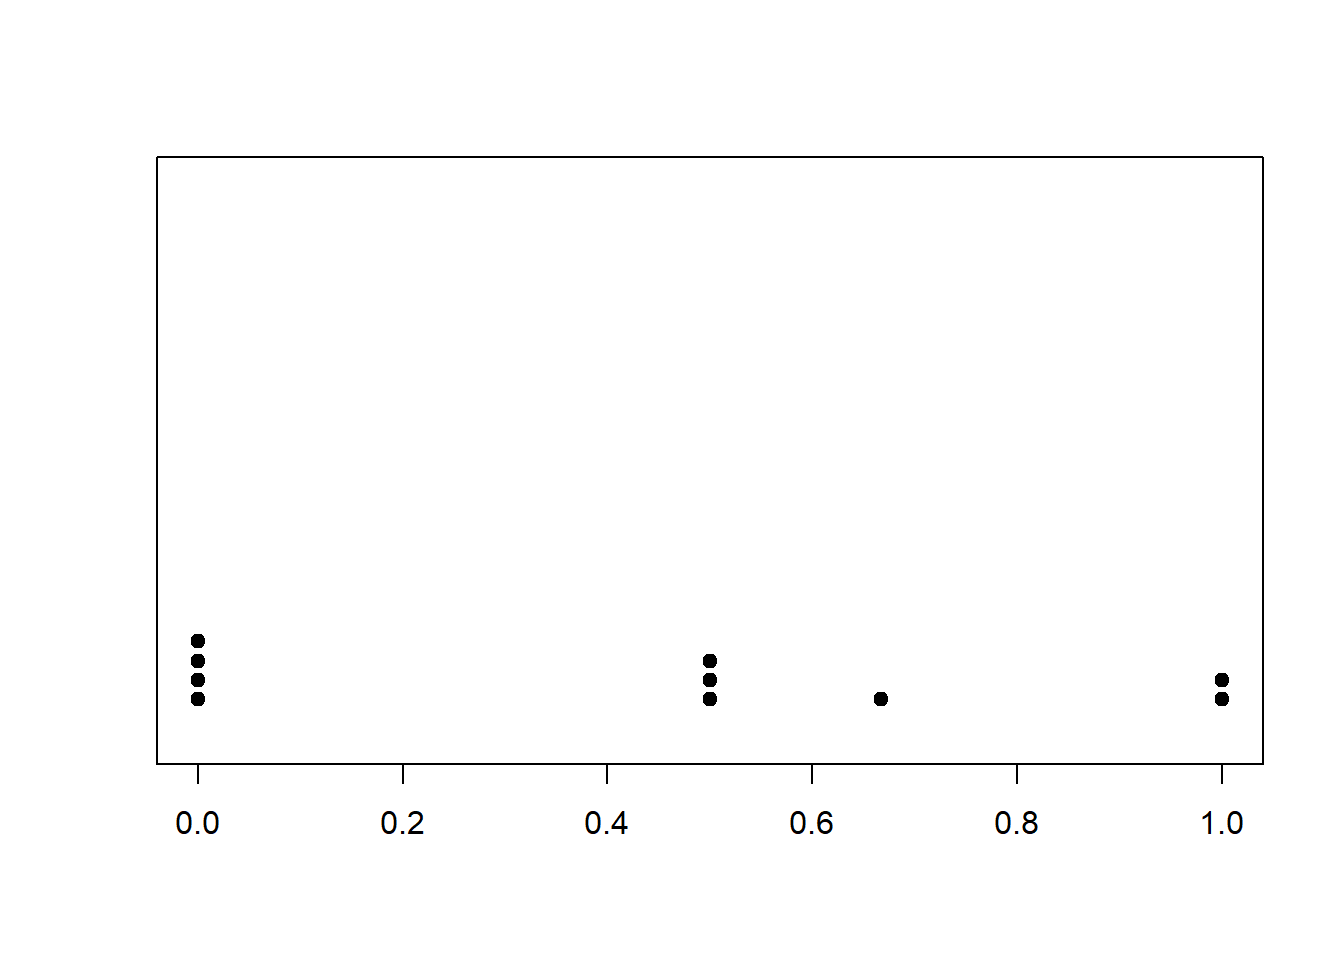
We can keep repeating the above process to investigate what happens in the long run. Rather than actually flipping coins, we use a computer to run a simulation. The table and plot below summarize the results of 1,000,000 successful repetitions of the simulation, after discarding the sequences with no flips following H. (We will see how to program and run simulations in later chapters.) While you can’t see the individual “dots” like in the above plot, each dot would represent a sequence of 4 coin flips (with at least one flip following a H) and the value being plotted is the proportion of H following H for that sequence. The results would look like those in Table Table 1.3, albeit a table with 1,000,000 rows (after discarding rows with no flips immediately following H.)
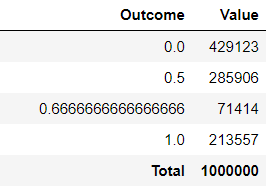
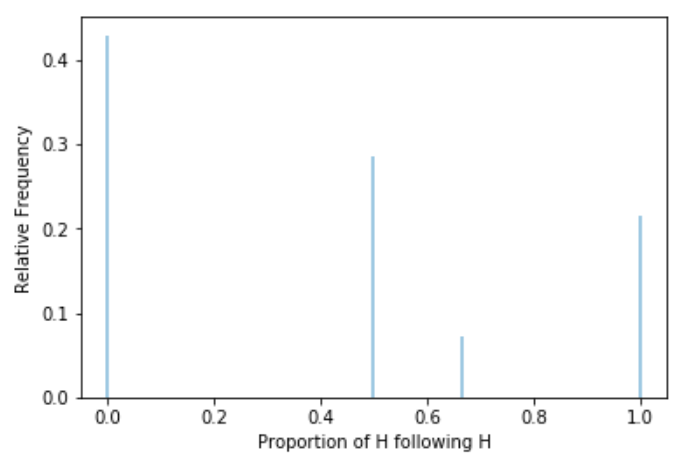
Figure 1.9: Proportion of flips immediately following Heads that result in Heads for 1,000,000 sets of 4 coin flips. (Each set has at least one flip immediately following H.) For example, the proportion of H following H is 0 in 429,123 of the sets.
We asked the question: what would you expect for the proportion of the flips which immediately follow a H that result in H? That depends on how we define what’s “expected”. If we are interested in the value that is most likely to occur when we flip a coin four times, then the answer is 0: we see that in the long run a little over 40% of the sets resulted in a proportion of 0, while only about 30% of sets resulted in a value of 1/2. We see that the plot is not centered at 1/2; a higher percentage of repetitions resulted in a proportion below 1/2 than above 1/2. We think that most people would find this surprising.
Another way to interpret “expected” is as “average”. Just as probability can be interpreted as long run relative frequency, there is a concept called expected value which can be interpreted as the long run average value. (We will investigate expected value in more detail in later chapters.) After 1,000,000 repetitions, each involving a set of four fair coin flips, we have 1,000,000 simulated values of the proportion of H following H. We could then average these values: add up all the values and divide by 1,000,000. It turns out that average value is 0.405, which is not 1/2. Again, we think most people find this surprising.
A quick note: the term “expected value” is somewhat of a misnomer. We are not saying that if we flip a coin four times we would expect the proportion of H following H for that set of flips to be 0.405. In fact, the simulation shows that on any single set of four fair coin flips, the only possible values for the proportion of H following H are 0, 1/2, 2/3, and 1. So in a set of four coin flips it’s not possible to see a proportion of 0.405. Rather, 0.405 is the average value of the proportion of H following H that we would expect to see in the long run over many sets of four fair coin flips. We will return to this idea later.
We will return to this example several times throughout the book to investigate these results more closely. For now, just observe that
- The study of probability can involve some subtleties and our intuition isn’t always right.
- Simulation is an effective way of investigating probability problems, and can reveal interesting and surprising patterns.
- There is a difference between (1) the probability that a flip following H lands on H and (2) the proportion of flips following H which follow H in a fixed sequence of coin flips.